

《1. Introduction》
1. Introduction
In recent modern electric railways, many countries have focused on enhancing the speed limit of commercial lines. Due to the rapid development of vehicular, track, electrical power, and signaling technologies, it is essential to evaluate and monitor the performance of trains and their infrastructure prior to commercial operation. In other words, the influence of increasing speed up to 400km·h−1 must be properly assessed in order to assure passenger safety. Therefore, efficient inspection technologies have also been of interest in order to overcome the limitations of manpower caused by the complex structure and long operation intervals [1,2].
Among the numerous components of high-speed electrical railways, overhead contact lines (OCLs) serve as one of the interfaces to constantly supply power to operating trains. However, due to the physical structure of OCL, the system is exposed to various mechanical and electrical effects [3]. These influences, which represent the quality of current collection, can be summarized into major parameters such as contact force and pantograph, loss-of-contact rate, percentage of arcing, and uplift of contact wire [4,5].
Recently, the Korea Railroad Research Institute (KRRI) successfully developed a 400 km·h−1 class railway vehicle and its infrastructures at a commercial line (Honam Express Line, 56 km) [6]. However, due to the fact that interaction between the pantograph and contact wires causes severe vibration and rapid variation in wave propagation and reflection, performance assessment of the OCL must be strictly conducted in an extensive matter in order to guarantee that power is stably supplied to the vehicle. This paper introduces the technologies that were adopted to assess the performance of the newly developed 400 km·h−1 class OCL [2,6]: Specifications of the core components are verified by physical measurement systems. The paper then introduces an indirect-contact wire dynamic stagger/height measurement system that was implemented by a simple charge-coupled device (CCD) camera [7].
The rest of the paper is organized as follows: In Section 2, detailed specifications of the established field-test site are provided. In Section 3, details of the developed non-contact video-based measurement system are provided. Finally, the results and conclusions are organized in the remaining sections.
《2. Material and methods》
2. Material and methods
As mentioned in the previous section, OCL parameters must be carefully configured in order to assure the safety of commercial operation. Therefore, configuration of the core components for the field-test site was determined by the results of previous research [2,6]. Table 1 contains the design parameters that were considered for the 400 km·h−1 class catenary developed by the KRRI. The field-test site was established with a simple type of catenary that is composed of ultra-high tensioned contact wires. Considering that the tension and weight of contact wires are the most influential factors in assuring high-quality current collection, the catenary is composed of an improved lightweight CuMg 150 mm2 alloy contact wire at 34 kN and a stranded CuMg 116 mm2 alloy contact wire at 23 kN.
Performance evaluation of the 400 km·h−1 class OCL components was conducted by deploying HEMU-430X (standing for high-speed electric multiple unit 430 km·h−1 experimental) [1] at speeds incremented from 60 km·h−1 to 410 km·h−1. Fig. 1 displays the considered OCL components along with a picture that was taken at the field-test site.
As organized in Table 2, the performance of the core OCL components is evaluated by monitoring values such as pantograph contact force, loss-of-contact rate, dynamic height/stagger of contact wires, strain, tensioning, and current. These parameters can be obtained by conducting track-side tests, which acquire measurements the moment the test vehicle passes the target location. It is determined that the OCL is reliable if all the parameters in Table 2 satisfy the permissible ranges for all considered test runs and speeds.
《Table 1》
Table 1
Design parameters of the 400 km·h−1 class overhead contact line (OCL) at Honam Express Line, Korea [2,6].

《3. Theory》
3. Theory
In this section, the video-based dynamic stagger/height measure—ment system is introduced. Note that some of the details included in this paper are to organize the modules that have been separately developed in previous studies. Unlike other performance assessment measures, dynamic stagger and height can only be measured by observing the displacement of contact wire locations in reference to the center of the pantograph. Therefore, dynamic stagger and height can only be measured by a contact-less interface that captures images of both the pantograph and contact wire, as illustrated in Fig. 2. The dynamic stagger/height measurement system shares the interface with a loss-of-contact rate measurement system based on the arc sensor, which is capable of detecting electronic waves outside of the visible wavelength range.
Fig. 3 shows the video-based measurement system that was installed on the HEMU-430X, which is the test vehicle that was deployed to evaluate the 400 km·h−1 class infrastructure. As shown in Fig. 3, the video acquisition system is installed in the direction of the pantograph in order to simultaneously record images of the OCL.
By means of the video acquisition interface illustrated in Fig. 2 and Fig. 3, dynamic displacement (i.e., the distance from the center of the pantograph to the face of contact) can be obtained. The procedure to obtain dynamic stagger and height is provided in Fig. 4 [2,7,8]. Since dynamic displacement is calculated by the distance from the center of the pantograph, it is necessary to find the precise location of the pantograph as well as the contact wires. Therefore, from the acquired image sequence, the location of the pantograph and its center are obtained first. Then, assuming that the contact strip may not be perpendicularly aligned to the angle of the camera, the contact strip is detected in the form of a line. Similarly, a line detection method is applied to detect the contact wires. Finally, the intersecting point between the pantograph and the contact wires is found and converted to dynamic stagger and height.
《Fig. 1》
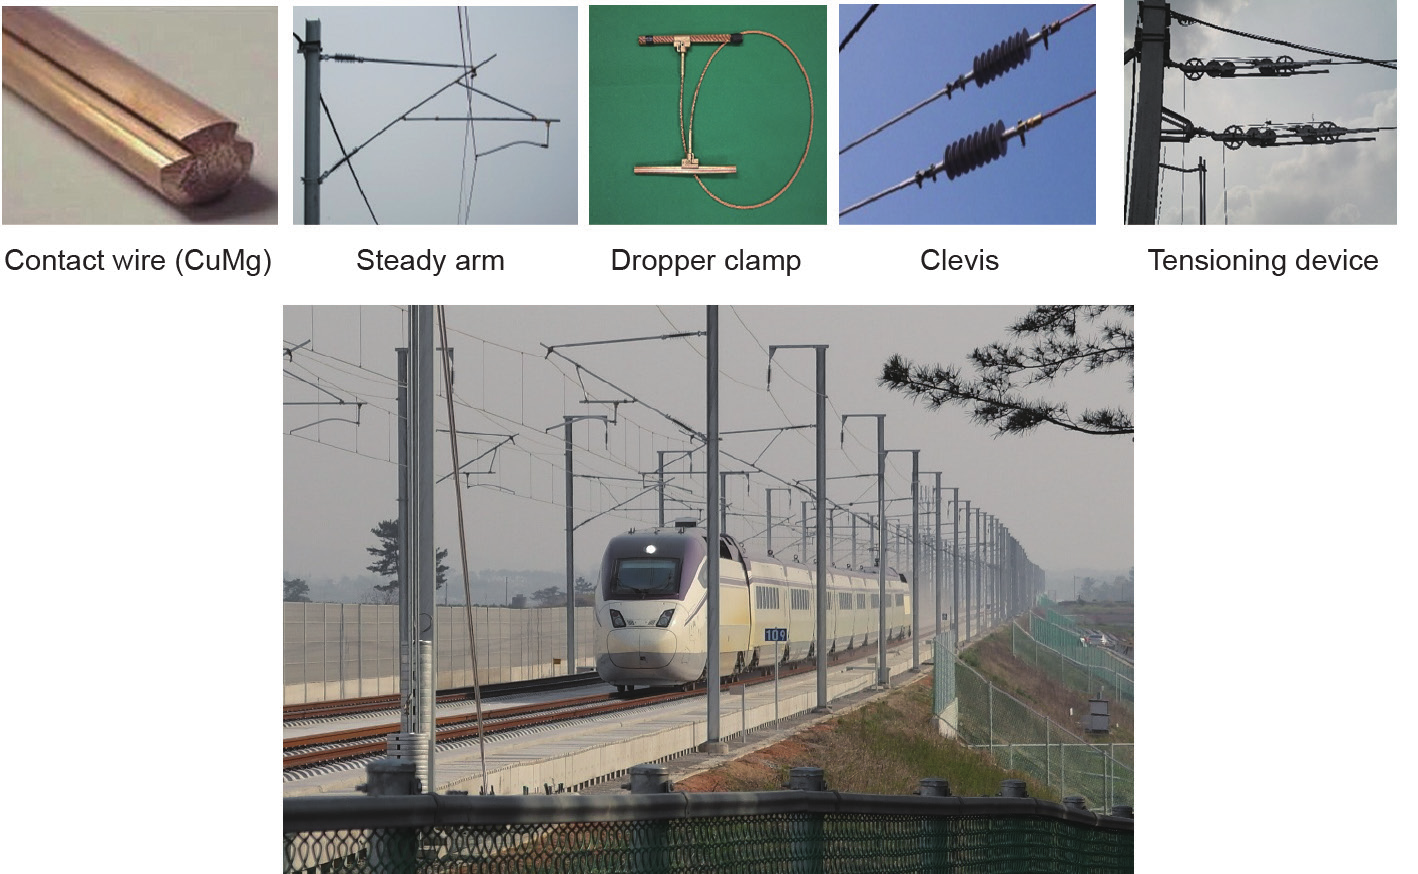
Fig.1 400km·h−1 class catenary components and installation at the field-test site [2,6].
《Table 2》
Table 2
Specifications of core components of OCL at 400 km·h−1 [2,6].

《Fig. 2》
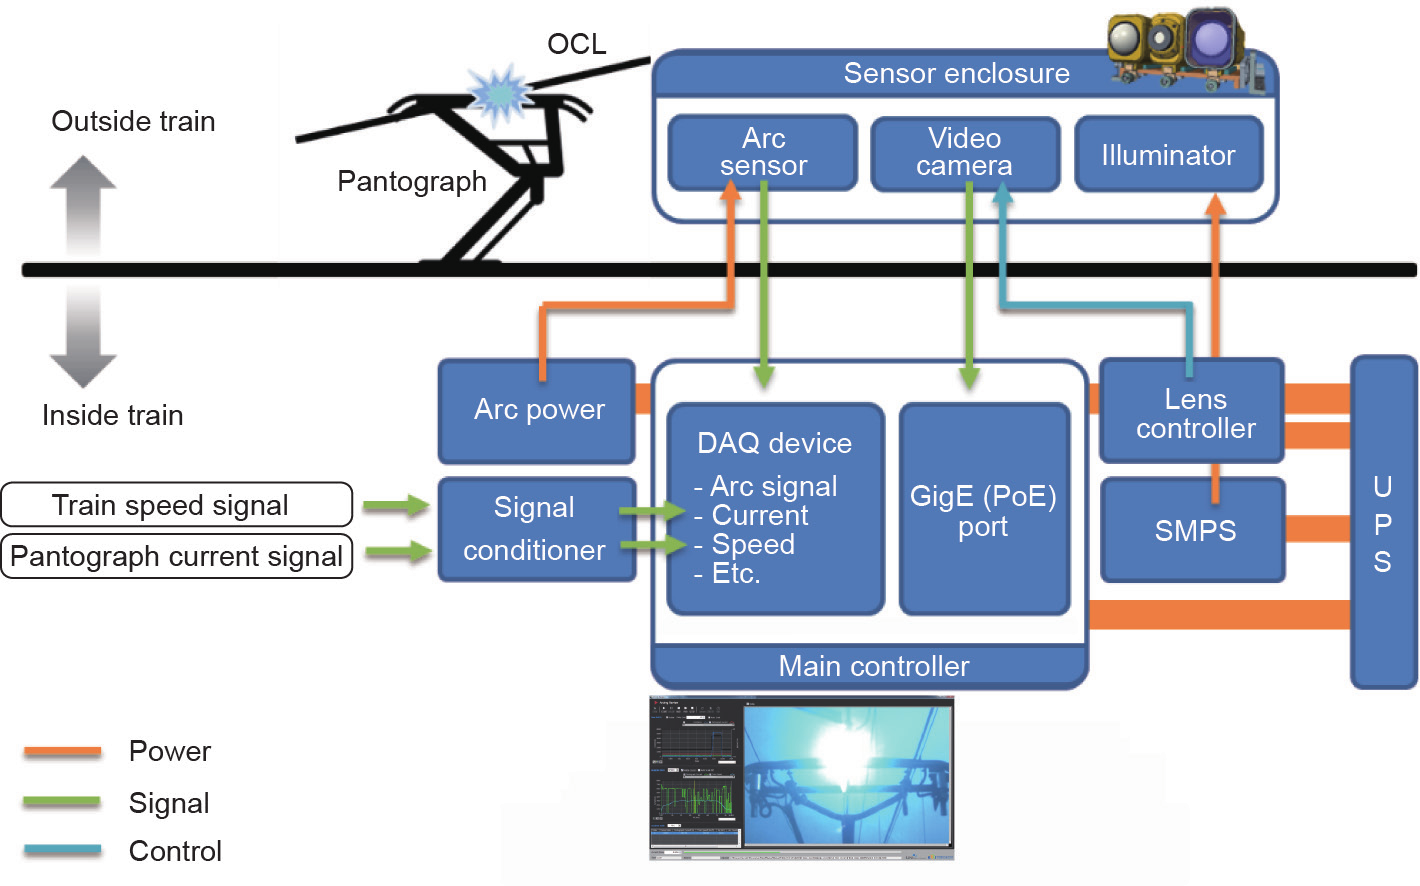
Fig.2 Shared structure of loss-of-contact rate and dynamic stagger/height measurement system. OCL: overhead contact lines; DAQ: data acquisition; GigE: gigabit ethernet; PoE: power over ethernet; SMPS: switched-mode power supply; UPS: uninterruptible power supply.
《Fig. 3》
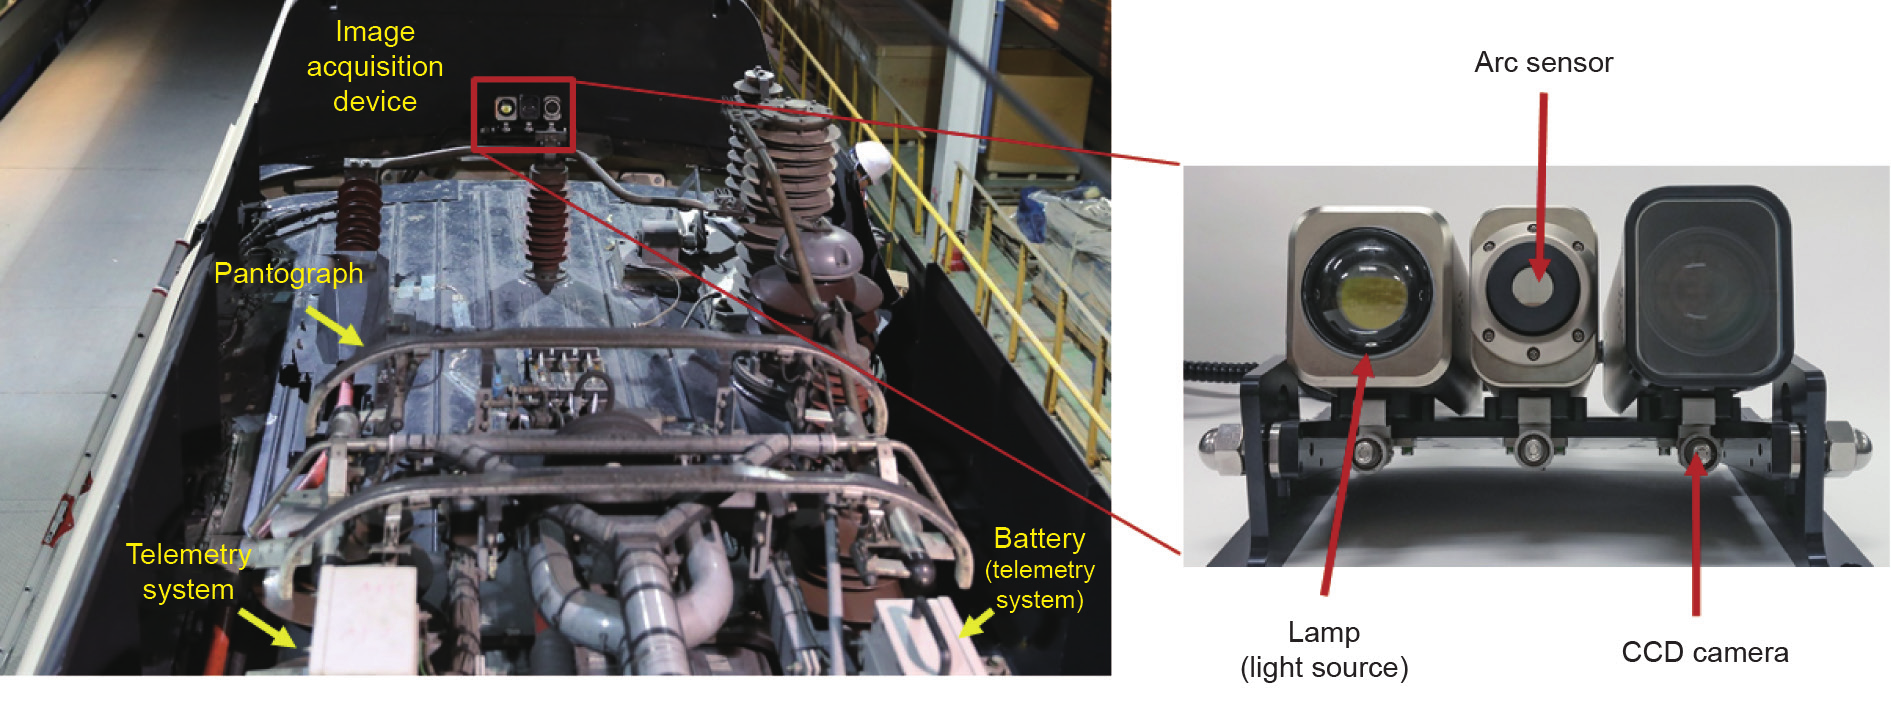
Fig.3 Installation of the video-based measurement system on the rooftop of the HEMU-430X.
The implemented OCL dynamic stagger/height measurement procedure is conducted by offline processing with video data recorded on mass-storage devices. However, under practical conditions, additional procedures must be considered to correspond to a possible degrading of performance. As shown in Fig. 5 [2,7], the practical dynamic stagger/height measurement system can be summarized in four steps.
Fig. 5 shows the practical sources of error. The first practical condition of error is the similarity between OCL components that cannot be distinguished automatically with information from a single image. The second practical condition is the rapidly changing background and light due to sunlight, which may frequently change the appropriate parameters for pantograph detection. In sections such as cross-sections, one or more contact wires can be observed and may be the source of error. Rapidly moving contact positions are caused by the low sampling rate, which is the limitation of simple CCD cameras at high speeds. Finally, in tunnels or complex scenes such as mountains or train stations, parameters must be adjusted. Details of the procedure are provided below.
The first step involves environment recognition, which determines the conditions and parameters for searching the pantograph. In the proposed system, the environment has been broadly categorized into three distinct cases: normal, background interference, and tunnel. As shown on the right side of Fig. 6 [9], the cases have varying illumination for several fixed areas within the collected image. For example, the normal case has brighter values in Area 1 in comparison with the tunnel case. Similarly, Area 2 has differing values. By collecting average intensity values from multiple images, it is possible to set a boundary to recognize the appropriate case. This boundary is called a “linear classifier.”
In the second step, pantograph/contact wire detection occurs, as illustrated in Fig. 7. The selected environmental case of the previous step is handed over to the detection step. The purpose of this second step is to find the most appropriate location of the pantograph, which is determined by the location having the highest similarity score over the search range.
In the third step, data association is conducted in order to filter out inaccurate measurements that can be obtained in practical conditions (Fig. 8). Between image sequences, the contact wire has a limited range of movement due to the relation between the time between image samples and the location of the contact wire. This limited range is defined as the validation region, and detection results outside of these regions are discarded as noise.
《4. Results》
4. Results
Table 3 displays the results obtained from the developed video-based measurement system that was installed on the HEMU-430X at the Honam Express Line. The results include parameters relevant to experimental conditions such as measurement interval, maximum speed, duration, and number of samples. Note that each of the result sets were acquired from separate test runs that considered measurements only between the minimum measurement speed and the maximum speed.
《Fig. 4》
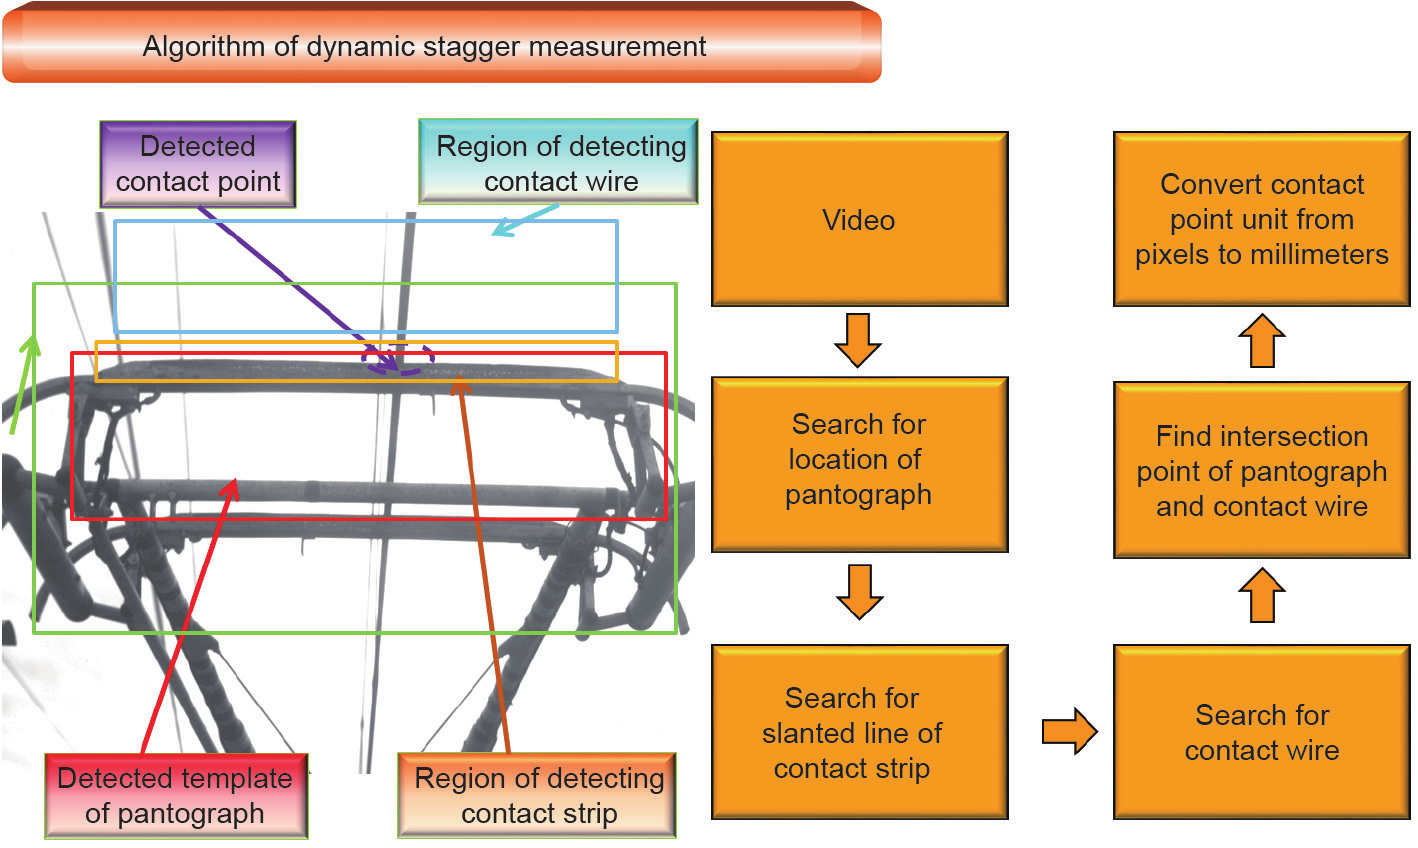
Fig.4 Procedure of OCL dynamic stagger/height measurement [2,78].
《Fig. 5》
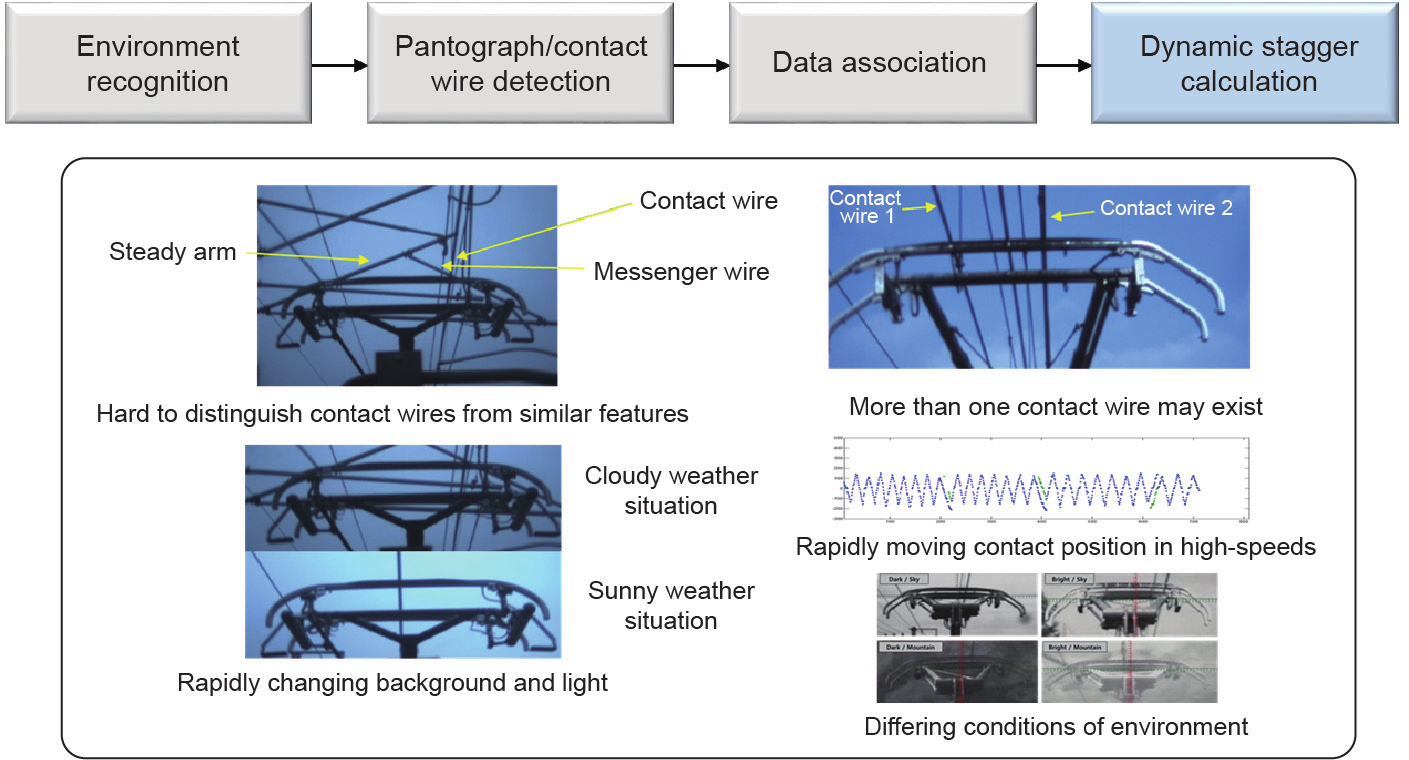
Fig.5 Procedure of practical dynamic stagger/height measurement [2,7].
《Fig. 6》
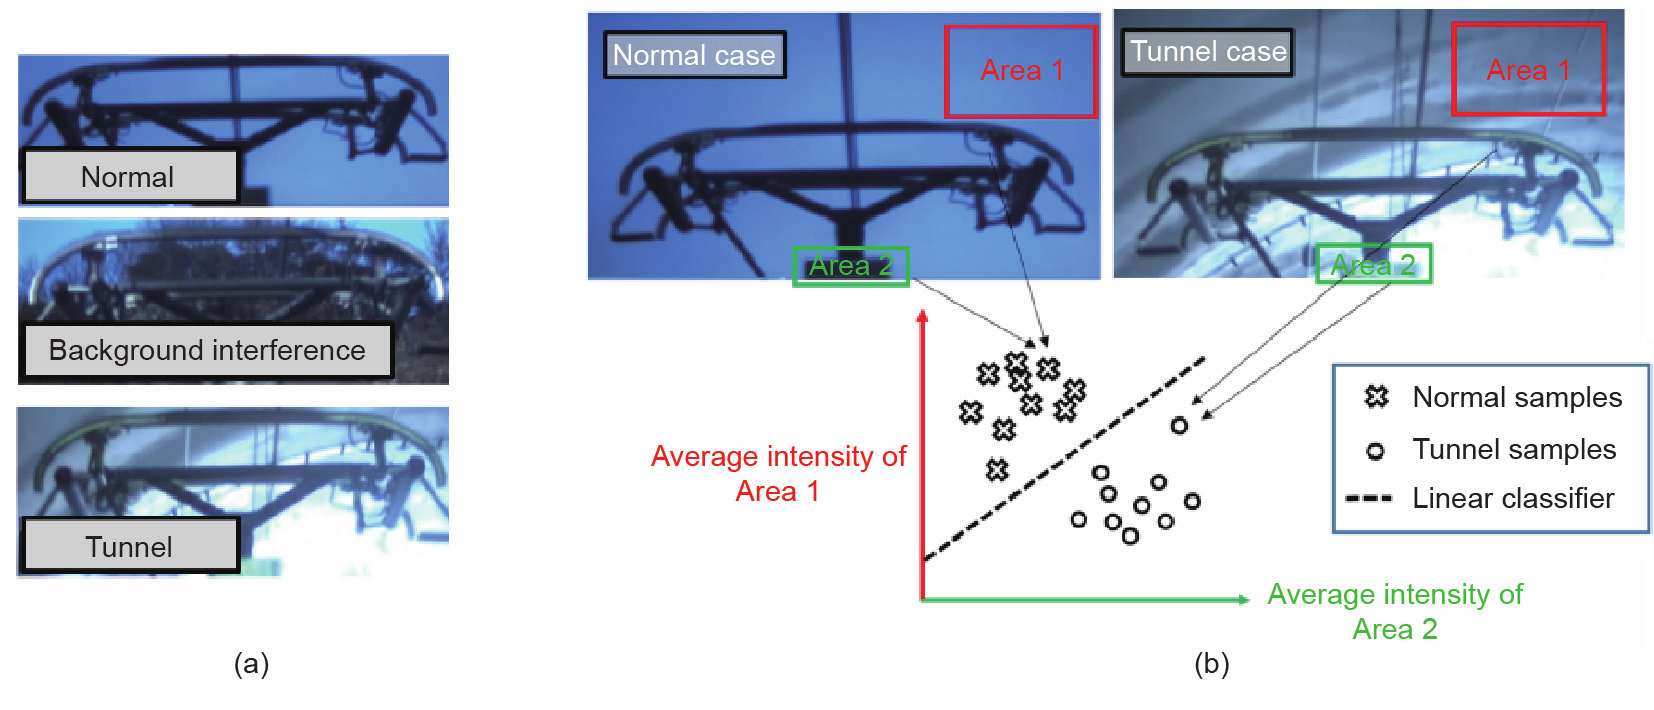
Fig.6 The procedure of environmental recognition [9]. (a) Differing conditions of environment; (b) feature vector of image.
《Fig. 7》
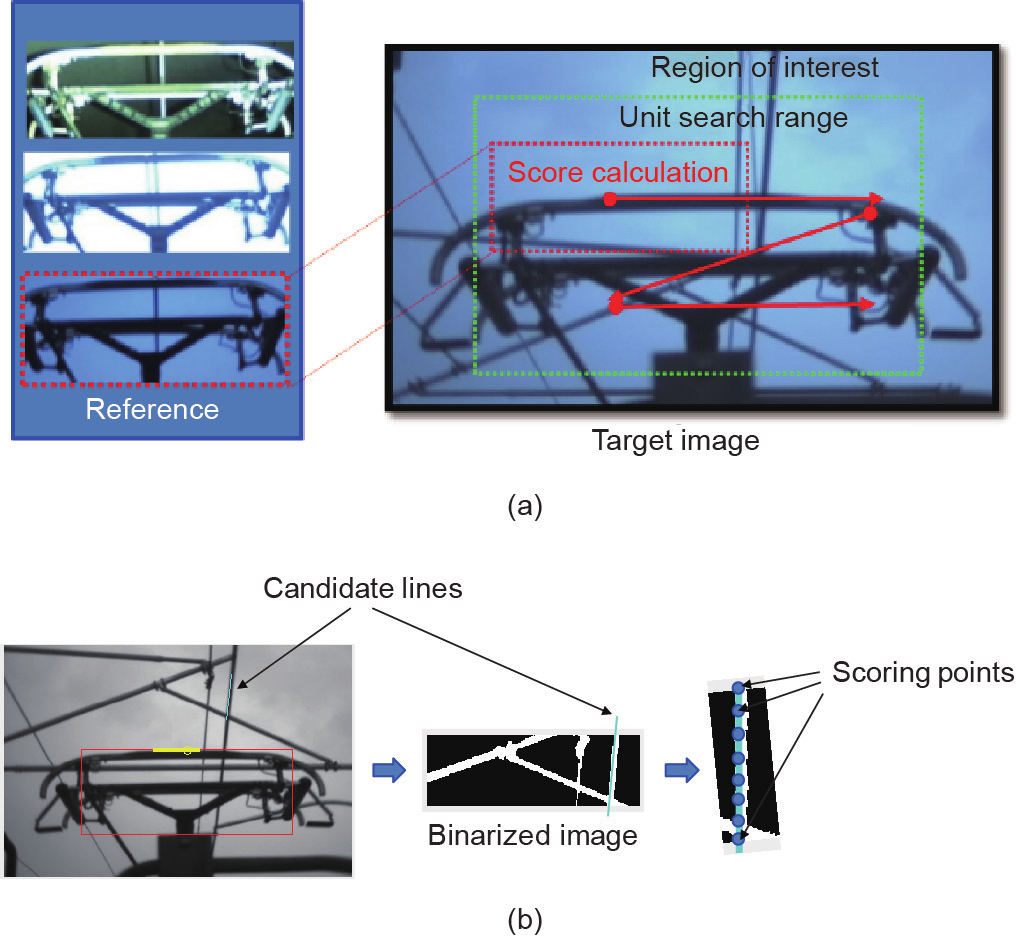
Fig.7 The procedures of (a) pantograph detection in image and (b) contact wire detection in image.
《5. Discussion》
5. Discussion
Fig. 9 shows the software platform of the implemented dynamic stagger/height measurement system. The left side of the figure shows a display of the running system for arc measurement, while the right side shows the proposed image-based monitoring system. As shown in the Fig. 9, the measurement system is capable of detecting both arc and measuring dynamic displacement of the OCL at the same time. According to the acquired measurements mentioned in the previous section, it is claimed that dynamic stagger is within the range of 250 mm in all considered sampling times. As anticipated by the influence of high operation speed on the contact between the pantograph and contact wires at 400 km·h−1, since the uplift force of the pantograph increases, it was observed that the variation of height increases as well. Although conventional methods that measure the static location of the contact wire without contact with pantographs are incapable of monitoring operating railway vehicles, the video-based method effectively measures the dynamics of the OCL.
《Fig. 8》
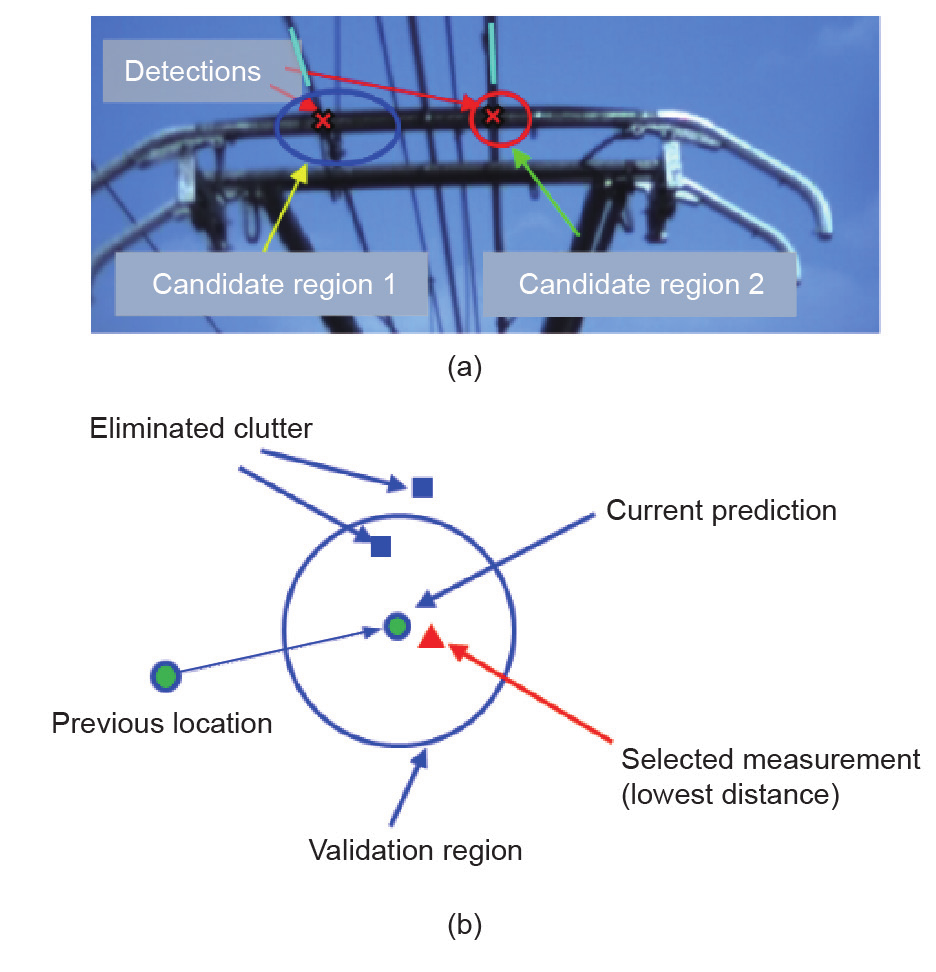
Fig.8 The procedure of data association. (a) Contact wire detection in cross sections; (b) application of data association.
《Table 3》
Table 3
Results of dynamic stagger measurement at 370 km·h−1 to 400 km·h−1.


Fig.9 (a) Arc measurement results of the HEMU-430X at 400 km·h−1; (b) dynamic stagger/height measurement results of the HEMU-430X at 400 km·h−1.
《 Table 4》
Table 4
Results of performance assessment.

As mentioned in the description of the configuration of the system, the set of images is obtained from an image acquisition device attached to the rooftop of the Korean 400 km·h−1 class HEMU-430X. In order to evaluate the performance of the proposed system, 300 frames were selected from three test runs over three days. The evaluation results are provided below in Table 4. According to the results, the error of the proposed system is approximately 8 mm, which is four pixels for a 720× 480 image. This error is also caused by the blurring that may occur between quickly changing images at very high speeds due to the limitation of image acquisition hardware. Therefore, it is anticipated that the error can be improved by adopting hardware with better specifications.
《6. Conclusions》
6. Conclusions
This paper introduces monitoring technologies that have been applied to evaluate the performance of OCLs, prior to the commercial operation of the 400 km·h−1 class high-speed railway that was developed by the KRRI. According to current collection performance assessment results that are represented by pantograph contact force, loss-of-contact rate, and contact wire uplift, it was observed that the measurements are within the limitations defined by component specifications. A video-based system, which was developed to improve conventional monitoring techniques that require manpower, was then applied in order to conduct contact-less assessment of current collection performance in terms of dynamic stagger and height. Based on the performance assessment techniques that were extensively conducted, it is claimed that it is possible to analyze the state of OCL, even at 400 km·h−1. Therefore, it is expected that the combination of the monitoring methods presented in this paper can provide quantitative representation of the performance of OCL.
《Acknowledgements》
Acknowledgements
This research was supported by a grant from the R&D Program of the Korea Railroad Research Institute, Republic of Korea.
Chul Jin Cho and Young Park declare that they have no conflict of interest or financial conflicts to disclose.


 京公网安备 11010502051620号


