

《1. Introduction》
1. Introduction
China is undertaking a massive economic restructuring, moving away from economic activities linked to high levels of environmental pollution and toward an ecologically balanced civilization. The development of green infrastructure, green industry, and pollution control for this transformation requires green investment, estimated at ¥1.7 trillion—2.9 trillion CNY ($274 billion 468 billion USD) per year up to 2020. This investment is required in multiple sectors, including urban infrastructure, waste treatment, energy supply and conservation, and transportation, as well as in areas such as industrial pollution reduction and the restoration of contaminated land and groundwater.
To plan, engineer, and finance such massive investments synergistically, that is, to create a green economy, it is necessary to understand the physical and economic interactions between infrastructure sectors. Based on the best available global infrastructure data collected at the Organization for Economic Co-operation and Development (OECD), we previously identified interactions between infrastructure sectors that would support a possible virtuous cycle of low-carbon growth [1,2]. At the core of this cycle are policies that encourage energy efficiency and low-carbon technologies for buildings and vehicles, and that direct investments away from fossil fuel infrastructure toward low-carbon electricity generation (Fig. 1). The cost savings that make low-carbon growth economically viable are large avoided costs in railway and port infrastructure, which are no longer required to transport large quantities of fossil fuels, as well as avoided costs in infrastructure for primary fossil fuel production.
Broadening this low-carbon growth model to include other environmental dimensions (e.g., water, air quality, and ecosystem services) and applying it specifically to China’s green transformation (Fig. 1) presents several important challenges and opportunities:
(1) With rapid urbanization occurring in China, there are opportunities to increase energy and resource efficiency through urban planning and to promote the development of low-carbon and energy-efficient land use, buildings, transportation systems, and vehicles.
(2) Land use, resource, and energy-efficiency decisions will also be key to building resilience to climate change and managing air quality and greenhouse gas (GHG) emissions, for example, by limiting flood risk and making space for water in human settlements in deltaic and coastal zones, protecting water supplies, limiting lock-in to emission-intensive transport patterns, delivering energy-efficient built infrastructure, and making space for renewable energy.
(3) Industry is a large user of fossil fuels in China. Opportunities for fuel switching and improvements in energy efficiency in industry may be even larger than the opportunities for buildings and vehicles.
(4) Great potential exists to save on large future planned investments in freight rail infrastructure. In 2013, coal transportation made up 58% of the total freight tonnage in China [3]. Use of the current freight rail infrastructure needs to be optimized to transport materials for the production of renewable energy technologies (e.g., iron ore for steel used in wind turbines). After 2020, when the use of coal has peaked, freed-up freight rail capacity can be used for transporting other goods.
(5) There may also be savings from avoided investments in water infrastructure, where water previously used on coal-related sectors becomes available for use elsewhere (e.g., Ref. [4], p. 35, Box 2).
(6) Attention to land use that generates ecosystem services such as replenishing water tables and flood buffering will also decrease the need for investment in hard infrastructure. One example of such land use is urban vegetation, which buffers pollution, improves quality of life, and increases the resilience of cities to storms and heat waves.
We have developed estimates of the required capital investments for most (but not all) of the infrastructure sectors described above in order to support a task force on green financing in China. More specifically, we developed investment needs for the seven-year period from 2014—2020 (inclusive) in the broad categories of sustainable energy, infrastructure (including for environmental protection), environmental remediation, industrial pollution control, energy and water efficiency, and green products (Table 1). These estimates were prepared for the China Council for International Cooperation on Environment and Development [5] and are based on Chinese policies in place as of 2015.
This paper is primarily a review paper. Its purpose is to describe the context of China’s green investment needs and to broadly lay out the infrastructure requirements to achieve China’s desired ecologically balanced civilization, including socioeconomic considerations. It concludes with key challenges for the engineering profession in enabling the green transformation. The main four sections of this paper frame the investments in the context of the following underlying factors: urbanization, climate change, freight rail infrastructure, and industrial pollution and environmental remediation. These four factors are apparent in Fig. 1, although the purpose of that figure is to illustrate interactions between infrastructure sectors in achieving low-carbon growth. While the four major factors are described sequentially in this paper, they are inherently interrelated. Challenges of environmental pollution are systemic, and will eventually only be overcome through a change in China’s industrial ecology toward a more circular economy and a change in agricultural practices [6,7]. For example, while air pollution can be partially reduced through air filters and other pollution-control technologies, the elimination of tailpipe and smokestack emissions through changing technologies is the more sustainable solution. China’s cities are drivers of economic growth, but they experience high levels of pollution, including land contamination, wastewater releases, and air pollution [8]. Through fundamental changes to China’s energy infrastructure in response to climate change, pollution in cities will also be systematically addressed. Replacing fossil fuels with renewable energy sources not only involves a reduction in GHG emissions and air pollution, but a dematerialization [9]. Reduced need to transport large quantities of heavy fossil fuels decreases the need for further investment in railways and port infrastructure, saving billions of yuan, and eventually freeing up capacity for other purposes.
《Fig. 1》

Fig.1 Interactions between infrastructure sectors in the virtuous cycle of low-carbon growth in China, including urban planning and land use. (Adapted from Refs. [1,2])
《Table 1 》
Table 1
Estimated capital demand for Chinese green infrastructure (total over 7 years, 2014-2020 (inclusive); adapted from Ref. [5] with updates).

Such fundamental changes in China’s cities and infrastructure systems need to be skillfully guided through careful changes to government policies and the creation of market mechanisms that encourage green investment and financing in the private sector [10]. In developing a green economy, there are also sociopolitical aspects to be addressed, including equity issues and institutional capacity building. China has the opportunity to choose between different development pathways. Decisions on policies and the use of market mechanisms will determine both the pollution intensity of the Chinese economy and how much the government has to invest directly from its own funds into managing environmental impacts and resources. The contribution of engineers in planning, designing, and constructing China’s new green infrastructure will be furthered by understanding the broad policy context and the interactions between land use, infrastructure, and environmental performance.
《2. Urbanization》
2. Urbanization
China is urbanizing at a rate of about 1% per year, and expects to reach 60% urban population (830 million people) by 2020, using a sustainable people-centric approach. The rate of urbanization continues a trend that has seen China’s urban population transition at about 1% per year, with the urban share of the population growing from 19.4% in 1980 to 52.6% in 2012 [11,12]. The energy and material flows associated with China’s megacities are among the fastest growing in the world [13]. The manner of the future urbanization to 2020, as described in the National New-Type Urbanization Plan ( 2014 — 2020), is intended to be focused on quality of growth, equity, environmental protection, and quality of life [8]. This new form of urbanization requires substantial investment in urban infrastructure, as discussed below, including public transportation, commercial and residential buildings, water supply, wastewater treatment, and solid waste facilities.
Land-use planning is particularly important under the new urbanization plan. The urban built-up area grew by 78.5% over the past decade alone, while the urban population grew by 46% [11]. Better urban planning and reforms to land markets such as those that will achieve high population densities and mixed land use will help China build more compact and sustainable cities [8]. There is potential to clean up despoiled industrial sites and remediate contaminated surface and groundwater sites, as noted above, which will add value to land and prevent deepening water shortages. Appropriate land-use planning will support investments in natural infrastructure (e.g., watershed protection) and in the buildings and urban transportation sectors, as discussed further below, which are key to sustainable city development. The National New-Type Urbanization Plan ( 2014 — 2020) calls for 50% of new buildings in cities to be classified as green buildings by 2020 and for a 15% increase in motorized transportation mode share by public transportation (Table 2).
《2.1. Urban water supply》
2.1. Urban water supply
Several regulations and plans are guiding China’s investments in water supply infrastructure. In 2012, China fully implemented the new Standards for Drinking Water Quality. Under the Plan on Environmental Protection of China’s Urban Drinking Water Sources ( 2008 — 2020)†, the proportion of water sources meeting the standard shall increase from 80.26% (2007) to 95% (2020), along with increased monitoring. Furthermore, the Action Plan for Water Pollution Prevention and Control†, released by the State Council in April 2015, requires that 93% of centralized drinking water sources in cities at the prefecture level or above must exceed water quality standard level III by 2020. Water-leakage rates of public pipe networks must also be limited to a maximum of 10%. Expected investments (2014—2020; middle-range estimates) resulting from these plans are: ¥196 billion CNY for water pollution, prevention, and control; ¥31 billion CNY for the South-to-North Water Diversion Project; and ¥0.63 trillion—1.2 trillion CNY for urban water supply plants and pipe networks (including pipe reconstruction and leakage reduction). To help realize these investments, the government might consider expanding its capacity for water quality monitoring, evaluating a public-private partnership (PPP) model for the operation of urban water infrastructure, and raising water prices to be consistent with high levels of willingness to pay for quality water.
† http://www.nmgepb.gov.cn/govcatalog/wrfz_2408/201305/t20130528_86641.html
† http://www.gov.cn/zhengce/content/2015-04/16/content_9613.htm
《Table 2 》
Table 2
Infrastructure, resource, and environment indicators and targets from the National New-Type Urbanization Plan (2014-2020). (Adapted from Ref. [11])

a Data from 2011.
b Standard is 65–115 m2 for urban built-up area, and 85–105 m2 in newly developed cities.
《2.2. Municipal sewerage and wastewater treatment》
2.2. Municipal sewerage and wastewater treatment
At the end of 2013, 83% of domestic sewage was being treated in China, but very few sewage treatment plants were reaching the highest type IV surface water quality standards. An estimated ¥474 billion 989 billion CNY of investment (total for 2014—2020) is required to rectify this issue, as detailed here. According to the Action Plan for Water Pollution Prevention and Control, by 2020, urban sewage collection rates for counties and cities will be 85% and 95%, respectively. Increases in treatment capacity and existing sewage treatment capacity upgrading will require ¥714 billion CNY (upper estimate) from 2014 to 2020. In addition, approximately ¥275 billion CNY is required from 2014 to 2020 in order to provide or restore network services. Some financing might be achieved by raising, monitoring, and enforcing water emission standards and by taking a total cost-pricing approach to sewage treatment and collection. Research on technologies that capture useful resources from wastewater such as energy, nitrogen, phosphorus, metals, and water is also warranted. The example of using sewage gas as a transportation fuel in Swedish cities [14] might be considered in China.
《2.3. Municipal waste》
2.3. Municipal waste
Municipal waste treatment practices are undergoing rapid transformation in Chinese cities. In 2013, national municipal waste generation was about 3 × 10⁸ t, of which 58% was handled by municipal waste treatment systems. By 2015, under the 12th Five-Year Plan, municipal waste treatment capacity will increase to 3.18 × 10⁸ t·a−1, with 59% going to landfill, 35% to incineration, and 6% to composting and other approaches. With an expected doubling of per capita income from 2010 to 2020, the rate of municipal waste generation is expected to increase to 0.58 t·a-1 per capita. By 2020, the total amount of municipal waste generated (excluding construction waste) will be approximately 4.81 × 10⁸ t·a−1. Total investment requirements were estimated to be ¥125 billion 649 billion CNY. Some of the cost could be covered by raising disposal costs. To manage volumes of municipal waste, Chinese cities could make advances in applications of urban industrial symbiosis (i.e., through the sharing of byproducts between industries, including municipal wastes), thus reducing costs, wastes, and environmental impacts [15,16].
《2.4. Buildings》
2.4. Buildings
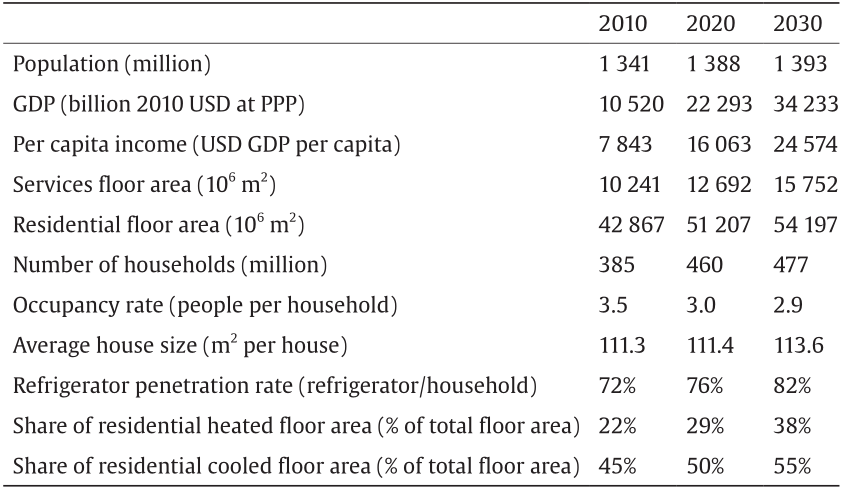
Building energy use accounts for about a fifth of total primary energy consumption in China (excluding biomass) [17] and is expected to increase in coming decades, requiring substantial investment, although there is considerable variation in projections. Rural residential buildings form the largest energy-consuming sub-sector, but this is because of the predominant use of inefficient traditional biomass. Moreover, rural buildings are not subject to mandatory building codes, unlike buildings in cities, which is where most growth is occurring. There were approximately 5 × 10¹⁰m2 of building floor space in 2010 (Li and Shui report 4.86 × 10¹⁰ m2 [17], while the International Energy Agency (IEA) reports 5.31 × 10¹⁰ m2 [18]). Projections of future floor area and building energy use are sensitive to assumptions about economic growth, social conditions, and building practices; hence, they differ. The IEA expects floor space to grow at about 1 × 10⁹ m2·a−1, reaching 6.39 × 10¹⁰ m2 in 2020 (Table 3) [18], while Li and Shui expect China to continue adding about 1.7 × 10⁹ m2·a−1 [17]. Increases in the use of refrigerators and the proportions of floor areas that are heated and/or cooled will add to energy demands (Table 3). The IEA predicts that China’s annual building energy use in 2020 will reach 25 EJ under business-as-usual conditions, or 21 EJ under a 2 °C climate policy scenario [18]. Electricity and natural gas demands increase substantially in both scenarios, following from urbanization. With such increases in energy use, investments in China’s building stock will also impact investments in the energy sector.
China has implemented many successful policies in the building sector in recent years [17]. The first residential building codes were developed in 1986 and have undergone two subsequent revisions. As a result, primary energy consumption in North China (the coldest of China’s five climate zones) fell from 198 kW·h·m−2 in 1996 to 142 kW·h·m−2 in 2008. There has been rapid uptake in solar thermal heating and vigorous promotion of energy-efficient lighting. Compliance with the building code improved from 53% at the design stage and 21% at construction in 2005, to 99.5% and 95.4%, respectively, in 2010 [17]. Financial support has been made available for retrofitting existing buildings: ¥24.4 billion CNY was provided (from national, municipal, and other sources) during the 11th Five-Year Plan (2006—2010); rates for the 12th Five-Year Plan (2011—2015) are ¥55 CNY·m−2 and ¥45 CNY·m−2 for the severe cold and cold regions, respectively. Several tax incentives also support energy efficiency. Some of China’s cities have been particularly active in promoting energy efficiency such as Tianjin, in which there is a demonstration ecological development. The provinces where cities are reaching the highest penetrations of energy-efficient buildings include Jilin, Inner Mongolia, Sichuan, and Hebei (Fig. 10 in Ref. [17]).
《Table 3 》
Table 3
Expected changes in drivers of energy demand in the Chinese building sector. (Adapted from Table 2.3.1 in Ref. [18])
There is still considerable scope for improvements to the energy efficiency of Chinese buildings [17,18]. A comparison of U values (a measure of the conductance of the building envelope; higher values are less energy efficient) for components of the building envelope shows that China’s building codes are much less stringent than those of many Western countries, regions, and cities, especially those with colder climates (Fig. 2). The incremental cost of achieving Swedish building code standards for all new buildings in China from 2014 to 2020 is estimated to be ¥520 billion CNY†. (Green building investments in China are expected to be ¥97 billion—240 billion CNY, so they will likely not meet Swedish standards.)
† This estimate assumes an increase in building floor area of 6.475 × 10⁹ m2 (based on Table 3) and an incremental cost of ¥80 CNY·m–2 (based on a value of ¥61 CNY·m–2 that was found in Ref. [19] and adjusted for inflation from 2005 to 2014 CNY).
Financial incentives for encouraging energy efficiency are partly undermined by energy price subsidies, and the retrofitting of existing buildings remains underdeveloped due to insufficient financial and technical capacity. Li and Colombier [19] propose a clean development mechanism (CDM)-like carbon financing scheme that involves aggregating individual development projects in a programmatic manner. Li and Shui [17] note that information about building energy information is limited. There is a recently established nation-wide building monitoring system; however, transparent and integrated databases on energy use have not been established. Consumers can also be misled by the energy-efficient designation of a building, since the baseline reference is a 1980s design with no energy-saving measures.
Among the improvements that Li and Shui [17] recommend is institutionalizing regular updates to the building code. Such revisions to the code could potentially encourage the technological advancements recommended by the IEA [18]: more efficient heating equipment in colder regions, including solar thermal, heat pumps, biomass boilers, and micro co-generation; bi-modal (heating and cooling) heat pumps in central climatic regions; and solar roof-top units and high-efficiency heat pumps in southern regions.
《2.5. Urban and intercity transportation》
2.5. Urban and intercity transportation
Investment in the transportation sector is important for improving air quality, mitigating regional- and global-scale environmental pollution, and addressing growing demand. Green investment in the transportation sector is needed in order to deliver greater mobility while reducing the associated pollution and fuel consumption. Construction of urban and intercity passenger rail will generally be effective in meeting these goals where population densities are high enough to provide sufficient ridership. Environmental impacts can also be reduced through an uptake of electric vehicles, provided that the intensity of GHGs and other environmental pollutants from electricity generation are reduced.
《Fig. 2》
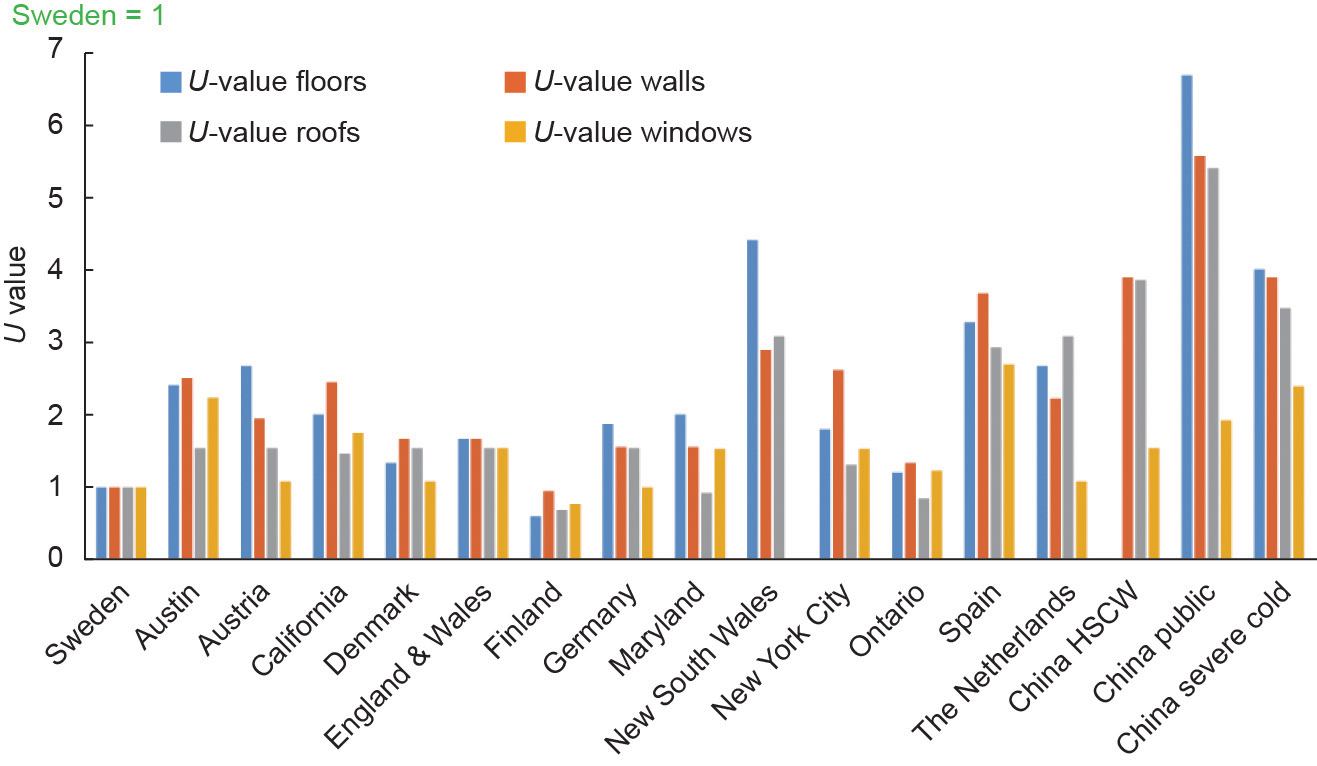
Fig.2 Comparison of normalized U values for floors, roofs, walls, and windows in select Chinese building codes against those of other nations, regions, and cities. HSCW: hot summer and cold winter. (Adapted from Fig. 7 in Ref. [17])
China has bold plans to manage the rapid growth in demand for transportation services, which causes congestion in its booming cities and on national transportation networks. Overall, national transportation demand is expected to approximately double this decade, with passenger travel reaching about 6000 billion person-km and freight transport reaching about 24 000 billion tonne-km by 2020 (Table 4). The stock of privately owned vehicles has grown at 20% per year since 2000 [20]. Vehicle sales in China surpassed those in the US in 2009 [21], although vehicle ownership in 2012 was only 81 per 1000 people, similar to that in the US in the 1920s [22]. Several studies estimate that the stock of private vehicles will reach 150 million by 2020, thereby increasing by a factor of four in under a decade [23]. This increase is expected even given the vehicle registration restrictions in place in Beijing, Shanghai, and other large cities. Consequently, the transportation sector is one of the fastest growing energy-consuming sectors in China, with energy use increasing from 25.2 mtoe (million tonnes of oil equivalents) in 1980 to 340 mtoe in 2012 [24,22].
Further developments of urban rail transit systems, electric vehicles (EVs), and high-speed rail are three of the key strategies for overcoming congestion and pollution in Chinese cities and for connecting them with high-quality service. Passenger volume on urban rail transit in Chinese cities has increased by a factor of 44 from 2001 to 2009 (based on data in Ref. [23]). Many Chinese cities are constructing rail transit systems. By 2020, the total length of lines is expected to be about 7400 km, about seven times the length in 2009 [23]. The capital investment required between 2014 and 2020 is ¥3.0 trillion—4.5 trillion CNY. While the intent is to increase mode share by public transit in large cities (Table 2), changes in road vehicle technology are also required in order to eliminate air pollution from transportation.
Many policies have already been implemented in Chinese cities to encourage the uptake of EVs. The national government and some local governments offer substantial subsidies on purchases of plug-in hybrid and battery EVs. In 2012, the Development Plan for Energy-Saving and New-Energy Vehicles was approved by the China State Council, with the objective of achieving a stock of 500 000 EVs by 2015 and 5 million by 2020 [20]. The estimated capital investment for factories to build EVs is ¥280 billion 775 billion CNY. Investment in vehicle charging infrastructure is also required. The Ministry of Finance is encouraging the purchasing of EVs with subsidies (per vehicle) of ¥50 000 CNY for plug-in hybrid EVs and ¥60 000 CNY for battery EVs. Based on these values, the total subsidy to add 4.5 million EVs between 2015 and 2020 is between ¥225 billion CNY and ¥270 billion CNY. This amount may be lower if the subsidies are reduced. With the costs of EV batteries rapidly decreasing [26] and the driving range of new model EVs expected to compete with that of internal combustion engines, China’s target for 2020 is achievable.
By 2020, China also plans to have 25 000 km of high-speed rail line in operation, connecting major urban agglomerations and most provincial capitals along eight major rail corridors. The combination of high-speed rail stations and new urban transit lines should lead to increased land values in Chinese cities, some of which might be captured and used to finance the infrastructure.
《2.6. Energy implications of urbanization》
2.6. Energy implications of urbanization
The transformation of China’s transportation systems and building design practices, as well as that of its urban industrial energy use, is important for China’s development of sustainable cities because the growth of cities has inherently involved a greater use of energy. Between 1980 and 2011, total energy use in China increased at a slightly faster rate than the urbanization rate [12,27]. Understanding how the quantity of energy used in Chinese cities changes with urbanization and encouraging market actors to invest in clean energy sources is necessary for the transformation to sustainable energy sources in China’s cities. This transformation will reduce pollution, improve air quality [28,29], and help achieve China’s quality-of-life goals; it will also substantially contribute to the mitigation of GHG emissions.
《3. Climate change》
3. Climate change
Recognizing the severe global consequences of increased atmospheric concentrations of anthropogenic GHGs, China is pursuing low-carbon growth strategies that are consistent with its overall green economy, environmental, and quality-of-life objectives. This section describes the expected green investments in clean electricity generation, biomass energy, energy efficiency, and water efficiency to 2020; it then covers longer term developments (beyond 2020) in high-efficiency coal generation and renewables. Reducing China’s GHG emissions will be achieved through a massive transformation of its electricity generation technology toward a power mix that is dominated by renewables, with a minor role for high-efficiency coal generation. This transformation is so fundamental that it goes beyond assumptions made in past studies of energy-economy linkages in China.
《3.1. Current GHG emissions》
3.1. Current GHG emissions
We estimate that China’s GHG emissions for 2014, from all sources, were likely of the order 12 Gt CO2e (the shorthand for carbon dioxide equivalents); however, this value is highly uncertain. Our rough estimate is based on trends in China’s CO2 emissions (shown in Table 5), combined with historical emissions of methane and other GHGs. China’s last national GHG inventory, which was submitted to the United Nations Framework Convention on Climate Change (UNFCCC) in 2012†, provides emissions for the year 2005; the economy has since grown by 132% [30]‡. In 2005, the total emissions are reported as 7.47 Gt CO2e excluding land-use change, or 7.05 Gt CO2e including land-use change. Of the total excluding land-use change, 5.98 Gt CO2e (80%) was CO2 emissions, with the five other GHGs totaling 1.49 Gt CO2e (of which methane emissions were 933 Mt CO2e). Zhang and Chen [31] have since estimated China’s methane emissions for 2007 to be 990 Mt CO2e. Several organizations outside of China provide annual estimates of CO2 emissions from fossil fuels, and in some cases cover other sources such as cement (Table 5). The most recent estimates of China’s CO2 emissions for 2014 are on the order of 9.7 10.6 Gt CO2.
† The Second National Communication on Climate Change of The People’s Republic of China; also available at http://www.ccchina.gov.cn/archiver/ccchinaen/UpFile/Files/ Default/20130218145208096785.pdf.
‡ Change in constant PPP international USD GDP from 2005 to 2014 [30].
《 Table 4 》
Table 4
China’s expected transportation system characteristics for 2020.

《3.2. GHG targets》
3.2. GHG targets
The level of ambition or the extent of action on GHG mitigation that can be considered consistent with green growth is an open question. In the US-China Joint Announcement on Climate Change and Clean Energy Cooperation, China is committed to peaking in CO2 emissions around 2030, and aims to expand its energy consumption from non-fossil fuel sources to around 20% by 2030. In the short term, by 2020, an important target for China should be to reduce the carbon intensity of its electricity supply to below 600 t CO2e·(GW·h)−1. This is a key threshold below which electrification can enable GHG reductions in other sectors such as EVs in transportation or heat pumps in buildings [36]. As of 2014, China’s electricity had a carbon intensity of approximately 690 t CO2e·(GW·h)−1, but it would be below 600 t CO2e·(GW·h)−1 in 2020 under the IEA New Polices Scenario [37]. In the long run, the Chinese chapter of Pathways to Deep Decarbonization illustrates how China’s energy-related CO2 emissions for 2050 might be reduced by 34% relative to 2010 emissions [38]. A study of high penetration of renewable energy in China has explicit goals of not exceeding 3.5 Gt CO2 for the whole energy sector and 1.5 Gt CO2 for the power sector [39]. To achieve these targets will require over 60% of total energy consumption and over 85% of electricity supply to come from renewable sources by 2050. Setting a clear GHG reduction target is part of a broad set of policies that will help to attract the necessary investment in the power sector [10].
《3.3. Current and planned clean electricity generation until 2020》
3.3. Current and planned clean electricity generation until 2020
In 2013, 398 GW of China’s 1260 GW of electricity generation capacity used renewable or clean energy sources, but this is expected to grow by 2020. Of the 398 GW of clean and renewable capacity in 2013, 280 GW was hydropower, 77 GW wind power, 18 GW solar power, 14 GW nuclear power, and 8.5 GW biomass. Financial investments in renewable energy have been growing substantially, increasing by 20% per year from 2008 to 2013. The buildup of wind power has been particularly rapid (Fig. 3). Under the Strategic Action Plan on Energy Development (2014—2020)††, China’s gross installation capacity of wind power will reach 200 GW by 2020, at an estimated cost of ¥984 billion CNY. According to China’s National Plan on Addressing Climate Change (2014—2020), the solar generation capacity in 2020 will be 150 GW, requiring approximately ¥1320 billion CNY investment from 2014 to 2020. Under the same climate change plan, the gross installation capacity of nuclear power will be increased to 58 GW by 2020, at an estimated cost of ¥867 billion CNY. Hydropower capacity will also be increased to 420 GW by 2020, under the 12th Five-Year Plan on Renewable Energy† issued by the National Development and Reform Commission (NDRC), through investments of about ¥840 billion CNY. Further investments of ¥258 billion CNY in biomass generation will increase its capacity to 30 GW in 2020. Overall, investments of ¥4.27 trillion CNY are expected to increase China’s renewable and clean energy electricity capacity to 858 GW by 2020. (This would be approximately 40% of China’s generating capacity in 2020, based on Fig. 7 in Ref. [39].)
†† http://www.gov.cn/zhengce/content/2014-11/19/content_9222.htm
† http://www.sxdrc.gov.cn/xxlm/xny/zhdt/201212/t20121213_67157.htm
《Table 5》
Table 5
Estimates of GHG emissions for the mainland of China (excluding Hong Kong) in 2005-2014. (Adapted from Refs. [32,33,34,35])
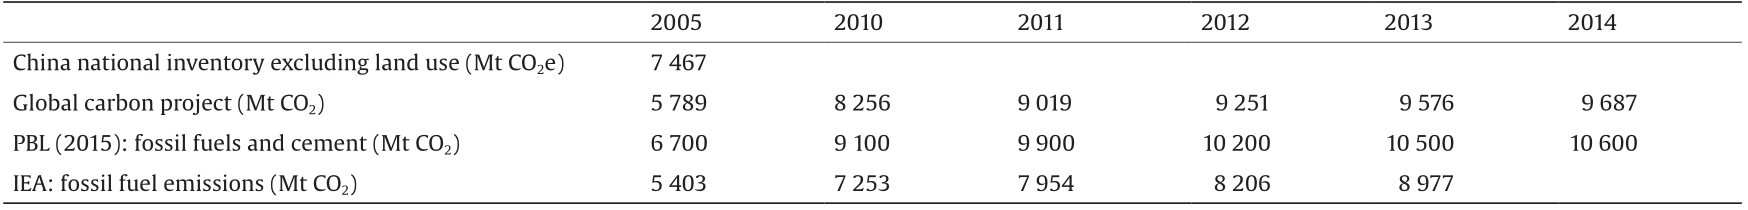
PBL: planbureau voor de leefomgeving (Netherlands Environmental Assessment Agency).
《Fig. 3》

Fig.3 Sources of future power generation in China under the International Renewable Energy Agency (IRENA) [4] and the Energy Research Institute (ERI) [39] high renewable energy scenarios, with comparison to the IEA New Policies Scenario for 2030 [37]. MSW: municipal solid waste.
《3.4. Biomass energy (non-electricity)》
3.4. Biomass energy (non-electricity)
By 2020, utilization of China’s biomass for non-electricity energy will reach the equivalent of approximately 6 × 10⁷ t of standard coal. The development of biomass energy is guided by documents such as the guidelines for the Medium- and Long-Term Development Plan for Renewable Energy in China, the 12th Five-Year Plan on Renewable Energy, and the guidelines for the Development Plan for National Forestry Biomass ( 2010 — 2020)‡. An estimated ¥312 billion CNY is required (2014—2020) for the formation of biomass fuels (including plants, warehouse logistics, and heating equipment), for the production of ethanol and biodiesel, and for household biogas. The costs of producing biomass energy in China are higher than the use of fossil fuels. Greater use of biomass therefore requires accelerated research and development of supporting technology for the collection, transport, processing, and storage of biomass; higher prices for fossil fuels; and preferential policies such as tax exemption for biomass.
‡ http://www.forestry.gov.cn/main/72/content-608546.html
《3.5. Energy efficiency and conservation》
3.5. Energy efficiency and conservation
Policies encouraging energy efficiency are important for reducing global GHG emissions, and can provide climate change adaptation benefits by protecting inhabitants against temperature extremes and other extreme weather [2]. Energy-efficiency measures also provide a means of “saving energy in a hurry,” which can be vital to limiting power outages when natural disasters hit [40]. An important point is that energy efficiency can be of positive economic benefit to China [41].
In the IEA 450 Scenario for tackling climate change, energy-efficiency measures contribute half of the necessary global emissions savings relative to business-as-usual [18]. By analyzing the IEA’s efficient world scenario using the OECD’s ENV-linkages model, Château et al. [41] demonstrate the boosts to economic growth that accrue from energy-efficiency measures. They estimate that, with policies to aggressively improve energy efficiency, China’s GDP would be $60 billion USD higher in 2035, compared to the reference New Policies Scenario. Chinese government policies, market conditions, and opportunities for increased energy efficiency are discussed in the IEA’s energy efficiency market reports [42,43], with greatest potential being noted in the industrial sector.
From 2014 to 2020, China’s requirements for energy conservation are estimated to be between ¥800 billion CNY and ¥1350 billion CNY. This includes investments in over 200 energy-saving technologies described in the NDRC’s Key Energy-Saving and Low-Carbon Technology Promotion Catalogue††. Encouraging investment in energy conservation will require supportive polices such as discounts on loans, the reform of energy prices, tax policy, and funding for research and development. Management of energy efficiency and conservation can also be strengthened by higher standards, monitoring, and supervision.
†† http://hzs.ndrc.gov.cn/newzwxx/201401/t20140110_575400.html
《3.6. Water efficiency and conservation》
3.6. Water efficiency and conservation
Water is another resource for which conservation measures are essential, due to climate change. China is relatively short on water resources, with water availability per capita at approximately 28% of the world’s average [32]. Moreover, China has experienced both increased flooding and droughts in recent decades, as well as the retreat of glaciers and shrinkage of lakes [32]. In 2013, water consumption by agriculture was 3.92 × 10¹¹ t, with a further 7.29 × 10¹⁰ t consumed by industry (excluding cooling water for power plants). About 43% of China’s irrigated farmland uses water-efficient technology, with about 22% of the irrigated area having high-efficiency water conserving technology. Targets for increased water conservation are specified in several government plans including the Action Plan for Water Pollution Prevention and Control (issued in 2015), the National Agricultural Water Conservation Outline ( 2012 — 2020) (issued in 2012), and the National Agricultural Sustainable Development Plan ( 2015 — 2030)‡‡ .
‡‡ http://www.gov.cn/zwgk/2012-12/15/content_2291002.htm, http://www.moa.gov.cn/sjzz/jgs/cfc/yw/201505/t20150528_4620635.htm
To achieve China’s water conservation objectives, approximately ¥540 billion 870 billion CNY in funding is required between 2014 and 2020. This includes investments in the agricultural sector, to be paid from fiscal funds, with water-saving investments by industry accounting for the remaining. As with energy efficiency and conservation, the realization of such investments in the water sector requires a variety of supporting policies.
《3.7. Long-term renewables》
3.7. Long-term renewables
In principle, China has sufficient technically exploitable sources of renewable energy to provide for all of its needs. A study by Liu et al. [44] found that China could generate on the order of 13 000–39 000 TW·h·a−1 of electricity from renewables; 7000—31 000 PJ·a−1 of heat; and 16 000–28 000 PJ·a-1 of biomass fuels (Table 6). Exploiting this potential requires overcoming challenges of geographical distribution, intermittency of supply, and costs. Similar to its abundance of coal, the western part of China has the greatest abundance of renewable energy sources. Of China’s hydropower potential, 78% is in the west, while the 11 highly populated eastern and coastal provinces have only 6% of the total hydropower resources [44]. The highest wind densities are located in the north and west, although there is large offshore wind potential near to centers of demand in Jiangsu, Fujian, Shandong, and Guangdong Provinces. Solar radiation is abundant in China, averaging 4 kW·h·m−2·d−1; but again, the highest solar potentials of 9 kW·h·m−2·d−1 are in the western regions, including the deserts. China is already the world’s greatest user of hydroelectric and wind power, and generates 20% of its total primary energy supply from renewables and clean energy sources.
Looking beyond energy-related investments to 2020 (Sections 4.3 to 4.5), several studies have analyzed the potential for China to substantially increase the penetration of renewable energy sources in its long-term energy supply. Here, insights are drawn from studies by the International Renewable Energy Agency (IRENA) [4] and the Energy Research Institute (ERI) of the NDRC [39]. (Comparisons with other high renewable scenarios, including those by the China National Renewable Energy Center, Greenpeace, IEA, World Wildlife Fund, and Bloomberg New Energy Finance, are given on p. 71 of Ref. [4]).
《Table 6 》
Table 6
Potential of renewable energy sources in China. (Adapted from Table 4 in Ref. [44])

IRENA suggests that it is technically and economically feasible for the share of renewables in China’s total energy mix to rise to 26% by 2030, rather than to an expected 16% [4]. This would entail an increase of renewables in the power sector to 40% penetration, with higher growth in wind and solar photovoltaics (PV) relative to the reference case (Fig. 3). Achieving this higher penetration of renewables would require investments to increase by $54 billion—145 billion USD per year from 2014 to 2030. IRENA indicates that prices on the order of $25—30 USD per tonne CO2 would be required for wind and solar PV to compete with the cost of coal power generation at the utility scale.
The China 2050 High Renewable Energy Penetration Scenario and Roadmap Study [39] is part of a long-term vision and roadmap for a “beautiful China” with a clean environment, protected natural ecosystems, and a high quality of life. The vision entails vigorous development of renewable energy so that it supplies over 60% of energy consumption and over 85% of electricity supply by 2050. Striking aspects of the roadmap are that it envisages China’s use of coal to peak in 2020 and its primary energy demand to peak in 2025. (By comparison, IEA’s World Energy Outlook 2014 [37] expects China’s coal use to grow slowly before peaking around 2030.) China’s CO2 emissions would also peak in 2025 at 9.23 × 10⁹ t (presumably energy-related emissions only). In 2030, the use of coal in the ERI scenario is relatively similar to that in the IRENA scenario, but total power generation and the use of wind and solar PV are substantially higher than in the IRENA case (Fig. 3). (Investment under the ERI scenario would be about $180 billion USD per year based on scaling the IRENA estimates.) This difference is due to the strong emphasis on electrification in the ERI vision. Electricity is noted to be a driver of information technology and communication technology and is seen as an “advancement of the human civilization.” Electricity use is expected to rise to 15 000 TW·h by 2050 (Fig. 3). With the high penetration of renewables and with increases in energy efficiency of 90%, the proportion of coal in China’s 2050 power generation is envisaged to drop from 75% to 7%.
Central to the China 2050 High Renewable Energy Penetration Scenario and Roadmap Study are deployments of wind and solar power that will provide 64% of total power generation in 2050. Installations of wind power are envisaged to be about 25—30 GW·a−1, reaching a total capacity of 250 GW in 2020, by which time wind power will be competitive with coal power (Fig. 17 in Ref. [39]). New installations of wind power will then be added at about 80 GW·a−1, to reach a capacity of 2400 GW by 2050. The PV market is expected to grow by 35% per year until 2020 and then at 25% 30% from 2020 to 2030. Solar PV is expected to become more economically competitive after 2030 [39], with installed capacity reaching 2700 GW by 2050 under this scenario.
Implementation of the China 2050 High Renewable Energy Penetration Scenario and Roadmap Study [39] will require investments in the electrical transmission system and in institutional innovation. Increased interconnection of regional grids is required in order to transfer power from the north and west to high-demand centers in the east, increase system flexibility, and balance loads. Three cross-regional transmission lines with capacity in excess of 100 GW would be an initial requirement. Further long-distance transmission capacity may be required in the future, with issues of siting, cost allocation, and coordination among authorities to be resolved [39]. (China’s existing electrical transmission and distribution system is briefly described in Ref. [4].) Energy storage capacity needs to be developed in order to exploit excess generation during periods of low demand. To achieve the necessary system flexibility for renewable generation, China will need to develop new operating procedures, business models, and market rules, as well as improvements to technology [39].
If China pursues radically increased investments in renewable power generation, there is potential for it to realize substantial, but as yet undetermined, savings from avoided costs of freight rail infrastructure (as well as of ports and water infrastructure, health costs, and pollution-control costs), as discussed further below.
《4. Freight rail infrastructure》
4. Freight rail infrastructure
To better understand changes to China’s economy under its green transformation and to unlock large potential sources of finance by avoiding investment in unnecessary infrastructure capacity, it is necessary to undertake a fuller examination of all of China’s infrastructure sectors, beyond those considered in Table 1. A green transformation involves more than just large investments in green infrastructure, it also entails not investing in other infrastructure that underpins the environmentally damaging status quo. As previously shown in Fig. 1, there are physical and economic interactions between infrastructure sectors that will help to achieve China’s goal of peaking in GHG emissions and primary energy consumption by 2025 [39]. To further demonstrate just one of these infrastructure interactions, the freight rail sector and its relation to coal-fired power generation can be considered.
China has ambitious plans to expand rail infrastructure, much of which is for the transportation of coal and thus has potential impacts on the costs of power production. In 2013, the rail system carried 2.106 billion passengers and 3.967 × 10⁹ t of freight, of which 58% was transport of coal. That year, ¥650 billion CNY ($105.9 billion USD) was raised for rail investments, of which ¥520 billion CNY was required for 5200 km of new lines [45]. As of 2014, China had 112 000 km of rail lines, and by the end of 2015, there should be 120 000 km of rail lines, including 16 000 km of high-speed rail†. Approximately 23 000 km of lines will be built in the next five years, under the 13th Five-Year Plan. Most of them will be for passengers, although old lines running parallel to new high-speed passenger lines are sometimes dedicated to freight [23]. The long-term plan is to expand the rail network to 280 000 km by 2050 [45]; this includes both high-speed passenger rail and new freight rail infrastructure.
† Personal communication with Professor Xiaoqiang Zhang, Southwest Jiaotong University.
If China continues to increase its use of coal, substantial rail infrastructure would need to be built to overcome the geographical mismatch between resource locations and demand centers [46]. Most of the coal reserves are in the north and north-west parts of China, while highly populated coastal regions such as Shandong, Jiangsu, Hebei, Guangdong, and Zhejiang Provinces have insufficient local supplies. As of 2008, over 80% of China’s recoverable coal deposits were in the Inner Mongolia Autonomous Region, the Xinjiang Uygur Autonomous Region, Shanxi, Shaanxi, and Guizhou Provinces. Mou and Li [46] note that production of coal in some of the traditional supply regions in central China such as Henan and Shanxi Provinces has already peaked. An increasing amount of coal is being supplied from the Inner Mongolia Autonomous Region in the north, while in the mid to long run, coal might have to come a long distance from the Xinjiang Uygur Autonomous Region in the very far west of China. Most freight rail lines in China are already at capacity and some coal must already be moved by road, which is more expensive. There are alternatives to rail: Greater quantities of coal might be shipped along internal rivers, and China can also import coal from abroad. Both cases may require investment in port infrastructure. Nevertheless, some of the coal-rich provinces have no water access, and it is clear that China would need to build more railways if it continues to predominantly rely on coal-based energy.
The costs of building or enhancing freight rail infrastructure could potentially impact the cost of future coal power generation in China, depending on the outcomes of recent market reforms. Review of the history of coal-fired generation in the US shows that the total costs of coal-fired power are dominated by fuel costs and capital costs, with operation and maintenance only accounting for 5%—15% of costs [47]. Over the past century, the cost of the fuel input, that is, the cost of coal at the plant, has generally been between 50% and 65% of the total generating cost (Fig. 11 in Ref. [47]). During the first half of the 20th century, the cost of transporting coal to power plants was on par with the price of coal at the mine. Since 1940, transportation costs have fallen to between 20% and 40% of the delivered cost of coal. Rail freight rates in the US declined significantly in the 1980s following deregulation and this lowered the cost of coal [47]. The opposite is occurring in China: Rail freight rates were frozen for 30 years before rising by 1.5 cents per tonne-km in 2012 [45]; rail freight rates have since risen again, reaching an average of 15.51 cents per tonne-km in February 2015. A study by Rutkowski [48] noted, however, that rail freight rates were still substantially subsidized and that “In order to reach a return on assets closer to the average for industrial state-owned enterprises, average freight rates would need to increase by another 38 percent on top of the February (2013) increase.” A preliminary calculation suggests that a 38% increase in rail freight rates would cause the average cost of coal-powered electricity to increase by at least ¥12 CNY·(MW·h)−1[49]†. Based on ERI’s levelized costs, all else being unchanged, this would mean that wind power is more cost effective than coal power in China today‡. Further study of the potential impact of rail freight rates on the cost of coal-powered generation versus generation from renewables is warranted.
† The calculation assumes an average efficiency of China’s coal-fired power of 325 gce·(kW·h)–1 (adapted from Ref. [49], which gives the raw amount of coal required per kW·h generated) and an average distance traveled by each tonne of coal of 735 km (based on 2917.4 billion tonne-km per 3.967 billion tonnes of freight in 2013).
‡ Note: This is a preliminary assessment without full information; rising rail costs may have already been used to determine the expected increases in coal-powered electricity.
To further demonstrate the resource allocation issue at hand, the amount of iron ore required to build an estimated 2000 km of dedicated freight rail lines in the 13th Five-Year Plan is approximately equivalent to the iron ore required to construct 2000 GW of onshore wind turbines, which is close to the envisaged wind power requirement for 2050, according to ERI [39,50]††.
†† This calculation assumes that 200 tonnes of iron ore are required per kilometer of rail track (based on Ref. [9], assuming 2 tonnes of iron per 1 tonne steel); and that 0.5 MW of on-shore wind capacity can be produced per tonne of iron ore (based on Ref. [50]).
《5. Industrial pollution and environmental remediation》
5. Industrial pollution and environmental remediation
China’s transformation to an ecologically based civilization requires large investments to reduce industrial pollution and to clean up a legacy of environmental contamination of soil and groundwater. Estimates of the required green financing are given here for the treatment or recycling of waste gases, solid waste, and wastewater from industry. Notably, though, over 40% of the pollution treatment costs (for 2014 2020) are from air and solid waste emissions associated with coal combustion. Thus, long-term transformation of China’s power sector away from coal combustion will have the added financial benefit of avoided treatment costs associated with coal pollution.
《5.1. Industrial waste gas treatment》
5.1. Industrial waste gas treatment
China’s emissions of industrial waste gases are largely due to the combustion of coal. In 2013, industry used 3 × 10⁹ t coal, which is 87.3% of the total national coal combustion (3.47 × 10⁹ t·a−1). Four sectors, which are power generation, cement, steel and iron, and chemicals, account for 86% of industrial coal use. The combustion of coal by industry produced 6.32 × 10⁷ t SO2, of which 1.835 × 10⁷ t was emitted as air pollution. The General Office of the State Council has issued the Energy Development Strategic Action Plan ( 2014 — 2020)‡‡ and suggested that growth in coal combustion be capped at 4.2 × 10⁹ t·a−1 by 2020.
‡‡ http://www.gov.cn/zhengce/content/2014-11/19/content_9222.htm
The Atmospheric Pollution Prevention and Control Plan††† calls for increased investment in desulfurization, denitrification, and dust removal (i.e., particulate emission control) from Chinese industry. Under the scenario of fixed coal consumption, the treatment of industrial waste gas is expected to be between ¥780 billion CNY and ¥1830 billion CNY (2014—2020), depending on the emissions standard reached. Beyond energy policy on the use of coal, implementation of the Atmospheric Pollution Prevention and Control Plan will require further actions. Emission standards for key industries need to be established or revised and better enforced in all cases. Strategies for monitoring, supervising, and managing emissions need to be developed such as the use of emissions permits.
††† http://www.gov.cn/zwgk/2013-09/12/content_2486773.htm
《5.2. Industrial solid waste disposal》
5.2. Industrial solid waste disposal
In 2013, China’s domestic production of general industrial waste was 3.28 × 10⁹ t, with five categories (tailings, coal ash, coal gangue, smelting waste, and furnace slag) accounting for about 80% of the total. The average comprehensive utilization rate (i.e., recycling rate) was 62% in 2013, but it varies between categories. Recycling of smelting waste (91.8%), furnace slag (89.9%), and coal ash (86.2%) exceeded the target of 72% prescribed in the Industrial Transformation and Upgrading Plan ( 2011 — 2015)†. Recycling of coal gangue (71.1%) and tailings (30.7%) were below the target.
† http://www.gov.cn/xxgk/pub/govpublic/mrlm/201201/t20120119_64732.html
An estimated capital investment of ¥13 billion 960 billion CNY is required for industrial solid waste recycling for 2014-2020. The upper estimate assumes that a 100% recycling rate is achieved for newly generated solid wastes, requiring an investment of ¥164 billion CNY. Moreover, necessary investments in the further disposal of existing industrial solid waste will amount to ¥796 billion CNY, according to the new stricter standards. Policies need to be established to increase the utilization of solid waste; national standards are required for key industries, along with a variety of supporting policies such as the use of market mechanisms, the protection of intellectual property, government guidance, demonstration projects, tax incentives, and environmental labeling.
Further advances in waste management practices in China, with increased recycling, can be expected following the Circular Economy Development Strategy and Action Plan‡ that was issued by the State Council on January 2013 (chaired by the NDRC).
‡ http://www.gov.cn/zwgk/2013-02/05/content_2327562.htm
《5.3. Industrial wastewater》
5.3. Industrial wastewater
Following the Action Plan for Water Pollution Prevention and Control††, a further investment of ¥330 billion—1180 billion CNY is required for treating industrial wastewater between 2014 and 2020. This may have to be financed by raising resource and emission fees, with future costs being determined by strong emissions standards and enforcement.
†† http://www.gov.cn/zhengce/content/2015-04/16/content_9613.htm
《5.4. Environmental remediation》
5.4. Environmental remediation
Investment in the environmental remediation of historically contaminated soil and groundwater in China adds to the ongoing costs of industrial air pollution, waste, and wastewater cleanup noted above. Soil pollution levels in China were investigated in April 2005 and again in December 2013, revealing widespread contamination of industrial and commercial sites, as well as of agricultural lands. A further communique from the Ministry of Land and Resources of China in 2014‡‡ revealed that groundwater contamination was “bad” or “very bad” at over 50% of the monitoring stations in prefecture-level cities. The number of industrial brownfield sites in China’s cities is at least 300 000, with an estimated remediation cost of ¥150 billion—450 billion CNY from 2014 to 2020. A further amount of approximately ¥14 billion 313 billion CNY is needed to remediate approximately 3.3 × 10¹⁰ m2 farmland that is polluted with heavy metals and other contaminants. The costs of cleaning up an estimated 1.8 × 10⁹ m3 of polluted groundwater are on the order of ¥24 billion—167 billion CNY.
‡‡ http://www.zhb.gov.cn/gkml/hbb/qt/201404/t20140417_270670.htm
The environmental remediation industry in China is still in its infancy. PPPs may be used as a model for financing environmental restoration in some cases. The private sector may make financial returns on remediating contaminated land located in cities, when it is of high value for new building construction.
《6. Conclusions: Challenges for the engineering profession》
6. Conclusions: Challenges for the engineering profession
This integrated view of the infrastructure requirements for China’s ecologically balanced civilization can be concluded with key challenges for the engineering profession:
(1) China’s future as an ecologically balanced civilization rests on the implementation of a central infrastructure policy: the China 2050 High Renewable Energy Penetration Scenario and Roadmap Study. The vision described by the ERI [39] entails over 60% of energy consumption and over 85% of electricity supply coming from renewable sources by 2050. Engineers have a key role in developing high-capacity long-distance transmission lines, energy storage capacity, and new system operating procedures. The Medium- and Long-Term Development Plan for Renewable Energy will not only reduce GHG emissions but also support China’s circular economy through dematerialization, substantially reducing the production of gaseous and solid industrial wastes.
(2) Under China’s green transformation, there may be large savings in other infrastructure sectors such as railways, ports, refineries, and water infrastructure that have not yet been fully assessed. In particular, there is a critical need to re-examine the Medium- and Long-Term Railway Network Plan in the context of substantial reductions (~75%) in coal transport under the China 2050 High Renewable Energy Penetration Scenario and Roadmap Study [39].
(3) Engineers need to adapt their skill sets for the implementation of the National New-Type Urbanization Plan ( 2014 — 2020) to provide high quality of life with environmental protection. This new form of urbanization requires substantial investment in urban infrastructure, including water supply, wastewater treatment, solid waste facilities, commercial and residential buildings, and urban transit. Urban and land-use planning will also shape China’s need for green infrastructure and finance. For example, urban land-use planning can deliver water basin management and related ecosystem services that in turn limit investment in costly infrastructure to supply clean water to a rapidly growing urban population. Other cost savings are available if resource-efficient land use and urban-rural linkages are integrated with infrastructure planning (e.g., from public transport solutions to flood buffering in coastal zones).
(4) China has implemented many successful policies in the building sector in recent years, but there is still considerable scope for improvement in the energy efficiency of Chinese buildings. A comparison of building envelopes shows that China’s building codes are much less stringent than those of many Western countries, regions, and cities, especially those with colder climates. Chinese engineers and building scientists need to further the development of net-zero green buildings.
(5) An essential part of China’s green industrial transformation involves engineering systems that conserve materials, thereby reducing or even eliminating wastes. An industrial ecology perspective or metabolic view of the economy [51] such as the perspective underlying Fig. 1, is necessary for sustainable growth. This perspective is exemplified by the Circular Economy Development Strategy and Action Plan††† . Under this plan, China is implementing 10 types of demonstration projects, situated in 100 demonstration cities (or counties) and 1000 circular economy demonstration park enterprises. The demonstration projects include comprehensive resource recycling, industrial park loop transformation, renewable resource recycling, urban mining, remanufacturing, kitchen waste recycling, production wastes co-processing, agricultural wastes demonstration projects, service industry demonstration projects, and resource recycling technology promotion. Through such demonstration projects, China has begun to build the capacity, skills, and knowledge required to carry forward investment in circular economy development, which will in turn help to reduce the costs of new waste management infrastructure.
††† Personal communication, Dr. Lei Shi, Associate Professor, School of Environment, Tsinghua University.
(6) The volumes of contaminated soil and groundwater in China are about an order of magnitude greater than those treated in US Superfund sites. The environmental remediation industry in China is still in its infancy, and will need to develop its capacity in order to ensure that the private sector can play a role in delivering China’s green transformation.
《Compliance with ethics guidelines》
Compliance with ethics guidelines
Chris Kennedy, Ma Zhong, and Jan Corfee-Morlot declare that they have no conflict of interest or financial conflicts to disclose.


 京公网安备 11010502051620号


