


1. Introduction
Along with the development of its transportation infrastructure, China is experiencing increasing and vigorous planning and construction of underground works such as mountain tunnels and urban metro lines, which have greatly improved traffic efficiency. However, the construction of underground works in deep underground spaces with complicated strata results in numerous challenges that include large deformation, collapse, rock-burst, gushing water, and gushing mud. Of these, the large deformation hazard of long tunnels is the most salient risk. Such tunnels (including Tauern Road Tunnel and Arlberg Road Tunnel in Austria [1], Mount Bolu Tunnel in Turkey [2], and Wushao Mountain Tunnel [3] and Longxi Tunnel [4] in China) are threatened by large-deformation hazards of the surrounding rock during construction. Based on different geological features and conditions, Meng et al. [5] have divided the occurrence mechanisms of large-deformation surrounding rock into three categories: plastic flow, shear slip, and bending failure of equally stratified sedimentary rock. Large deformation of tunnels is primarily caused by crushing stress [6,7] and swelling stress [8]. Appropriate analytical methods, supporting measures, construction schemes, and equipment are essential for the stability con trol of the surrounding rock [9]. The New Austrian Tunneling Method (NATM) has been widely used as an efficient construction method. Its essence lies in real-time field monitoring, timely information feedback of construction information, and dynamic adjustment to the construction scheme, all of which are important means of ensuring safe tunnel construction. The non-determinacy and discreteness of the mass data that are acquired during the course of construction pose great technical challenges to the selection of a construction scheme and to the accurate prediction of sudden accidents and hazardous conditions.
Both NATM and the modern intelligent tunneling method face two major technical challenges: The first challenge is the need to establish a rapid and efficient method to acquire, manage, and analyze the ever-increasing quantity of mass data obtained during construction; the second challenge is the need to establish intrinsic links between tunnel construction data under different conditions. Based on this data association, mass data as a service (DaaS) can provide a data-enquiry service and references for similar projects in a rapid and efficient manner.
In order to solve the problem described above, this paper presents a novel framework technology of a data service system using data-association technology and the NATM, with the support of a big data environment. This data service system can integrate mass multi-source heterogeneous data that is acquired from construction, establish intrinsic data associations in a data-evaluation model, and store these associations in a data pool. With the continued development and supplementation of this data pool, the data service system can also provide data services and technical guidance for similar projects, including the optimization of construction schemes and the effective integration of construction resources.
《2. NATM construction》
2. NATM construction
Rabcewicz [10] proposed the NATM in 1964; Brown [11] and Romero [12] detailed the concept of NATM; and Kovári [13] and Karaku,s and Fowell [14] first presented this method and its definition and conducted relevant research. During NATM construction, underground-chamber excavation and the erection of supporting structures involve complex processes that are key to ensuring construction and structure safety. The selection of an excavation method and support parameters depends on the data acquired from construction in terms of the geology beyond the tunnel face, deformation of the surrounding rock, and stress–strain in supporting structures. In terms of engineering, accurate measurement of the convergence of the surrounding rock and the stress–strain of supporting structures are essential to the stability of the surrounding rock. Higher monitoring frequency is required when the deformation of the surrounding rock and the level of crustal stress exceed the safety margin. Measures to reinforce support or adjust the construction scheme must be taken in the excavation-affected area in order to prevent stability failure of supporting structures, which would otherwise lead to grave accidents. NATM incorporates many existing tunnel-excavation and support methods. However, one of the essential parts of this method is timely monitoring of the convergence trend of the surrounding rock and the stress– strain of supporting structures in order to enable dynamic adjustment to the construction scheme, thereby ensuring that the project construction proceeds safely and smoothly. As a result of its relatively high degree of safety, NATM is widely used.
《3. A data service system for NATM construction》
3. A data service system for NATM construction
To address the technical challenge of tunnel construction involving mass multi-source heterogeneous data, this paper presents a data service system for the integration, interconnection, and retrieval of construction data in order to provide a dataenquiry service for similar projects. The system consists of three parts: the acquisition of mass multi-source heterogeneous data from tunnel construction; a Gaussian process (GP)-based dataevaluation model (GP model); and information feedback and storage. A detailed description of these three parts and a general description of the system’s process flow are set out below, with the construction of the large-deformation section of Jinpingyan Tunnel on the Chengdu–Lanzhou Railway, which is under construction, being used as an example.
《3.1 Data acquisition from tunnel construction》
3.1 Data acquisition from tunnel construction
3.1.1. Tunnel seismic prediction-based advance geological prediction information
Tunnel seismic prediction (TSP), also known as ahead or advance geological prediction, uses the principle of seismic wave investigation to realize geological forecasting. The generated seismic waves propagate through the surrounding rock in the form of spherical waves; when the wave impedance varies, some seismic waves are reflected back while others continue to propagate forward. The reflected elastic waves are processed in order to obtain the velocity of longitudinal waves through the surrounding rock beyond the tunnel face, VP. Other parameters such as Poisson’s ratio and Young’s modulus can be obtained from the empirical formula and conversion of VP. At the same time, the included angle h of the main structural face of the tunnel and its axis, the fissure development state, and the groundwater storage can be determined by two-dimensional (2D) geological profiles, depth migration, and reflector analysis [15,16]. In addition, in order to better match the machine-learning algorithm in the GP, the qualitative description mentioned in Refs. [17,18] must be quantified.
The fault and fracture zone can be assessed according to the following criteria:
- There is a reduced velocity of longitudinal waves and a reduced velocity ratio of longitudinal to transverse waves VP/VS; and The depth-migration image shows a violent negative reflection and ends with a violent positive reflection, with a number of positive or negative reflectors in the reflection area [19]. In addition, water-rich geological structures can be determined by the following phenomena [20]:
- The 2D strata reflection shows a reduced velocity of the transverse waves VS, increased velocity of the longitudinal waves, a sharp increase in the velocity ratio of longitudinal to transverse waves and in Poisson’s ratio, and a sharp decrease in the density and in Young’s modulus; and
- Obvious negative reflectors are present, with no visible positive or negative reflectors thereafter.
3.1.2. Information on supporting structures and surrounding rock behavior
It is essential to dynamically adjust the construction scheme and support parameters during the construction of tunnels and underground works, based on monitoring and analyzing the following factors: the convergence and deformation of the surrounding rock; the deep displacement of the surrounding rock; the contact pressure between the surrounding rock and the primary support; the internal force in the arch centering; the axial force of rock bolts; the contact pressure between the primary support and the secondary lining; and the strain in the secondary lining. This is done while assessing and analyzing the safety and stability of the supporting structures for the tunnel, especially during the construction of tunnel and other underground works within complex and special strata. On the basis of NATM construction, the real-time monitoring and dynamic feedback and storage of advance geological prediction data, the stress–strain data of supporting structures, and the deformation data of the surrounding rock provide the decision basis for the selection of a construction scheme and the optimization of support parameters.
3.2. A GP model
A GP is a random process, and the distribution of any finite set of its variables is a Gaussian distribution; thus, it represents a first-class supervised learning method in many applications. GP statistical characteristics depend on the mean function m(x) and the covariance function k(x,x") alone, as defined below:

where x and x' are the input vector pairs.
The GP mean function is generally considered to be zero [21]. A GP model is a nonparametric model that obeys the Bayesian distribution. Based on the learning of the training sample, the GP can lead to an optimal hyper-parameter of the covariance function by the maximum likelihood method, using a generic radial basis function as its core function:

where l is the characteristic scale and σ2 is the noise variance. The two free parameters (l and σ2) are hyper-parameters of the GP model.
Assume that there is a training set for n observed data D = {(xi; yi )∣i =1,...,n } , in which xi∈ Rd is the d-dimensional input vector and y is the classification mark +1/ -1. The input data matrix d×n is set as X; the forecast is carried out through the input sample x' provided by the GP model. After the continuous production of observed values by GP binary classification, the posterior distribution of the potential function f is obtained based on the Bayesian rule [21]:

where P(f∣X, y) = P(y∣f )P(f X) /P(y∣X) is the posterior distribution of the potential function f(x) and P( f'∣X; x' ; f ) is the prior distribution of the corresponding potential function, with a variable distribu tion range of (-∞, +∞) . Therefore, the probability forecast is as follows:

where s can be any sigmoid function whose role is to convert the range-constrained f(x) into a function value in the range of [0, 1], so as to ensure that the probability value falls into the range of [0, 1].
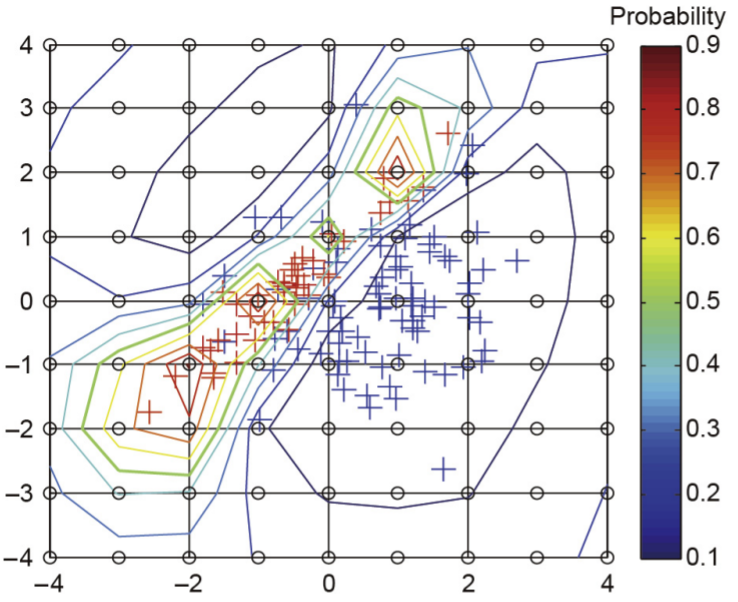
For multi-classification problems, a class can be regarded as a separate one that is distinguishable from the other classes; this class and other classes can then be divided by a binary classifier, as shown in Fig. 1.
《Fig.1》
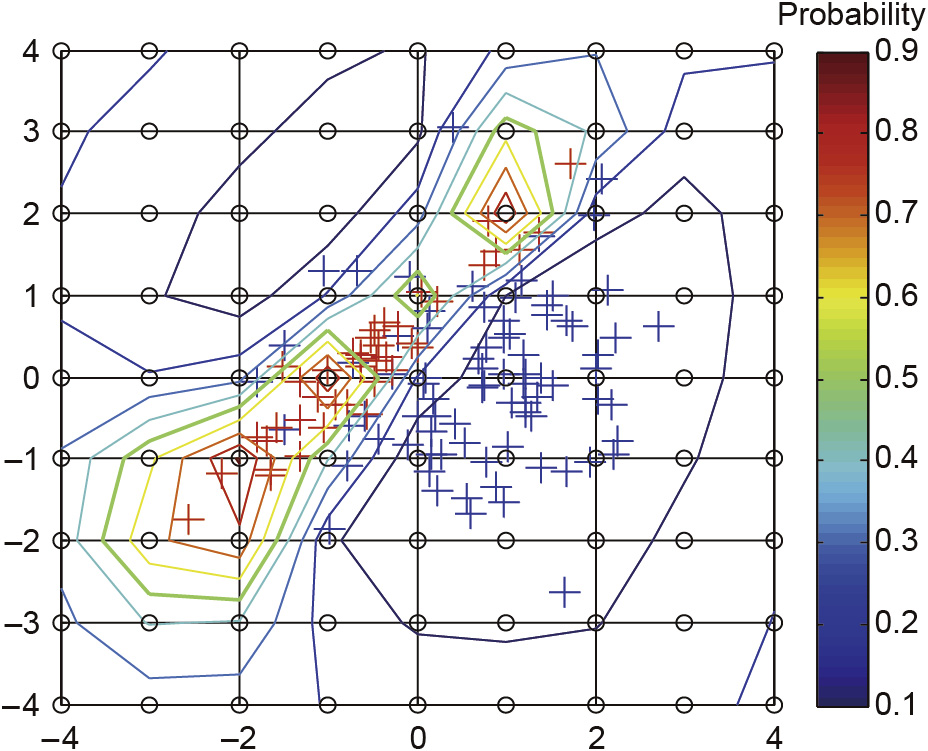
Fig. 1. Sketch map of the evaluation by the GP model.
In the GP model, the data from the excavation sections serve as training data to establish intrinsic associations among the data and to allow the evaluation and forecasting of data to be carried out for the section to be excavated. Based on the data that are revealed during actual excavation, the model parameters are continuously corrected so as to provide data support for the dynamic adjustment of the construction scheme and the optimization of support parameters for the section to be excavated.
3.3. Information feedback and storage
To facilitate the management and analysis of mass data from tunnel construction, valid data from field-monitoring components and detection equipment are stored on a big data cloud platform. Firstly, in order to realize storage of mass data on a cloud platform, we put forward the concept of the Internet of Data (IoD) here, on the basis of DaaS, which includes both a data-source service and a data-conversion module service. These services are stored in an ontological semantic network in the form of ontology in order to better meet the requirements of data users. Secondly, a data service system that is applicable to intelligent tunnel construction is established in order to send the required enquiry data to the DaaS system through user-terminal storage states and network broadband services. Lastly, the data service system sends enquiry commands to the data terminal and dispatches the required results to the data user. The IoD service flow is shown in Fig. 2.
《Fig.2》
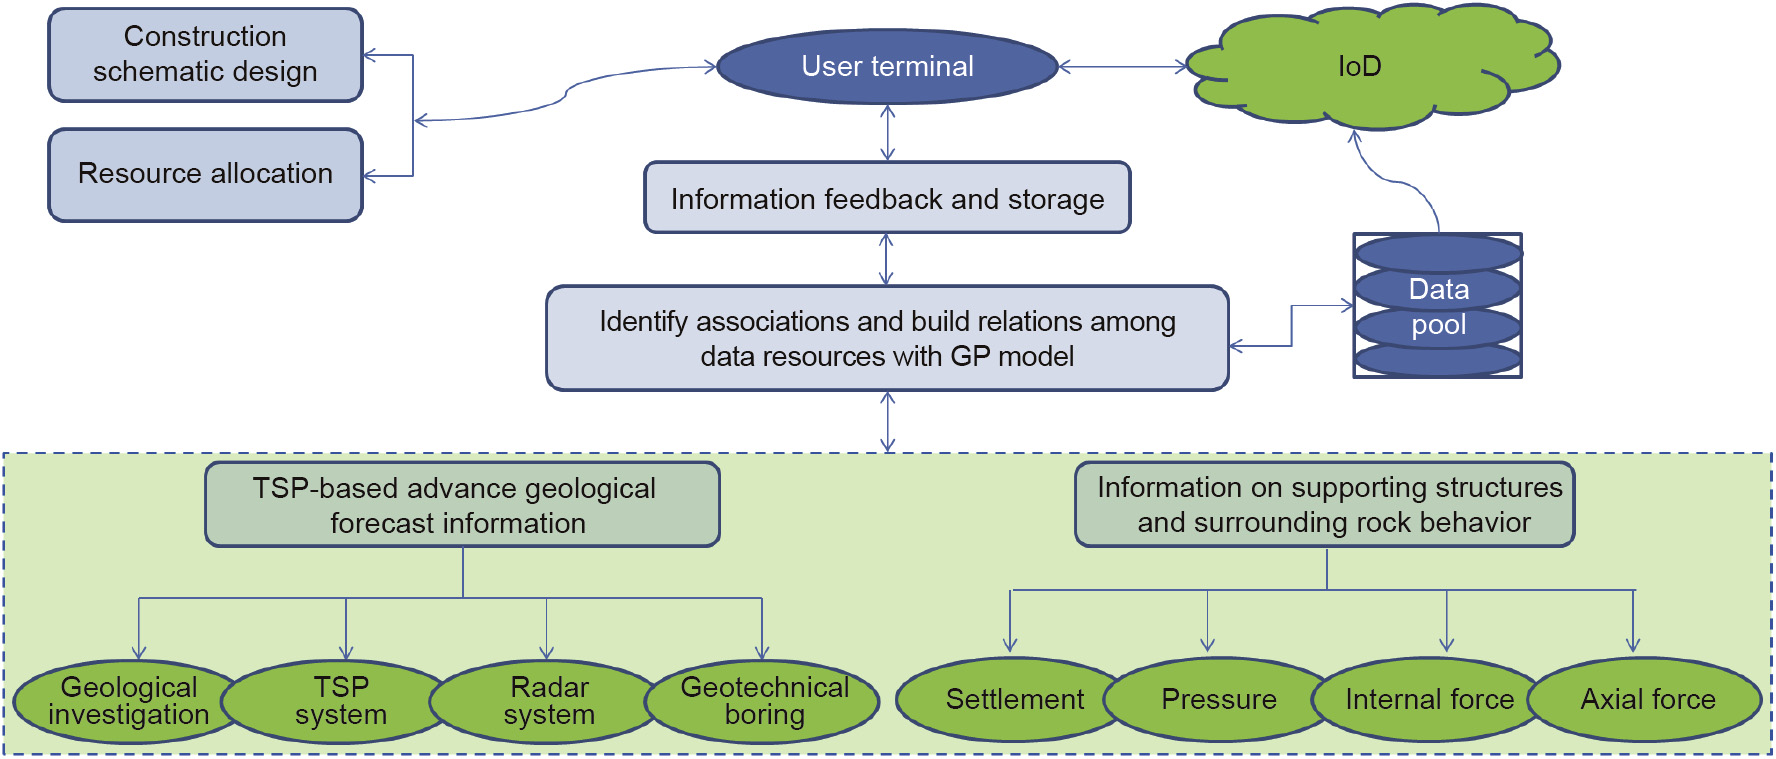
Fig. 2. An overview of the IoD service.
《4. Case study》4. Case study
《4.1 Project background》4.1 Project background
Jinpingyan Tunnel on the Chengdu–Lanzhou Railway is located in Songpan County, the Aba Tibetan and Qiang Autonomous Prefecture, Sichuan Province. The tunnel passes through the Wenchuan earthquake zone, which is largely a mountainous area [22]. Wenchuan earthquakes differ from Tangshan earthquakes and other catastrophic earthquakes; under the effect of the Wenchuan earthquake zone, the rock mass in the tunnel site area had undergone repeated rub and damage by strong earthquakes and aftershock, which further worsened the physical-mechanical properties of the rock mass [23,24]. Jinpingyan Tunnel has a total length of 12 773 m, with a maximum burial depth of about 791 m, and is located in an area composed mainly of Upper Triassic Zhuwo Formation carbonaceous phyllite with localized phyllite. The carbonaceous phyllite is gray, blackish gray, soft, and strongly weathered; it softens upon contact with water, and has developed joints and fissures. Deformation of the surrounding rock is characterized by typical rheological properties; some construction-revealed sections have suffered from large-deformation accidents such as large-area cracking in the shotcrete layer, chipping, collapse, distortion of the steel frame for the primary support, and secondary lining cracking, as well as grave clearance infringement by the supporting structure, as shown in Fig. 3 [25]. These accidents pose a great challenge to tunnel construction safety and to the subsequent operation of the railway. A typical section of Jinpingyan Tunnel has a span and width of 13.7 m and 11.5 m, respectively. The tunnel is being constructed by the three-bench method, which includes upper bench excavation, upper bench support, middle and lower bench excavation, and support for the side wall and invert. As shown in Fig. 4, the supporting structure consists of primary support and secondary lining.
《Fig.3》
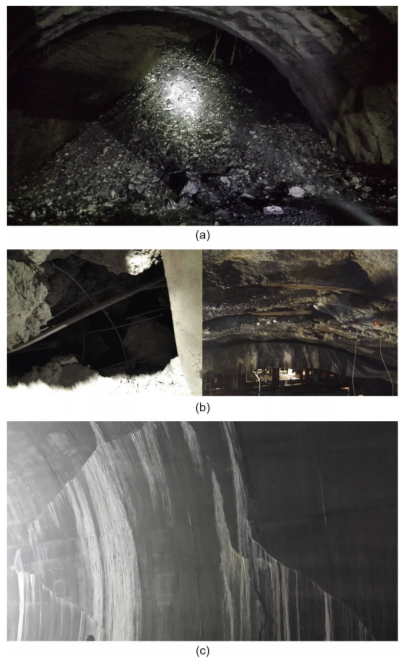
Fig. 3. Photographs showing damage from large deformation [25]. (a) Collapse of right spandrel; (b) shotcrete cracking; (c) secondary lining cracking.
《Fig.4》
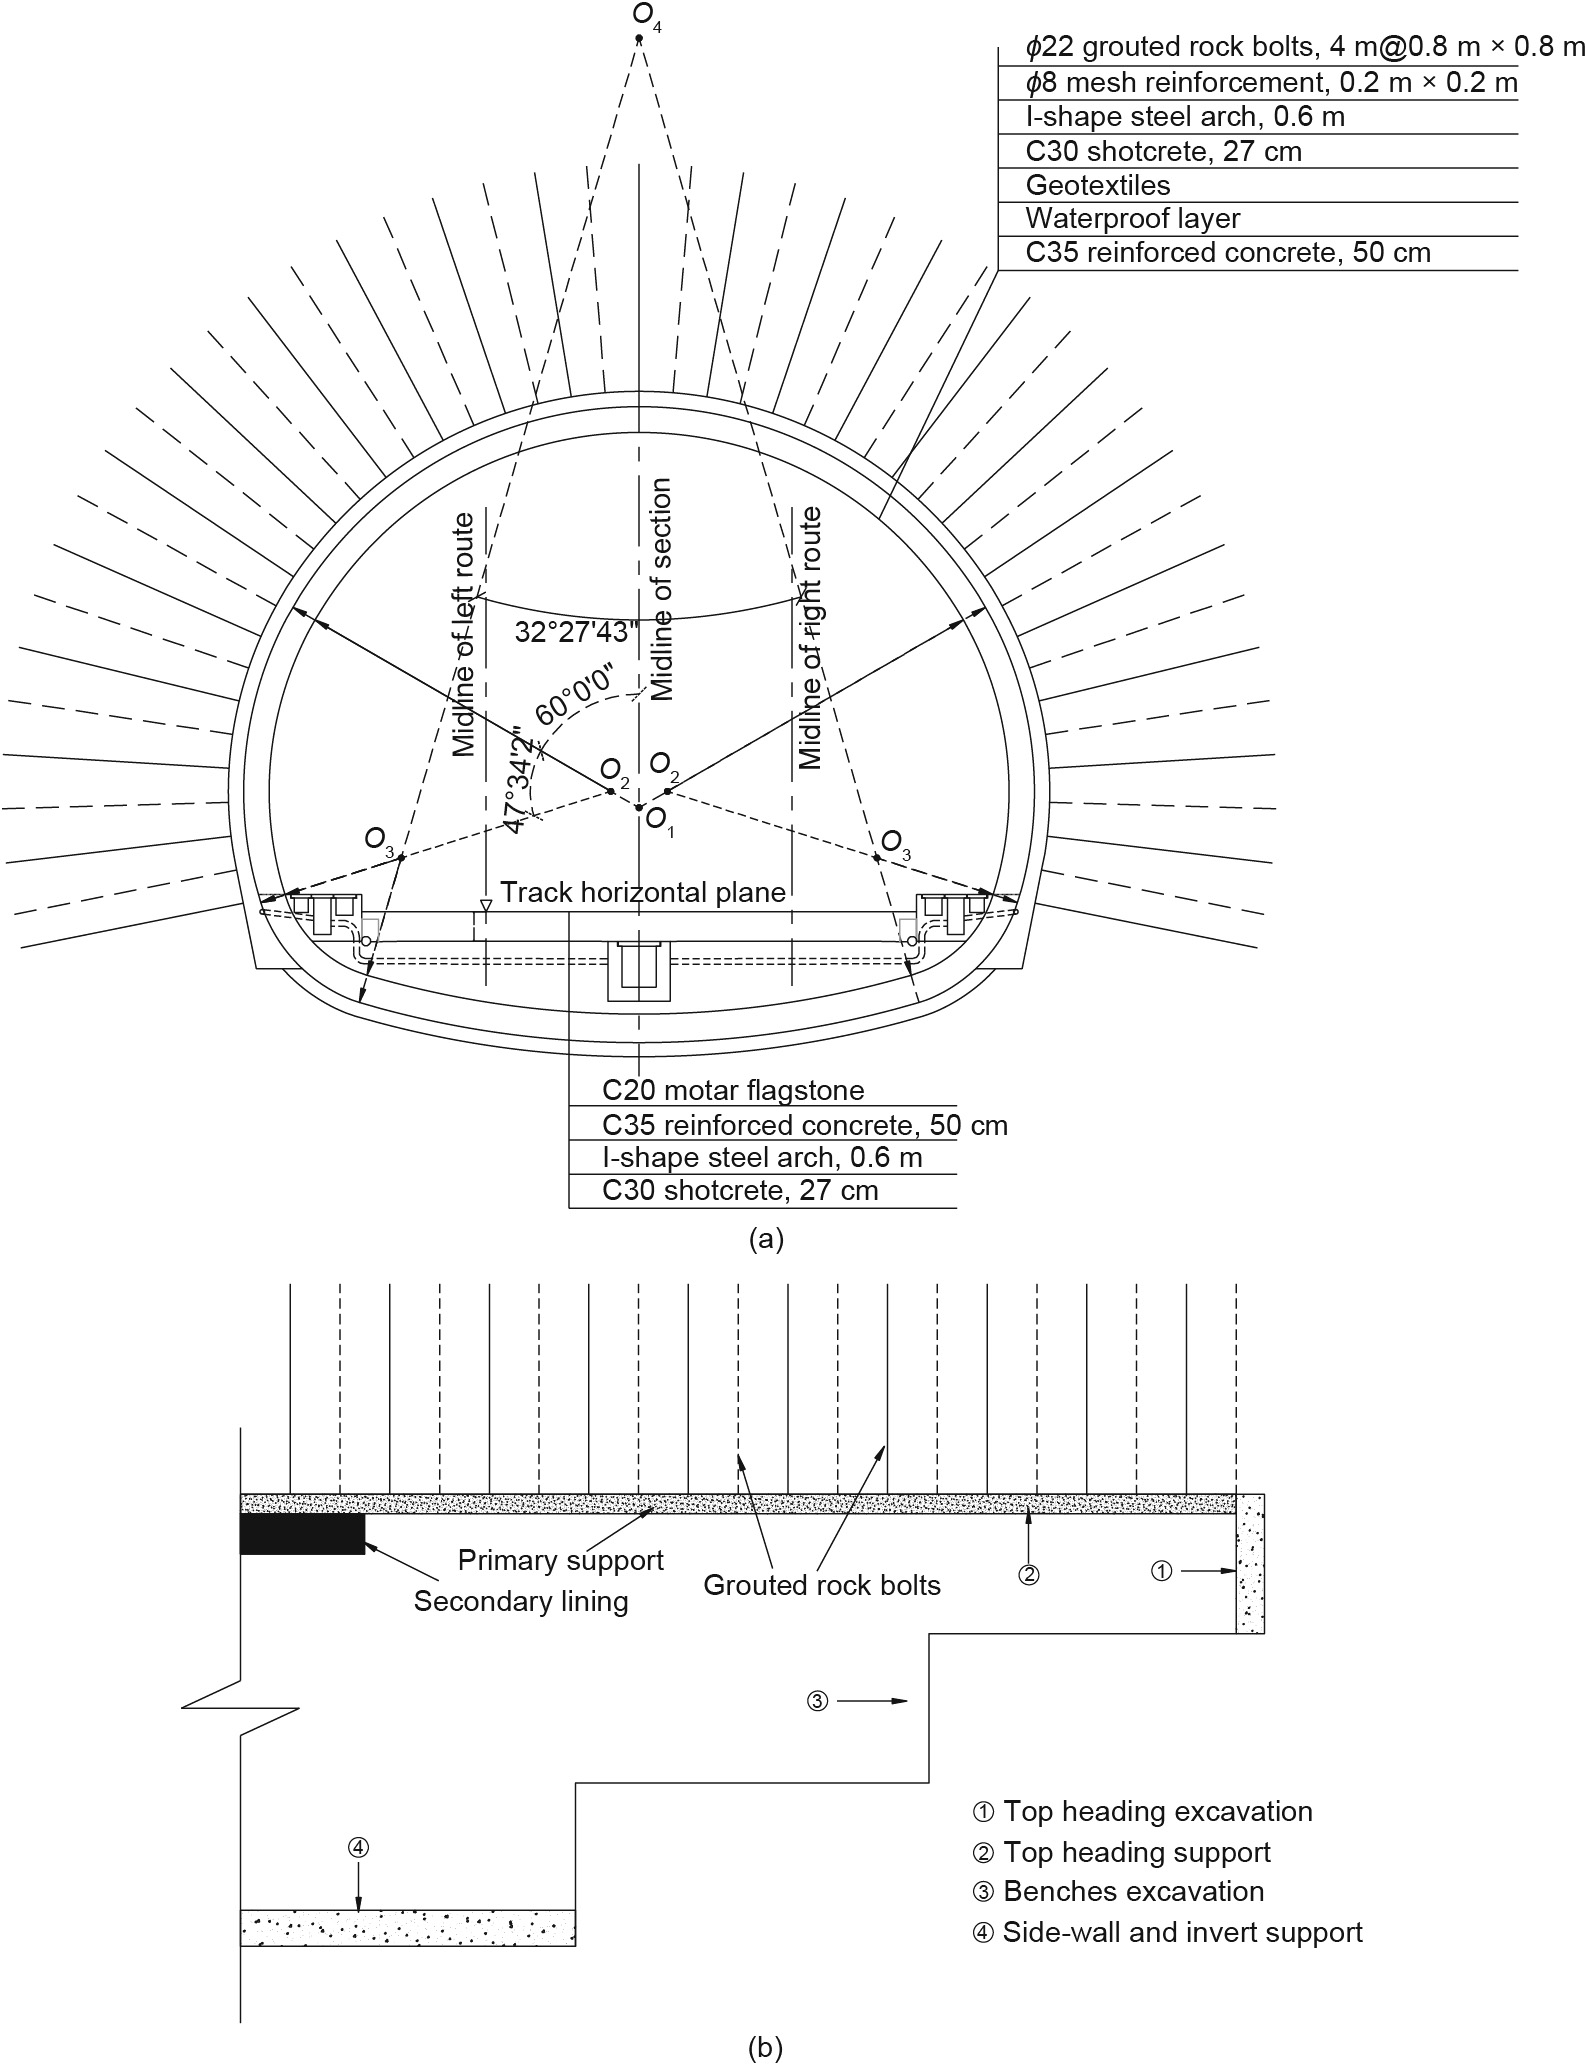
Fig. 4. Schematic diagram of (a) design support parameters; (b) construction procedures [25].
《4.2 Results of TSP》4.2 Results of TSP
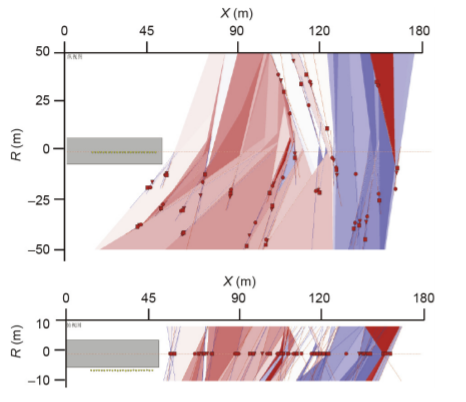
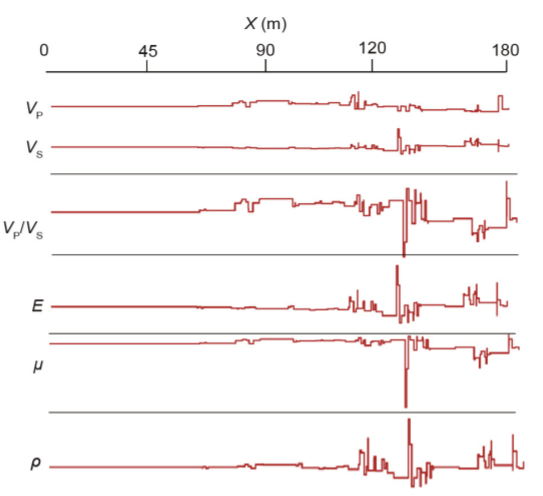
Diagrams of longitudinaland transverse-wave depth migration and reflector extraction can be obtained from TSPwin PLUS software, as shown in Fig. 5. 2D images of the prediction results can be directly interpreted based on Fig. 6. Considering the distribution ranges of the longitudinal and transverse waves, Poisson's ratio, and Young’s modulus, the surrounding rock in the prediction area is divided into several sections (as shown in Fig. 7) and quantified [17], in order to obtain all input data including training and test samples, as shown in Table 1.
《Fig.5》
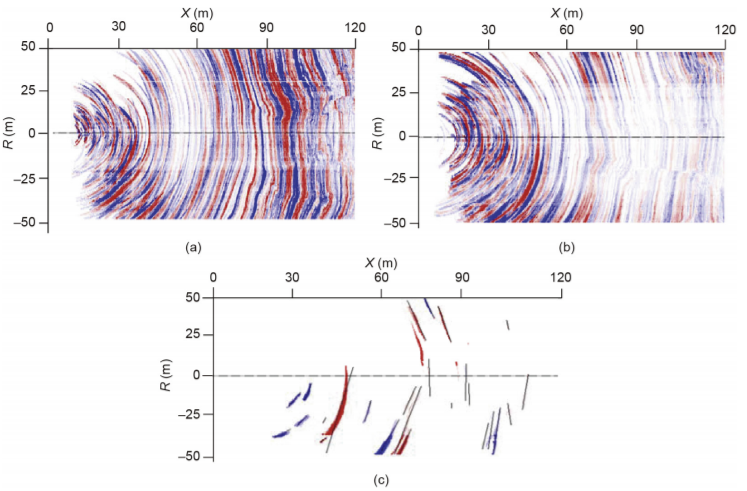
Fig. 5. Diagrams of longitudinaland transverse-wave depth migration and reflector extraction. (a) Longitudinal-wave depth migration; (b) transverse-wave depth migration; (c) reflector extraction.
《Fig.6》
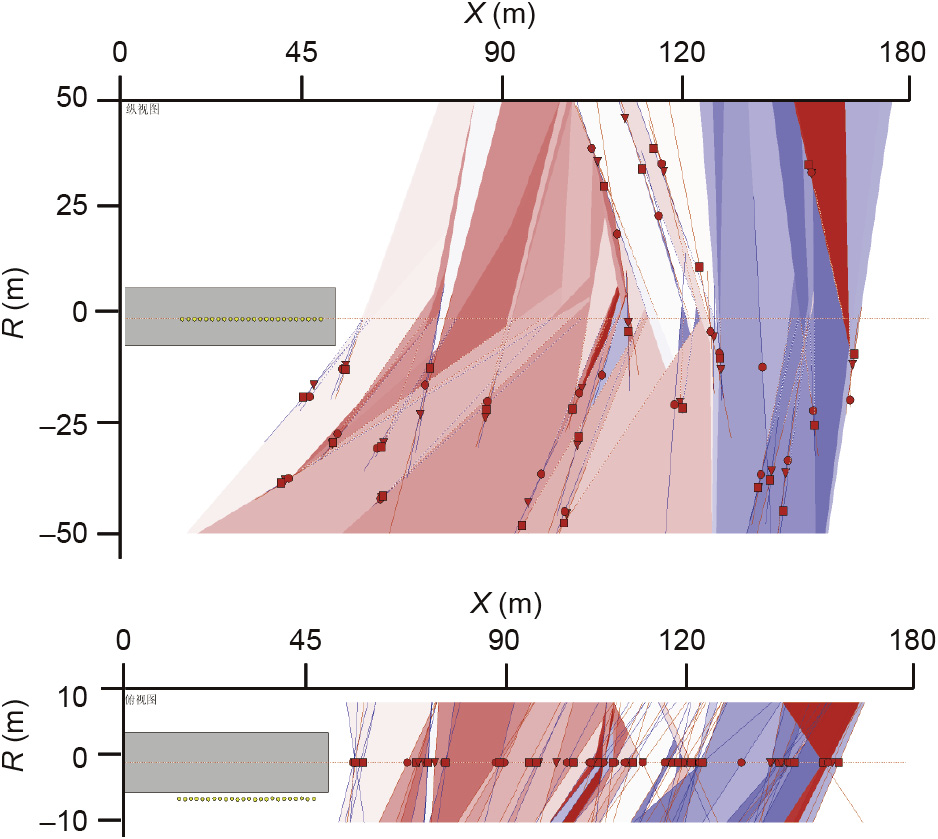
Fig. 6. 2D images of prediction results.
《Fig.7》
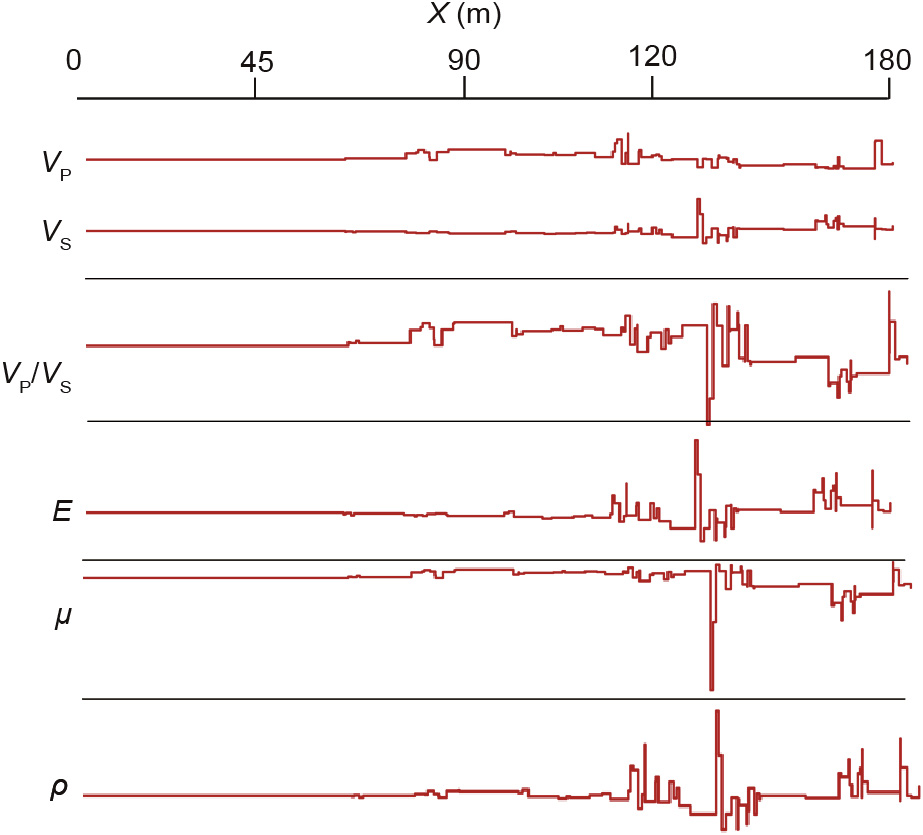
Fig. 7. Physical-mechanical parameters of rock mass. E:Young’s modulus; μ: Poisson’s ratio; q: density.
《Table 1》Table 1 Physical-mechanical parameters of rock mass.

4.3. Monitoring scheme
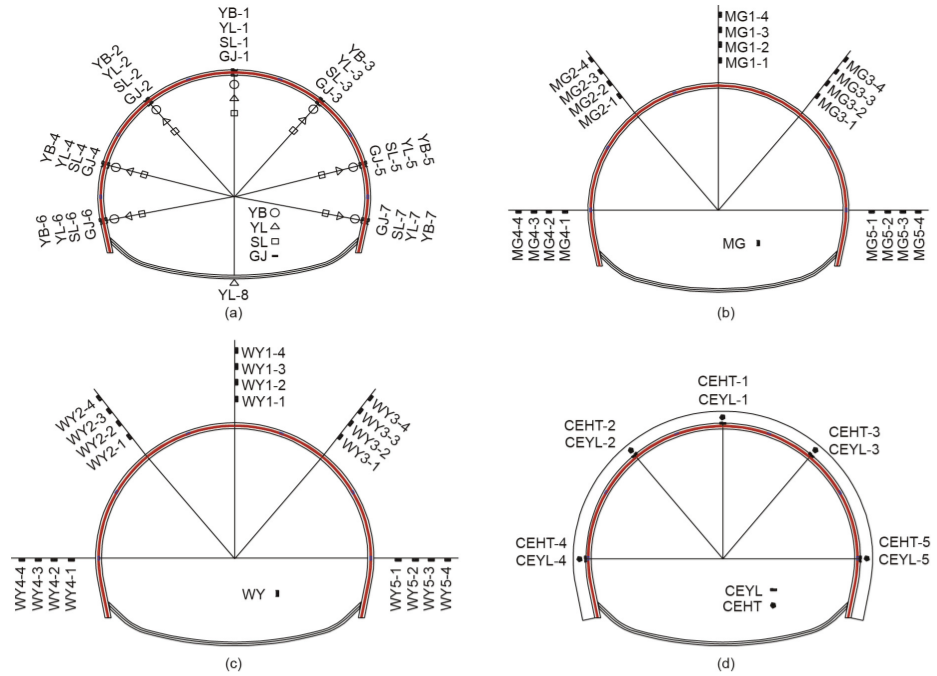
During underground-chamber excavation, a systematic comparison and analysis are conducted on the variation and distribution patterns of the clearance convergence and deformation of the surrounding rock, deep displacement of the surrounding rock, contact pressure between the surrounding rock and primary support, internal force of arch centering, axial force of rock bolts, contact pressure between the primary support and secondary lining, and annular strain in the secondary lining. Monitoring data are acquired by the following methods: carrying out continuous monitoring of the tunnel arch-crown settlement and horizontal convergence deformation using contact-free measurement methods with an electronic total station and reflectors; monitoring the contact pressure between the surrounding rock and primary support using a double-diaphragm pressure cell; monitoring the deformation and internal force of the arch centering with a surface-strain gauge and a reinforcement-stress gauge; monitoring the axial force of rock bolts by connecting the casing with a reinforcement-stress gauge at the measurement point; monitoring deformation at different depths of the surrounding rock with a multiple-position displacement meter; monitoring the contact pressure between the primary support and secondary lining using a double-diaphragm pressure cell; and monitoring the annular strain of the secondary lining concrete with an embedded strain gauge. Fig. 8 shows the monitoring components involved in field monitoring, while Fig. 9 gives their distribution [25].
《Fig.8》

Fig. 8. Monitoring components [25].
《Fig.9》

Fig. 9. Schematic diagram of monitoring components distribution [25]. (a) Observation point for surrounding rock deformation (SL), double-diaphragm pressure cell (YL), grid reinforcement-stress gauge (GJ), and surface-strain gauge (YB); (b) axial force of rock bolt (MG); (c) multiple-position displacement meter for deep surrounding rock (WY); (d) observation point for contact pressure between the primary support and secondary lining (CEYL) and annular strain of the secondary lining concrete (CEHT).
《4.4. Typical monitoring result and analysis》4.4. Typical monitoring result and analysis
4.4.1 Arch-crown settlement
As shown in Fig. 10 [25], the clearance deformation of the surrounding rock grows rapidly over time, without exhibiting any convergent tendency. As the tunnel face advances, the arch crown settlement increases in an obvious three-bench fluctuation to 323 mm in 38 days of observation, above the reserved deformation of 250 mm. As the scope of the self-supporting arch moves outward with underground-chamber excavation, large volumes of weak and broken surrounding rock are extruded, and the dead load of the surrounding rock and the stress load of the stratum structure act on the supporting structure; the latter deforms and loses its bearing capacity, resulting in continuous deformation of the surrounding rock. In addition, under the effect of horizontal extrusion stress in the tunnel site area, the convergence deformation of the middle and lower benches increases as the tunnel face advances, and exhibits no convergent tendency (convergence of the lower bench was not monitored because the measurement point in the low side wall was damaged during the construction). Shotcrete cracking and localized chipping occur at the arch crown and spandrel seven days after the supporting structure is sealed. To prevent the deformation from worsening, local chiseling, wire mesh re-installation, and re-spraying were carried out for reinforcement. Under the effect of high crustal stress, weak, broken carbonaceous phyllite exhibits obvious rheological characteristics.
《Fig.10》


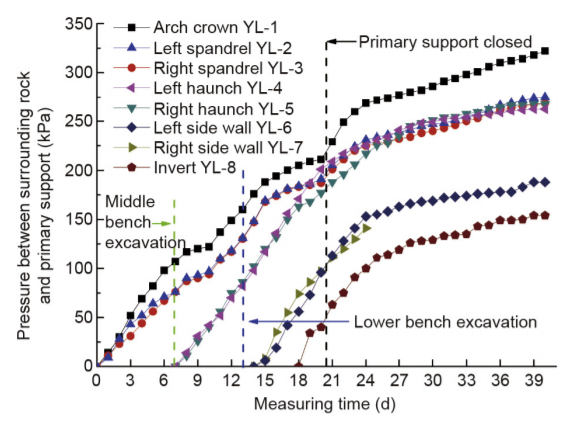
4.4.2. Contact pressure between surrounding rock and primary support
Time-history curves of the pressure between the surrounding rock and the primary support are shown in Fig. 11 [25] (some monitoring components were damaged during construction, so the data from corresponding measurement points are missing). As the tunnel face advances, with the surrounding rock released load and the released load of the surrounding rock induced by the disturbance of blasting vibration acting on the supporting structure, the contact pressure growth trend is markedly affected by the construction, and the time-history curves of the contact pressure at the monitoring point exhibit a similar trend, with the contact pressure between the surrounding rock and the primary support reaching up to 330 kPa at the arch crown. According to Fig. 11, the contact pressure variation is characterized by a three-bench pattern, especially regarding the contact pressure at the arch crown and spandrel on both sides. In addition, following the closure of the primary support, the contact pressure grows rapidly and exhibits no convergent tendency.
4.4.3 Adjustment and optimization of construction scheme
For the mass monitoring and detection data that were obtained through the construction, a GP model was used to establish associations between mass multi-source heterogeneous data and between the data and structural safety, and to establish a forecast and early-warning threshold. When the deformation in the surrounding rock and the stress in the supporting structures exceed the threshold, additional high-precision monitoring components are arranged in the corresponding area in order to obtain data, which are then imported into the data service system to evaluate and forecast the safety and performance of the supporting structure, provide data support for the selection of a construction scheme and the optimization of support parameters, and avoid disastrous accidents. The associations between the data established under all conditions will be stored in the data pool, which will be continuously supplemented, improved, and developed; in addition, the data service system will provide valuable data-enquiry and technical guidance services for the construction of similar projects.
《5. Conclusions》
5. Conclusions
On the basis of data-association technology and NATM construction characteristics, an optimized data service system is presented here, with the support of a big data environment. This system can integrate mass multi-source heterogeneous data from tunnel construction and establish associations between relevant construction parameters under the same conditions, using the GP model. Data associations and relations are stored in a data pool, which is continuously developed and supplemented so that similar relations can be used under similar conditions to provide data references for resource allocation and valuable guidance for the construction of similar projects. The large-deformation section of the ongoing construction of the Chengdu–Lanzhou Railway, which passes through typical carbonaceous phyllite, is taken here as an example. This paper summarizes the real-time monitoring of construction information and dynamic adjustment to the construction scheme based on the data service system presented here. With the development and supplementation of the data resource pool, this data service system can provide a technical basis for construction schematic designs and for the optimization of support parameters in similar projects.
《Acknowledgements》Acknowledgements
This work was supported by the National Natural Science Foundation of China (51778033 and 51408018). Great appreciation goes to the editorial board and the reviewers of this paper.
《Compliance with ethics guidelines》
Compliance with ethics guidelines
Bowen Du, Yanliang Du, Fei Xu, and Peng He declare that they have no conflict of interest or financial conflicts to disclose.


 京公网安备 11010502051620号


