


《1. Introduction》
1. Introduction
Mean sea level (MSL) is a geodetic level and a basic parameter used in civil engineering design, especially for coastal, estuarine, and deltaic areas [1–5]. Since the 21st century, global warming has accelerated both the degree and the speed of MSL rise [6–11]. A recent discovery concerning climate change suggests that human activities have committed us to a long-term future sea level of up to 1.9 m higher in 2100 than today, with a further 4.8 m rise in global MSL being possible over the next two millennia under the 1.5 °C and 2 °C global warming scenarios [12,13]. Estuaries and deltas are exposed to the direct threat of MSL rise, and adaptation action strategies have become an important agenda of the scientific community and governments all over the world [3,14–22]. This is also because 80% of large cities with more than a million people lie along estuarine and deltaic regions around the world. Furthermore, the elevations of most of these cities are lower than the local high tidal level [3]. A number of severe coastal floods have recently caused extensive property damage, lengthy service disruptions, and hundreds of fatalities across the Asia-Pacific, Europe, and Australia, leading to an active demand for estuarine and deltaic cities to adapt to sea level rise (SLR) [23–26].
However, it is difficult for policymakers, coastal managers, and development planners to implement adaptation actions due to the uncertain causes, magnitudes, and timings of SLR behaviors. In particular, uncertainty arises from the complex system of atmospheric, oceanic, and terrestrial processes and their interactions on a range of spatial and temporal scales. The changing climate, including SLR and anthropogenic geomorphologic changes (AGCs), further exaggerates this complexity and uncertainty [24,27–32].
Nevertheless, this paper attempts to map SLR behaviors on a decadal scale. This new mapping attempt is performed through a comprehensive analysis involving a combination of hydrology, geomorphology, and in situ measurement along the Shanghai coast in the Yangtze River Delta (YRD) (Fig. 1). We provide an analysis of SLR up to 2030, which is the year when certain specific objectives of water conservancy planning used in the local socioeconomic management system will be achieved. In Section 2, we clarify the causes of SLR behaviors along the Shanghai coast, and in Sections 3 to 6, we estimate the magnitudes of SLR behaviors. Section 7 provides an accumulation of the total magnitude of SLR projections from 2011 to 2030. In Section 8, we first calculate the local tidal datum rise (LTDR), which is a special SLR behavior. A clarification of SLR behaviors will assist local decision-makers in planning structural and non-structural measures that are necessary to combat escalating flood damage costs in an estuarine delta system.
《Fig.1》
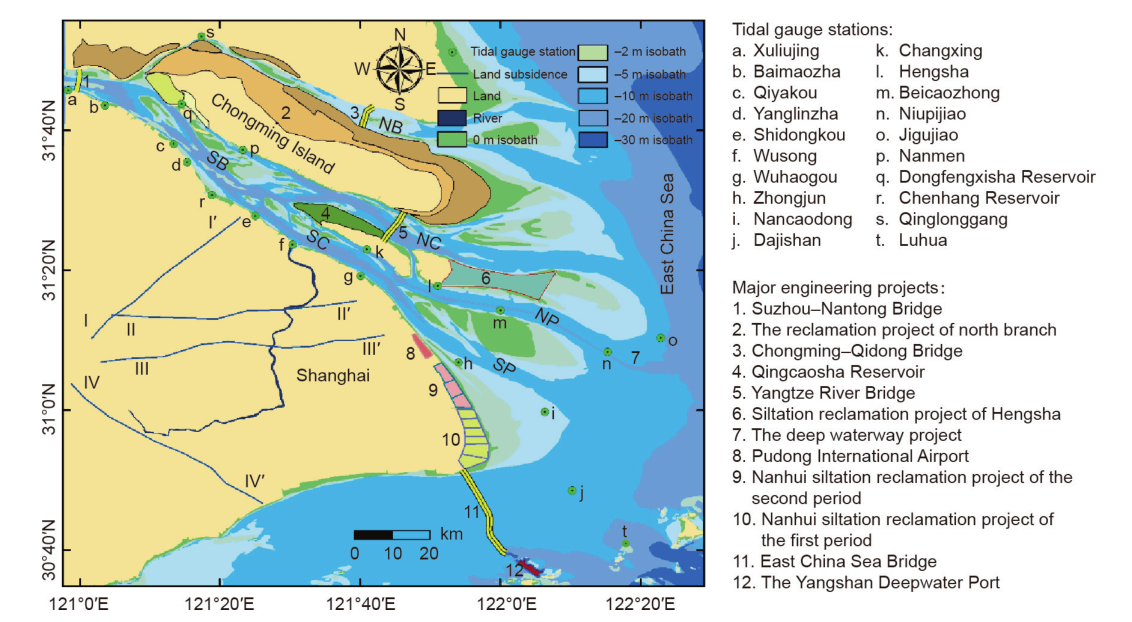
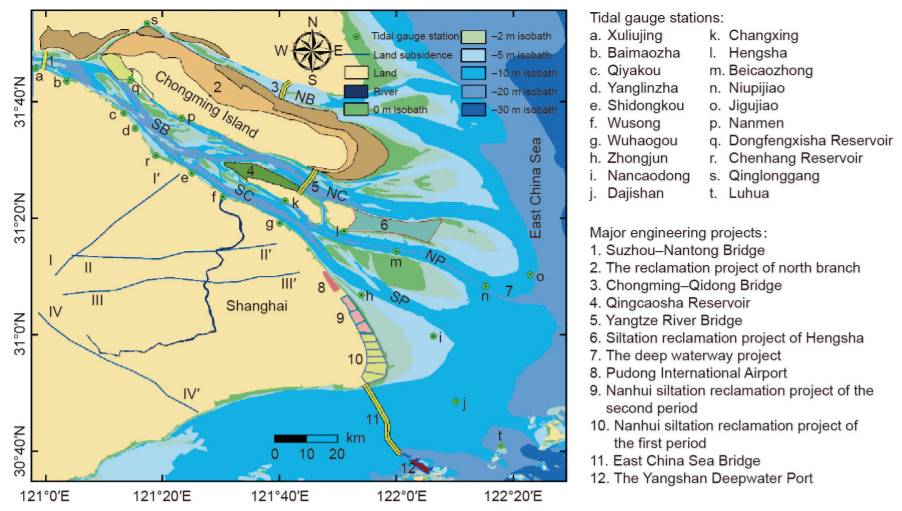
Fig. 1. Bathymetry map showing the distribution of tidal gauge stations, an urban land-subsidence profile, and major engineering projects in the Yangtze River estuary and along the north coast of Hangzhou Bay, Shanghai. SB: South Branch; NB: North Branch; SC: South Channel; NC: North Channel; SP: South Passage; NP: North Passage.
《2. Causes of sea level rise along the Shanghai coast》2. Causes of sea level rise along the Shanghai coast
Shanghai is a megacity that serves as an economic, financial, trade, and shipping center of China. It has a mainland coastline of 211 km and an island coastline of 577 km (Fig. 1). The city is located in the YRD and has a population of 24 million people [33]. Most of its elevation is below the decadal average high tidal level of 3.25 m, with the lowest elevation being 2.2 m above the local Wusong elevation datum (WED) [34]. In addition, more than 70% of fresh water is supplied by reservoirs located on the bank of the mouth bar and tidal flat in the YRD [35]. Therefore, the city of Shanghai is exposed to significant risks of flooding and fresh water supply shortages resulting from mean sea level rise (MSLR) [36–42]. A number of severe floods recently occurred during typhoon storms such as Typhoon Winnie in 1997 and Typhoon Matsa in 2005, as well as during Typhoon Nepartak in 2016 [23]; these events demonstrate the urgent demand to map the causes of SLR behaviors.
In fact, the causes of SLR are a difficult research topic that requires interdisciplinary cooperation. The First Assessment Report (AR1) to Fifth Assessment Report (AR5) of the Intergovernmental Panel on Climate Change (IPCC) and the annual reports on China’s response to climate change policies and actions have indicated the causes of SLR as being climate warming, tectonic subsidence (TS), and urban land subsidence (ULS) by the anthropogenic extraction of underground water [3,4].
Following these reports, the first SLR magnitude projections along the Shanghai coast were made in 1996, and indicated increases of 10–25 cm, 20–40 cm, and 50–70 cm from the benchmark year 1991 to the target years 2010, 2030, and 2050, respectively; these years were chosen to achieve specific water conservancy planning objectives [43]. The SLR projection was composed of three components. The first was the eustatic sea level rise (ESLR) projection of 2 mm·a-1 in the IPCC AR1 [44]. The second was the global TS measurement of 1 mm·a-1 from 1988 to 1994 by the Shanghai Astronomical Observatory of the Chinese Academy of Sciences. The third was the ULS projection of 6 mm·a-1 near the reference of the Wusong tidal gauge station (WTGS) [43,45]. This SLR projection has been specified as the reference for local elevation datum for civil engineering and urban planning since that time [43,45].
However, the annual MSL measured at the WTGS [5,45] showed an MSLR of 5.2 cm from 1991 to 2010. This is much less than the projected SLR of 19 cm from 1996 [43]. Thus, mapping the causes of MSLR is essential for the public and for decision-makers.
Here, we clarify the following causes for the significant difference between the measured MSLR and the SLR projections made in 1996 along the Shanghai coast. The first cause is the minor change in ESLR produced by climate warming. The second cause is the small changeable scope of TS that resulted from the lithosphere plate motion and mantle flow, which is similar to the magnitude along the continental borders around the Atlantic Ocean [46]. The third cause is the decline in ULS. The fourth cause is regional sea level rise (RSLR) due to land reclamation and deep waterway regulation. The fifth cause is regional sea level fall (RSLF) due to riverbed erosion, which is attributed to the sedi ment supply decline caused by dam construction in the river catchment. The latter two causes of sea level change have never been discussed before. We map these five SLR causes from 2011 to 2030.
《3. Eustatic sea level rise》3. Eustatic sea level rise
Because the WTGS has the longest dataset of tidal level measurements from 1912 to 2000, it was chosen as the reference station for ESLR projection along the Shanghai coast to 2030. Historical hourly measured tidal levels in the WED at the WTGS (Fig. 1) were adopted to calculate the annual MSL and ESLR. These data were revised using the local real-time ULS measured around the WTGS. All of the data are calibrated to the WED.
Two approaches are used to calculate the magnitude of ESLR at the WTGS: One is a combined linear regression of MSL integrated with the gray linear system (GLR) proposed by the first author and her students [47,48]; the other is the least square (LS) method [46]. Wavelet analysis was used in both approaches. The F-test of significance was used to test the confidence of the regression coefficients [45,48,49].
The wavelet analysis results of the annual MSL show six significant periods of 19 years, 10.8 years, 7.6 years, 5.2 years, 2.6 years, and 1 year (see Fig. 2 in Ref. [49]), which pass the F-test value of 0.05. These periods are similar to the periods of the node constituent (18.6 years), the ecliptic-lunar orbit intersection motion (9.3 years), the sunspot cycle (11 years), the El Niño–Southern Oscillation (ENSO) (ranging from 2 years to 7 years), and significant seasonal variation (ranging from 31.1 cm to 42.2 cm) [50], respectively.
《Fig.2》

Fig. 2. Accumulative ULS from 1921 to 2013; water exploitation in 1960–2013 and recharge in 1965–2013 of underground water in the Shanghai Municipality.
After assessing these six periods via two approaches—the GLR and LS methods—for calculating the ESLR trends of annual MSL measured at the WTGS, the results show 3.6 cm and 4.4 cm, respectively, of ESLR from 1921 to 2000. These two results revealed a small difference between the two approaches, indicating that the estimated results will not be distorted by the original periods of the datasets. Moreover, a subsequent recalculated result of the LS approach predicted a slightly larger ESLR of 3.1 cm, compared with the measured value of 2.6 cm from 2000 to 2010 [49]. This result indicates that the use of the LS method yields an overestimated ESLR. Thus, we propose the average value of 4 cm (2 mm a—1) from the two approaches’ results for the ESLR projection along the Shanghai coast until 2030 (Table 1) [34].
《Table 1》Table 1
Predicted values for the rate of SLR in 1996 [34] and from the current study.

This ESLR trend obviously implies a possible climate warming. However, it is definitely opposite to the cooling trend observed since 2006, which was obtained by analyzing astronomical observatory data and geological data from the variation of the ice edge in the Barents Sea [51] and evidence of Holocene high-amplitudes events [52].
However, the above magnitude of an ESLR of 2 mm·a-1 for the Shanghai coast until 2030 is similar to the value that was projected for the Shanghai coast in the 1990s [35,53] and to the IPCC AR1 [54]. It is slightly higher than the long-term mean global SLR of 1.7mm·a-1 from 1901 to 2010 [3], and slightly lower than the average value of 2.1 mm·a-1 for the measured data at tidal gauge stations and satellite altimetry data [55]. It is much lower than the short-term mean global SLR of 3.2mm·a-1 from 1993 to 2010 that was provided in the IPCC AR5 [3]. It is also slightly higher than the simple weighted average ESLR, ranging from 1 mm·a-1 to 1.8mm·a-1, which is based on the data tide at tidal gauge stations [48,56] or than the global average ESLR of (2 ± 0.2) mm·a-1, which was calculated from satellite altimetry data [55]. However, our predicted ESLR value along the Shanghai coast is smaller than the global ESLR of (2.6 ± 0.4) mm·a-1 from 1950 to 1998 and (3.2± 0.2) mm·a-1 from 1993 to 1998, as those were calculated from the thermal expansion of ocean water, which is mainly due to global warming [57,58]. Our predicted ESLR value in 2030 is lower than previous results from Chinese research in the 1980s and 1990s [59–61]; this difference may be related to a short-period sea level oscillation caused by the complex effect mechanism of regional climate change and SLR resulting from anthropogenic geomorphic changes.
《4. Urban land subsidence》4. Urban land subsidence
The loss of local geodetic elevation—that is, ULS or SLR—had already been noticed in Shanghai and was being monitored as early as 1932. A principle named ‘‘enclosing and draining” was launched in 1956 to control flooding and waterlogging caused by ULS [62]. The average ULS in the central urban area is about 2 m since 1921 (Fig. 2); the cumulative subsidence in the worst-affected areas has been 3 m since 1921. Since 2004, the Shanghai municipal government has taken effective measures by speeding up the construction of intensive water supplies, reducing groundwater exploitation, increasing groundwater recharge capacity, and effectively controlling ULS to a rate of lower than 5 mm·a-1 (Fig. 2) [62]. A significant decrease in ULS is attributable to the intensifying control measures and to strict local legislation of underground water extraction since the 1960s [62].
Our historical annual ULS data from 2000 to 2009, which were measured at 18 bedrock benchmarks along four sections (I, II, III, and IV in Fig. 1) from west to east and from north to south in Shanghai, were collected in order to investigate the cumulative magnitudes of ULS from 2000 to 2009 (see Table 1 in Ref. [5]). Next, our constructed trend-surface model [47] was applied to make the ULS projection. The polynomial coefficients of the model were estimated using the best linear unbiased estimator of the LSs according to a Gauss–Markov chain analysis, followed by the LSs of residuals [48]. The Poisson cycle model of soft clay strata was used to determine a projection of ULS for 20 years, from 2011 to 2030, with a significance test. Simulation results by a Poisson cycle model showed a ULS magnitude of 8 cm for 20 years and a rate of land subsidence of 4 mm·a-1 around the WTGS [47] (Table 1).
5. Regional sea level rise
Variations in annual MSL from 1996 to 2011 at the five tidal gauge stations of Changxing, Hengsha, Beicaozhong, Nancaodong, and Zhongjun show a significant MSLR ranging from 8 cm to 10 cm (Fig. 3). Meanwhile, the lowest tidal levels rose from 33 cm to 42 cm from 1993 to 2011 (Fig. 4). The RSLR can presumably be attributed to banked-up water over a large area of land reclamation by siltation on the Hengsha shoal and to channel narrowing of the Deep Waterway Regulation Project (DWRP) in the North Passage (NP) of the Yangtze River estuary from 1998 to 2011 (Fig. 5) [62]. This assumption is verified by an obvious relationship between the larger rise of annually averaged tidal levels greater than 4 m at the Qinglonggang tidal gauge station and land reclamation area along both sides of the North Branch (NB) (Fig. 6). The land reclamation area is calculated from the digitized nautical charts of the NB from 1956 to 2000.
《Fig.3》

Fig. 3. Variations in annual MSL from 1996 to 2011 at 11 tidal gauge stations: Shidongkou, Wusong, Nanmen, Changxing, Hengsha, Beicaozhong, Zhongjun, Niupijiao, Jigujiao, Nancaodong, and Luhua.
《Fig.4》
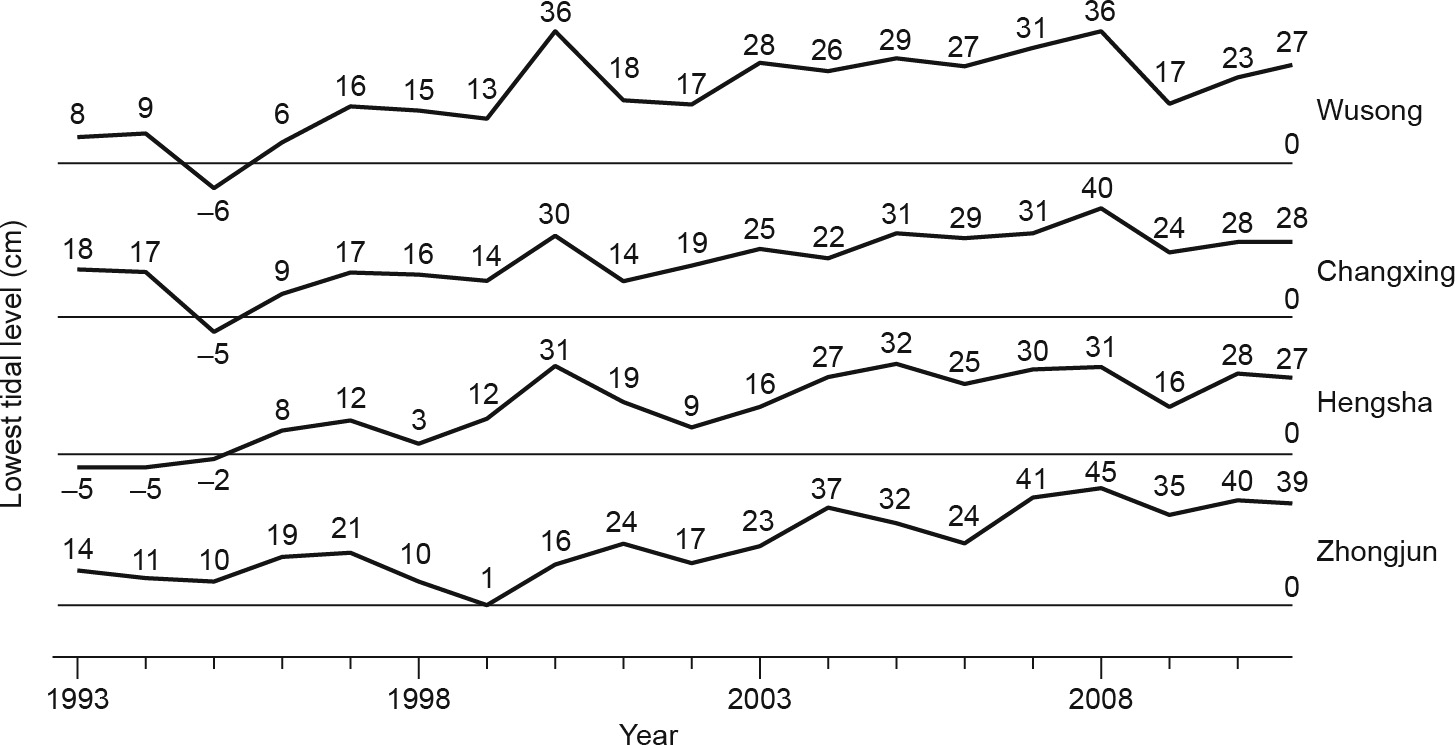
Fig. 4. Variations in the lowest tidal level from 1993 to 2011 at the tidal gauge stations Wusong, Changxing, Hengsha, and Zhongjun.
《Fig.5》

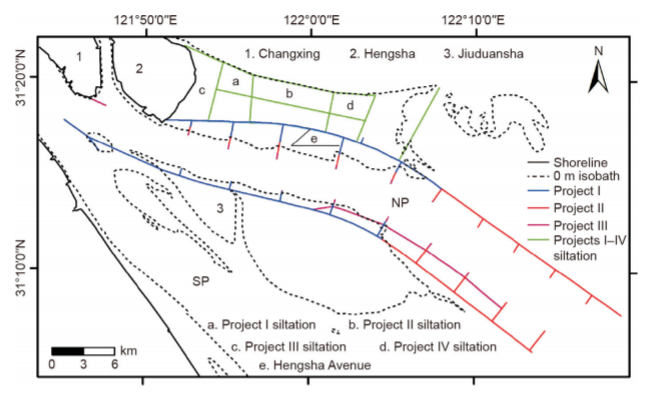
Fig. 5. Land reclamation areas, with dyke and groin constructions in Projects I (January 1998–April 2002), II (September 2002–November 2005), III (September 2006–May 2011), and IV (March 2008–June 2009) for deep waterway regulation in the NP of the Yangtze River estuary.
《Fig.6》

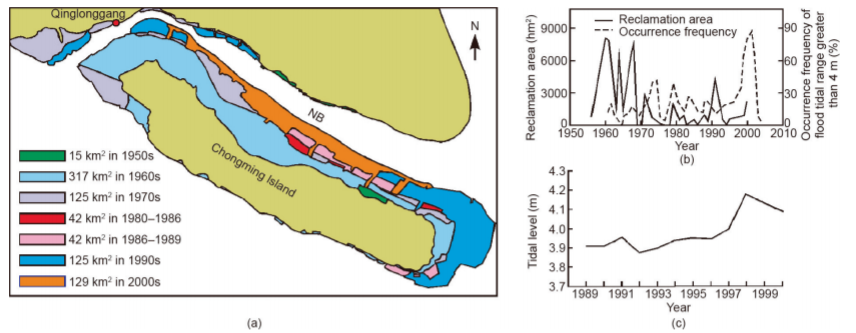
Fig. 6. (a) Land reclamation projects in the 1950s to 2000s around the NB of the Yangtze River estuary; (b) relationship between reclamation area (hm2) and occurrence frequency (%) of a flood tidal range greater than 4 m; (c) mean high tidal level at the Qinglonggang tidal gauge station from 1989 to 2000.
Thus, we speculate that large-area land reclamation contributes significantly to SLR. A magnitude of RSLR ranging from 8 cm to 10 cm from 1996 to 2011, determined by sets of estuarine engineering, is recommended for the past two decades. This is assumed to continue until 2030, as a large area of land reclamation is ongoing along the North Channel (NC), NP, and South Passage (SP) along the Shanghai coast in the YRD (Table 1).
《6. Regional sea level fall》6. Regional sea level fall
Changes in annual MSL from 1996 to 2011 at the three tidal gauge stations of Shidongkou, Nanmen, and Wusong in the South Branch (SB) show a significant MSL fall (i.e., RSLF) ranging from 2 cm to 10 cm between 2003 and 2011 (Fig. 3). The RSLF occurred when the Three Gorges Dam (TGD) was closed in 2003 and strong riverbed erosion occurred [63–65]. The largest RSLF of 10 cm from 2003 to 2011 occurred at the Shidongkou tidal gauge station, where stronger riverbed erosion appeared, and which is located upstream of the WTGS in the main channels of the YRD (see Fig. 3 in Ref. [66]). The RSLF ranges from 2 cm to 10 cm between 2003 and 2011 at the WTGS. The magnitude of RSLF is coincident with the magnitude of riverbed erosion ranging from 2 cm to 10 cm between 2002 and 2009 in the SB [63,65]. It is smaller than the annual MSLR of 5.2 cm from 1991 to 2010 (see Section 2). The difference is mainly attributed to a large amount of deposition, ranging from 16 cm to 18 cm, between 1990 and 2001, and to riverbed erosion ranging from 2 cm to 10 cm [65]. This finding implies a remarkable contribution of riverbed erosion to the RSLF in the YRD.
Nevertheless, a magnitude assessment of RSLF is quite difficult and is currently under research because of a very complicated feedback mechanism between MSL and the channel riverbed erosion/deposition process [66–72]. Moreover, the paucity of RSLF assessment in the YRD is due to a more complex mechanism among the tidal level, riverbed erosion/deposition process, and sediment supply decline of the Yangtze River from 4.5×10⁸ t ·a-1 between 1950 and 1985 to 1.5×10⁸ t ·a-1 between 2003 and 2016 because of the TGD, soil and water conservation, and a large amount of sand mining [73]. Furthermore, stronger riverbed erosion ranging from 1 m to 6 m was detected using a SeaBat 7125 multi-beam echo-sounder (Teledyne RESON, Inc., CA, USA) in the SB on 8 August 2015 (Fig. 7(a)) and a sub-bottom profiler EdgeTech 3100 (EdgeTech, MA, USA) in the NC on 29 October 2014 (Fig. 7(b)). Thus, in order to obtain a magnitude estimation of RSLF for the Shanghai coast from 2011 to 2030 (Table 1) at the present time, we can follow an uncertain range from 2 cm to 10 cm of RSLF in the SB from 2003 to 2011.
《Fig.7》

Fig. 7. (a) Riverbed erosion of the channel at the tidal limit of the Yangtze River estuary, detected by a SeaBat 7125 multi-beam echo-sounder on 8 August 2015; (b) riverbed erosion measured in the middle reach of the NC, measured by a sub-bottom profiler EdgeTech 3100 on 29 October 2014, five years after the completion of the Qingcaosha Reservoir.
7. Sea level rise projection
The SLR projection is the sum of the estimates for the abovementioned five SLR behaviors: ESLR, TS, ULS, RSLR, and RSLF. It ranges from 10 cm to 16 cm and is made up of an ESLR of 4 cm, a TS of 2 cm, a ULS of 8 cm, an RSLR ranging from 8 cm to 10 cm, and an RSLF ranging from 2 cm to 10 cm (Table 1). Although this is a rough estimate, our projection attempts to make a semiquantitative assessment of uncertain SLR, especially SLR caused by AGC [69–74].
《8. Local tidal datum rise》8. Local tidal datum rise
Along the Shanghai coast, floating tidal datum and local geodetic reference elevation are calculated using the average water level over a 19-year interval, and are reviewed and revised periodically. The lowest normal low tidal level is adopted as the local tidal datum along the Shanghai coast, and is calculated from annual MSL data at 14 tidal gauge stations—Xuliujing, Baimaozha, Qiyakou, Yanglinzha, Shidongkou, Wusong, Changxing, Wuhaogou, Hengsha, Zhongjun, Beicaozhong, Nancaodong, Niupijiao, and Dajishan—from 1974 to 2013 in the YRD by using a Vladimir algorithm with 13 tidal harmonic constituents: Sa, Ssa, M2, S2, N2, K2, K1, O1, P1, Q1, M4, Ms4, and M6.
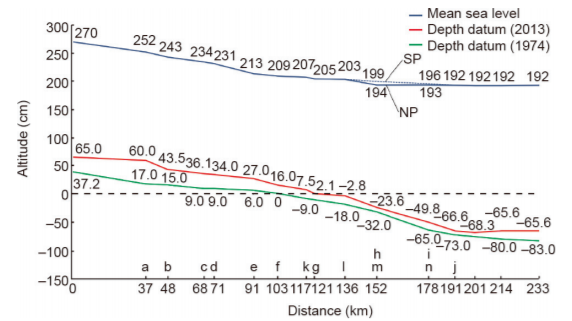
The results show a significant decadal LTDR ranging from 15 cm to 43 cm for the past four decades (Fig. 8). This is similar to the variability of synchronous SLR at the same tidal gauge stations (Fig. 3) and is considered to be caused by the synchronous AGC in the YRD (Fig. 8). The fact of the LTDR can explain well the reason why increasing waterlogging has occurred in estuarine and coastal cities. This finding calls for the emergent necessity of matching the MSLR projections to the local elevation datum [1,22].
《Fig.8》

Fig. 8. Variations in the theoretical tidal datum in 1974 and 2013 at 14 tidal stations: a. Xuliujing, b. Baimaozha, c. Qiyakou, d. Yanglinzha, e. Shidongkou, f. Wusong, g. Wuhaogou, h. Zhongjun, i. Nancaodong, j. Dajishan, k. Changxing, l. Hengsha, m. Beicaozhong, n. Niupijiao. The distance starts from Tianshenggang, which is located upstream in Nantong, Jiangsu Province.
《9. Conclusions》9. Conclusions
Six types of SLR behavior along the Shanghai coast in the YRD for the past 60 years are mapped in this study, although many uncertainties exist in the magnitude and timing of SLR in an estuarine delta system. This unusual attempt was performed by analyzing the long datasets of tidal level that were recorded at very densely distributed tidal gauge stations with synchronous geomorphology changes in detail along the Shanghai coast in the YRD. These new understandings of RSLR, RSLF, and LTDR behaviors are helpful for decision-makers, coastal planners, and river basin management in planning the non-structural measures that are necessary to combat escalating flood damage costs in a river catchment system.
《Acknowledgements》Acknowledgements
This study was financially supported by the National Natural Science Foundation of China–the Netherlands Organization for Scientific Research–Research Councils UK (NSFC–NWO–RCUK) (51761135023), the Shanghai Science and Technology Committee (10dz1210600), the National Sea Welfare Project (201005019 09), the National Natural Science Foundation of China (41476075), and the China Geological Survey (DD20160246). We would like to give a special acknowledgement to the second author, Professor Ji-Yu Chen, who was a great scientist of estuarine and coastal research, for the excellent suggestions and guidelines he provided over a considerable period of time before he passed away.
《Compliance with ethics guidelines》
Compliance with ethics guidelines
H.Q. Cheng, J.Y. Chen, Z.J. Chen, R.L. Ruan, G.Q. Xu, G. Zeng, J.R. Zhu, Z.J. Dai, X.Y. Chen, S.H. Gu, X.L. Zhang, and H.M. Wang declare that they have no conflict of interest or financial conflicts to disclose.


 京公网安备 11010502051620号


