《1.The use of social media and research needs》
1.The use of social media and research needs
Resilience is human-centric and is constitutive of the interactions between society, culture, humans and their community, and the environment [1]. Infrastructure resilience is intimately tied to the community it serves since the community’s attitudes and responses toward system disruptions frame the resilience discourse [2]. The Presidential Policy Directive 21 (PPD 21) defined resilience as ‘‘the ability to prepare for and adapt to changing conditions and withstand and recover rapidly from disruptions. Resilience includes the ability to withstand and recover from deliberate attacks, accidents, or naturally occurring threats or incidents.” These definitions highlight the interactions between infrastructure, community, and hazards—that is, the recovery of both infrastructure and community from disasters [3]. Infrastructure resilience impacts a community; however, the community helps to define the requirements and standards for local infrastructure. One of the responsibilities of infrastructure stakeholders is to determine the resilience and sustainability of the infrastructure within a community. Although there are various tools that are relied upon, social media offers the platform described here to help determine the regional/local resiliency and sustainability of infrastructure.
Social media data mining is an emerging technique that offers the potential to connect community and infrastructure resilience with disasters. It comes in different formats and provides extensive structure to link social interactions with an extensive collaborative and decentralized community network. Social media turns content consumers into content producers. The contents of users’ locations, interactions between individuals within their community and with the broader world (expression and written words), and users’ time at different locations can be used to derive critical information [4].
Social media has performed pivotal roles in managing predisaster evacuations, reducing the impacts of disasters, coordinating disaster recovery, and documenting lessons learned—examples include the recovery effort in Joplin, Missouri after the 2014 tornadoes [5], and the use of social media to raise funds for Haiti earthquake recovery [6]. Prior research has demonstrated the use of social media in disaster management [7–11]. While social media is fast becoming an important avenue to connect people with society and technology, its potential has yet to be fully explored. As the amount of social media content grows, the role of social media has become increasingly important. Social media potentially offers a platform to model a community’s perceptions on the resilience of infrastructure to disasters.
《2.Research objectives and questions》
2.Research objectives and questions
The purpose of this paper is to understand the use of social media to connect a community with infrastructure resilience. Due to the scale of the research, the team only used Twitter data from the 2015 Chennai flood. Using texts and geotags collected from individual tweets, the research team studied the following: ① identifying the locations of affected infrastructure, ② understanding the seriousness of failures, and ③ understanding how information could be used to interpret infrastructure resilience, using only social media data. This research attempts to improve the understanding of how social media can be used to model community and infrastructure resilience. This paper also discusses and analyzes the connection between community resilience and infrastructure interconnectivity and performance using social media data mining and geotagging, paying particular attention to the language and verbiage used by the communities and to how a community’s culture affects the contexts in which language and verbiage are used. The following will introduce the interaction between different social media data.
This paper uses data from the tweets sent by Chennai’s Twitter users during the 2015 Chennai flood. This research uses data generated by Twitter; each tweet consists of 144 characters and a Twitter ID. Each tweet contains a set of textual data, account information associated with the text, geospatial data, and time tags that are publicly available. More information is available on other types of social media, such as Facebook, but that is private information and is not available to the public.
《2.1.Geotagging and time tags》
2.1.Geotagging and time tags
Geotagging is the process of integrating geographical identification metadata into social media data (e.g., photographs, videos, text messages, websites, Quick Response (QR) codes, Rich Site Summary (RSS) feeds, etc.). Each data item is assigned a unique geospatial identity, such as the location(s), sender’s information, latitude and longitude coordinates, bearing, distance, accuracy, place name, and time tag. The tagging may be performed manually by the user, or automatically by an electronic device (i.e., servers, WiFi, and/or a cellphone network).
《2.2.Text data》
2.2.Text data
Text mining, also known as text analytics, refers to the process of analyzing text information to derive high-quality information. The mining process involves structuring text input, deriving linguistic features, removing and/or inserting features, deriving patterns within structured data, and evaluating and interpreting the outputs. Text mining includes text categorization, clustering, entity extraction, the production of granular taxonomies, sentiment analysis, and entity relational modeling. Texts provide insight into how people understand and communicate with each other and about the subject matter.
《3.Background of the Chennai flood》
3.Background of the Chennai flood
The annual monsoon in Chennai, India, always floods the city and disrupts its population and economy. The flood has traditionally been made worse by an incapable and corrupt local government. The historical annual occurrences of the cyclones in Chennai have never been as devastating as the recent ones. The first documented cyclone occurred in 1903, when the population was 60% lower than it is today [12]. The first recorded devastating cyclone that passed through Chennai occurred in 1918. The 1943 cyclone completely devastated the city and destroyed the city’s transportation infrastructure [13]. The historical 1985 flood was the largest flood ever in Chennai, but the 2015 Chennai flood was nearly as bad. A torrential rain in 2015 caused by a deep depression over the Bay of Bengal disrupted life in Chennai and northern Tamil Nadu state [14]. Jesuraj et al. [12]conducted a mathematical analysis to evaluate the impact of the 2015 Chennai flood and discovered that it affected 53% of the regional environment, 25% of the agriculture, and 15% of the regional health. The flood also polluted critical water infrastructure, groundwater, and river water due to leaks from chemical and power plants [12].
Chennai received more than 100 inches (1 inch = 2.54 cm) of rainfall during the 2015 monsoon season; added to the city’s years of illegal development and inadequate flood preparedness, the 2015 Chennai flood caused more damage than prior cyclones, even though it was slightly smaller than the one in 1985. Chennai officials reported that at least 57 000 homes in the city suffered from structural damage. Due to rainfall in the Tirunelveli District, all of the local dams were breached by 7 December 2015, forcing the local authorities to discharge excess water from the reservoirs into the river. As a result, water from the river flowed into the dry areas [12]. The Southern Railway canceled major train services, and Chennai International Airport was closed after 6 December 2015 [15]. The number of fatalities increased at hospitals that did not have power or oxygen supplies, while the lack of coordinated relief response in North Chennai forced thousands of residents to evacuate out of the city on their own [12]. Without government help, the local population had to rely on itself during the flood and the aftermath of the recovery. Chennai’s local population had always been resilient against floods, and had always taken the initiative to assist in rescue and recovery efforts. Erroneous and ill-informed decisions made by the authorities had always increased local resilience against natural disasters. The lack of planning to expand the floodcontainment facility, the lack of communication between the government and the local population, and the lack of communication between interconnected infrastructure (e.g., cellphone towers and roads) slowed down the recovery efforts.
《4.Social media selection》
4.Social media selection
Prior investigation revealed that an extensive amount of relevant information was available from various social media sources, including information on the use of social media data to understand community responses to climate change [16], potential solutions to improve infrastructure resilience to flooding [17–19], and information on the use of comments from news media to study the seriousness of the flood [20–25]. However, such information remained largely unexplored. Although social media was used by the relief teams and military aiding Chennai during the disaster recovery, the bulk of social media postings came from Chennai residents. Social media became a powerful tool throughout the disaster, as it was used to reach out to the affected residents, and served as an important emergency communication tool.
Chennai was badly hit when rivers and lakes breached their banks and submerged many areas (water was as high as the second level of many buildings) (Fig. 1) [26]. The flood cut off power in many parts of the city, and many cellphone towers were deprived of power [26]. Facebook, Twitter, and WhatsApp were the most frequently used social media platforms during the flood. These media platforms helped the residents to update the current status of their towns and regions, and allowed them to communicate [26]. Different social media platforms provided different types of information. Facebook was used as the messenger of the relief team to reach out to emergency locations, Twitter hashtags were used to locate food and resources for the residents, and both were used to help raise money for the residents. WhatsApp served as a direct telephone communication tool, as landlines were disrupted. Facebook came up with a flood safety check to update residents on the latest progress of the disaster.
《Fig. 1》

Fig.1.Chennai after the rain[26].
As a result, Twitter (through #Chennai rains, #Chennai volunteer, #Chennai rescue, and #Chennai rains help trending) and Facebook were the two most important platforms during the entire disaster period [12,13]. However, data from Facebook are less accessible, and Twitter provides its application programming interfaces (APIs) for data collection by users, albeit to a limited degree; therefore, the research team decided to rely only on Twitter.
《5.Study and analysis methodologies》
5.Study and analysis methodologies
Current data analytical techniques are mostly numeric based. They do not handle texts and geospatial metadata effectively, as texts and geospatial metadata require different analytical techniques. The quantity of words used is not the only important piece of information. Most text-mining software is numeric based. As a result, the research team integrated existing text-mining software with a manual data-mining approach to analyze both the texts and the metadata. The research team conducted the following tasks: ① They analyzed and discovered the themes and sub-themes of the texts and metadata, ② they reduced and selected a number of themes and sub-themes that were important to the research objective, ③ they built hierarchies of themes or code books related to the objective, and ④ they linked these themes to the concepts.
Social media data contain geospatial metadata that can be used to determine the tweets’ locations. Geospatial metadata can also be tagged and connected between individuals to form a network of individuals. A network of individuals from the same community or neighborhood will then form a network of metadata and texts that are then connected to a network of infrastructure affecting the community. The geospatial metadata and texts sent from social media contain time tags that provide information on the space where, and the time when, the neighborhood and community interacted with the infrastructure.
The research team collected tweets posted during the recent floods in Chennai using the Twitter Streaming API for analysis. The team selected a subset of tweets that contained geotag metadata, and the metadata was used to map the tweets’ locations. The locations were then illustrated on a Google Map. The tweets were grouped by infrastructure issues and types of issues that the city suffered from, particularly for roads, electricity, dams, and the telephone network. The tweets are filtered by the keywords from each tweet. Fig. 2 [26] displays the locations from where Twitter users posted on infrastructure problems. Using the above featureextraction techniques, data from Twitter were extracted and used to develop Figs. 3↑ and 4.
↑The maps are provided by the author and are granted by www.mapsofindia.com.
《Fig. 2》
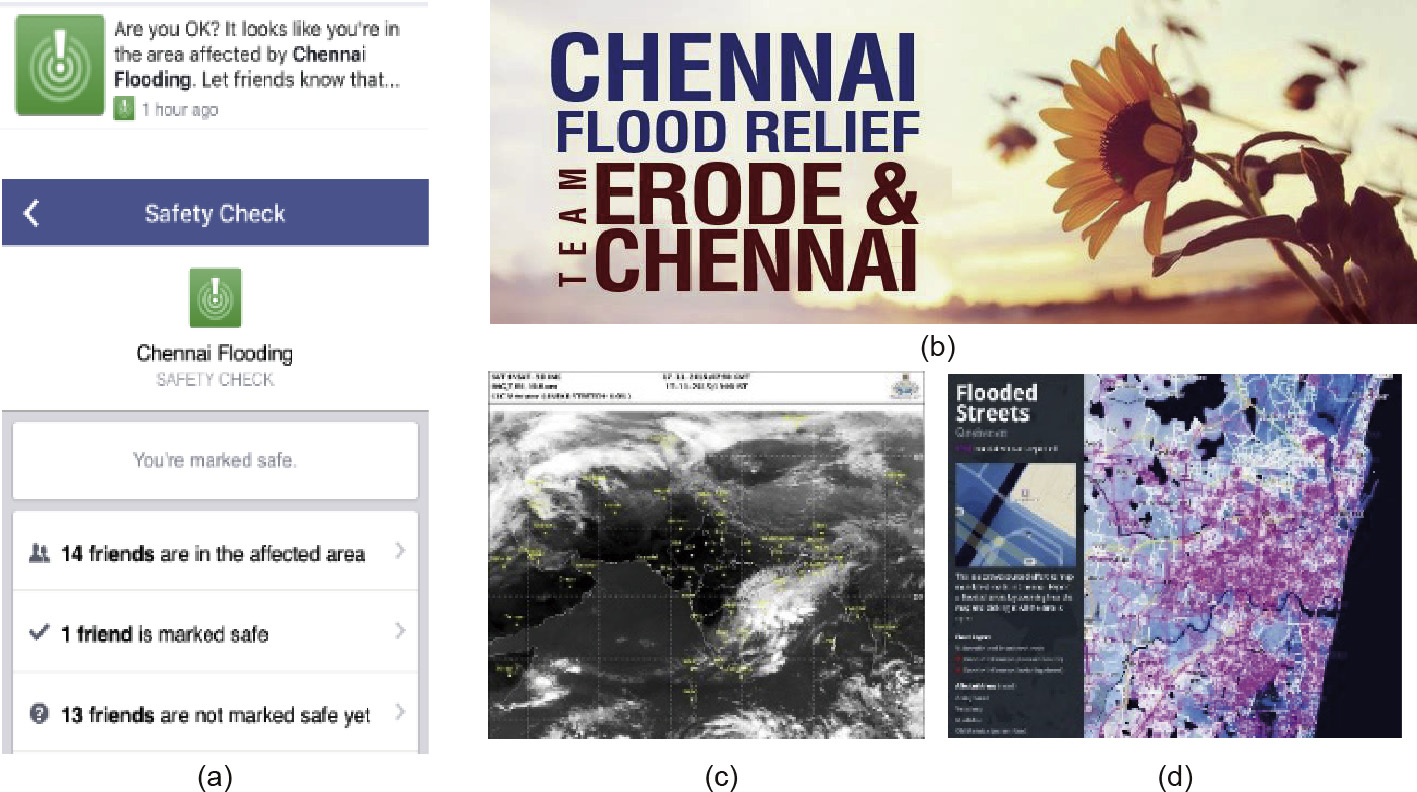
Fig.2.The role of social media in the 2015 Chennai floods[26].Pictures show(a)a tweet sent out during the flood,(b)private label used by flood rescue volunteers, (c)weather map showing the torrential rain,and(d)flood areas.
《Fig. 3》
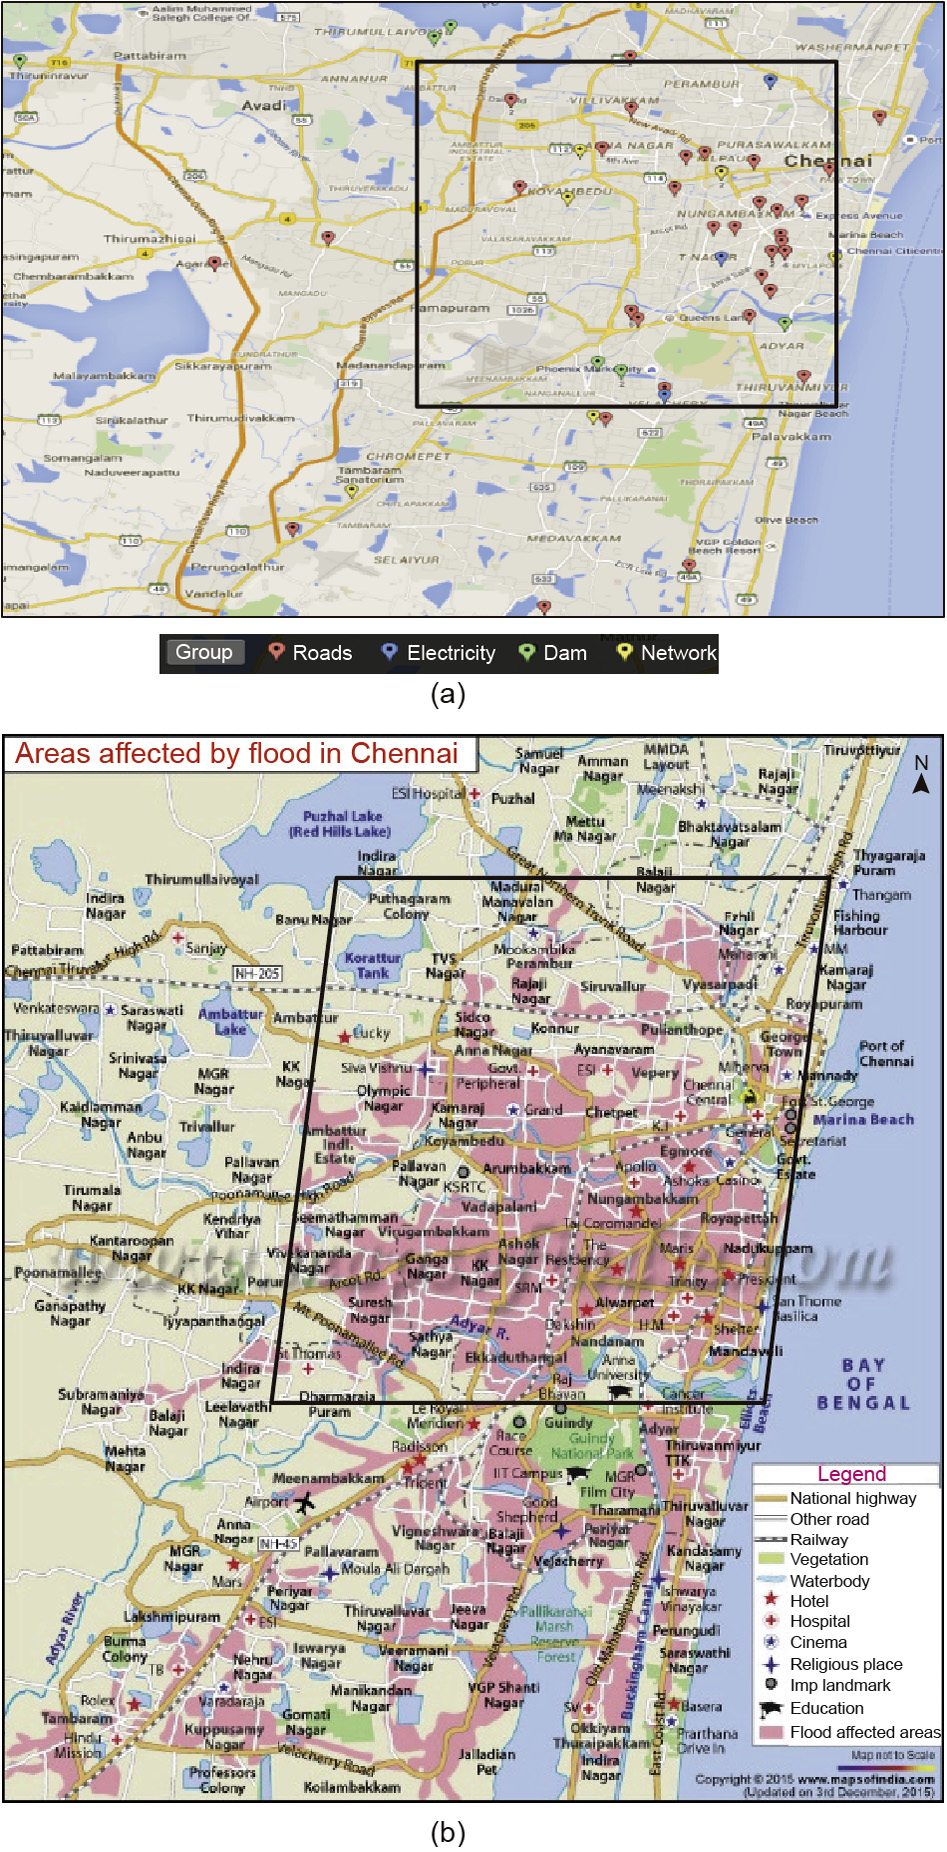
Fig.3.(a)Aerial mapping of tweets and(b)Aerial mapping of the flood.
《Fig. 4》
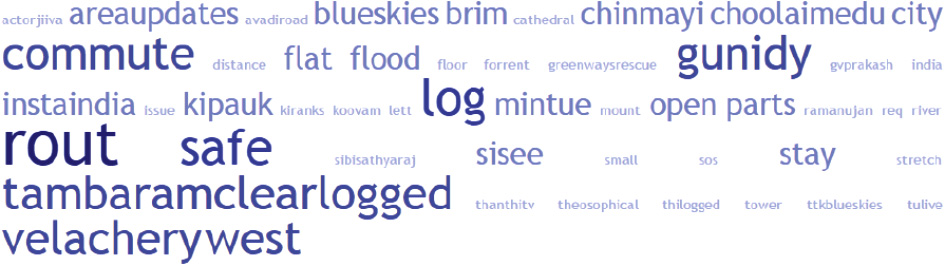
Fig.4.A tag cloud for the frequently used words on road issues.
《6.Preliminary analysis》
6.Preliminary analysis
《6.1.Time and location impacts due to lack of power:Limitations》
6.1.Time and location impacts due to lack of power:Limitations
Over 70% of the tweets were sent from Chennai’s city center. The locations shown in Fig. 3(a) identify the locations of the cellphone towers where the tweets were received and then sent. Thus, these are not the exact locations of the incidents or of where the tweets were sent. The exact locations of the incidents and the infrastructure related to the incidents had to be estimated from the words used in the tweets. For example, tweets about the breach of the local dam were mostly sent from cellphone towers that were over 20 km from the dam. The exact locations had to be derived from both the geotags and the words used in the tweets. The geospatial metadata did not contain sufficient information on the locations, the incidents, or issues with regard to the locations.
《6.2.Impacts due to power shortages and locational resiliency》
6.2.Impacts due to power shortages and locational resiliency
Power was unavailable in some parts of Chennai; as a result, some of the cellphone towers were not operational. Cellphone signals were picked up from the other operating cellphone towers, so the towers that were still operational sent out the signals from the tweets instead. Although this situation complicated the process of identifying the exact locations where the tweets were sent, it offers insights into the operations of cellphone towers and power supply at different locations. The locations where cellphone towers were still in operation were more resilient to flooding than the locations where cellphone towers were down.
《6.3.Time delays》
6.3.Time delays
During the flood, the transmissions of tweets were always delayed. When too much information reaches a cellphone tower, the processing time of the information and signals will increase. Many Twitter users had to wait for power to return, charge their phones, or search for cellphone signals; thus, their tweets were always delayed. As many as 95% of the tweets were delayed as a result, so the exact timings of the tweets were unknown. The delays were assumed to range from as low as a few seconds to as high as a day. Thus, time tags were not reliable information as they did not reflect the actual time when an incident or event happened.
《6.4.Locations,events,and issues—their density relationship》
6.4.Locations,events,and issues—their density relationship
Fig. 3(a) displays the locations from where the tweets were sent with regard to potential infrastructure-related events or incidents. The tweets were filtered using keywords related to the respective infrastructure issues taken from the text in the tweets. Fig. 3(a) shows that the tweets were mostly about the road conditions in the city center, and were mostly sent from within the city limit. Although many roads, powerlines, and houses outside of the city limits were also submerged in water (as shown in Fig. 3(b)), very few tweets reported on them.
Fig. 3(b) shows the areas affected by the flood. The box areas in Fig. 3(a) and (b) exhibit the rough city limit of Chennai. Over 70% of the tweets were sent out from the cellphone towers within the city limit. Comparing Fig. 3(a) with (b) shows that the cellphone towers affected by the flood were still in operation inside and outside of the city limit. From the map, we concluded that tweets were mostly sent from within the city limit due to the high population density where aid was urgently needed. Over 10% of the tweets were sent out from cellphone towers that were not affected by the flood in the north. The hardest-hit area was in the Ganga Nagar area, as the map confirmed. None of the cell towers in that area were operational, as there was no power supply in the area. We concluded the following from both maps: ① The locations where the cellphone towers were still in operation might be more resilient against flood than the locations where they were not in operation, ② Chennai’s city center might require more efforts to build resiliency than the areas outside of the city center, and ③ the demand for resilience is greater in areas with high population density than in areas with lower population density. The maps indicate that there were very few tweets in the less-populated areas than in the heavily populated areas, even when both densely and sparsely populated areas were affected by the flood.
《6.5 Time delays of tweets》
6.5 Time delays of tweets
Insufficient data were available on the tweets’ time delays. Through interviews with some local Chennai residents (contacts obtained through one of the investigators), we concluded that the delays ranged from a few seconds to a day. The interviews also revealed that excessive traffic on the cellphone towers, the need to locate cellphone signals, and waiting for power to return were the three main causes of tweet delays. However, we were unable to determine any relationships between locations, texts, and time tags.
《6.6 Text analytics》
6.6 Text analytics
The primary words or text used in the tweets with regard to infrastructure were compiled using TagCrowd. The analysis focused on keywords related to infrastructure (e.g., commute, route, and safe); for example, keywords related to road issues are shown in Fig. 4. The font of each word in Fig. 4 is directly proportional to the frequency of the word appearing in the tweets. The word ‘‘log” or ‘‘logged” was the most frequently used noun, and was used to refer to flooding or to being stuck in the flood in a local context (i.e., road logging, waterlog, or waterlogged). ‘‘Log” or ‘‘logging” can be used to describe the flooding situation in the local context.
In addition, the names of specific roads and towns were frequently used (i.e., proper nouns such as Kilpauk, Tambaram, and Velachery West). Many nouns were used before the names of the road or town to describe the failure or defect suffered by the road or town. However, the nouns used to describe the failure or defect were extremely diverse and did not reach the frequently used words list in Fig. 4. These nouns include words such as cracks, pops, holes, and lines. There were some conclusions that we found useful:
(1) The words used in the tweets reflect the conditions of both the infrastructure and the residents rather than the conditions of the infrastructure alone. For example, ‘‘flood” and ‘‘stretch” were frequently used together to reflect the conditions of the residents and the infrastructure at the same time—that is, how the stretch of flood affected both the roads and the residents, and not just the road conditions. Nouns were used to describe the failures found on the roads; however, the nouns were more useful to describe the situations of the residents, and only vaguely communicated the conditions of the roads. Even when the tweets were about road conditions, the words used did not accurately describe the road conditions in a way that was useful to the road engineers. Even though a bridge near Chinmayi Choolaimedu neighborhood was found to be structurally unsound, the words used to describe the bridge’s condition did not clearly indicate the structural unsoundness. The tweets did not mention the exact location of the unsound bridge, even though there were five bridges in the city and only one was unsound.
(2) The phrase ‘‘open parts” was frequently used in the tweets. We further analyzed the contexts and intentions of its use, and discovered that this phrase was used to describe different road conditions in different towns within the Chennai city limit. Some of the roads were described as having ‘‘open parts” even though they were structurally sound, whereas others described in this way were seriously damaged. We conclude from this analysis that the judgments of the tweets’ senders vary significantly. Although ‘‘open parts” indicates a potential road defect, the condition of the defect was not appropriately described by the words.
(3) We found no correlations between the frequently used words and the locations. However, there were correlations between the frequently used words and words used to describe the towns. We also found that some of the words that were used to describe the road conditions and the situations facing the residents correlated with one another. We conclude that more analyses and more powerful tools are needed to identify and acknowledge the lesser-used words that describe road conditions, and to understand the context of the vocabulary usage in Chennai and in India in general.
《7.Connecting social media data with resilience》
7.Connecting social media data with resilience
The preliminary analyses showed that social media data, including texts and geotags, offer the potential to determine the resilience of infrastructure and community. The results can be used to identify locations that are more resilient for cellphone towers and powerlines in the event of flooding. Such locations can also be used to locate critical infrastructure, like emergency storage, that require an increased level of resiliency. The text from the tweets offers additional information on the exact locations of affected areas, although more research is needed to improve the interpretation of words that are less frequently used, and of different words that may have the same meanings in the context of a certain culture. Such research should include:
(1) A comprehensive understanding of the regional cultures and languages regarding the relationships between vocabularies, the meanings of words, and the contexts with which words are used;
(2) An analytic approach for less frequently used words. While frequently used words provide extensive information on the locations of events and incidents, the less frequently used words provide more details about the events and incidents. The total number of times a word is used can only help to identify the location of the affected area, and thus of the non-resilient area. However, many other nouns were used to describe events, although they were not consistent due to the lack of knowledge of the particular issue. The study found that multiple words were used to describe the same defect. Thus, words that have parallel meanings and are used in the same context could be analyzed together; and
(3) Time tags are not useful information to understand resilience at this point, and further treatment of time tags is needed to make them more useful. Prior study showed that time tags could be used to determine the distances between the reporting locations of an issue, and thus might offer insight into the seriousness and exact location of the issue.
《8.Conclusions》
8.Conclusions
The purpose of this paper was to understand whether geotagging and text mining can serve as a platform for governments and private citizens to understand and model community and infrastructure resilience. This preliminary study highlighted the potential of both techniques: Geotagging identified the failure locations, and text mining refined the locations and suggested the types of failure. The analysis also highlighted the potential of using such techniques to understand the impacts of a flood on the regional environment and economy. Information on the power supply and road conditions was identified from tweets and hashtags. The study also concluded that research is needed to understand the use of the less frequently used words.
《Compliance with ethics guidelines》
Compliance with ethics guidelines
Wai K Chong, Hariharan Naganathan, Huan Liu, Samuel Ariaratnam, and Joonhoon Kim declare that they have no conflict of interest or financial conflicts to disclose.


 京公网安备 11010502051620号


