

《1.Introduction》
1.Introduction
If waste, exemplified here as urban waste↑, could be converted into a liquid fuel or a chemical product, then,in principle and in aggregate, it could displace a noticeable fraction of the petroleum now consumed in the world (Table 1) [1–3] .More significantly, it would transform a costly problem of disposal (from less than 20 to over 200 USD·t-1, depending on population density [4]) into a positive economic resource. The values in the table for the now-wasted resources represent their total enthalpy of combustion; their conversion to fuel would yield a significantly smaller (50%) energy stream.
↑The amount and production rates of waste are expressed here in terms of heating value to aid the comparison with petroleum use. The heating value of waste is highly variable, but the global average for the organic fraction of urban waste is 16 MJ·kg-1 compared with 40 MJ·kg-1 for petroleum. The global average mass throughputs of waste and petroleum are 440 kg and 620 kg per person per year, respectively. In 2016, the world population was about 7.3 billion.
《Table 1》
Table 1 Comparison of the heating value of petroleum products consumed and urban waste materials generated, on average, per person per year consumed and generated per year.

Epetroleum is the heating value of the consumed, refined petroleum products [1]; Ewaste is the heating value of the organic, paper, and plastic components of urban waste [2,3]
The recoverable heating value would likely be less than the total heating value owing to parasitic process demands and product selection. The value cited above represents complete conversion as an upper limit,as has been used in estimates by others [5].
However, three major technoeconomic considerations impede the conversion of waste into a more valuable product: the heterogeneity of the material,its geographic dispersion, and its local scale.
For example, urban waste consists of a heterogeneous mixture of materials, only some of which might be converted into carbon-containing fuels or chemicals [6]. The amount and composition of urban waste varies significantly with local income and region [2].
The material is widely dispersed and is generated in each locale at a rate that is small compared with the scale of petroleum refining and chemical manufacturing (Table 2) [2,3,5,7–12]. For reference, consider that there are only about 500 petroleum refineries in the world[7], whereas the number of conventional waste-treatment facilities is likely comparable to the number of municipalities. The latter quantity is difficult to estimate because the term "municipality”is not used consistently across the world. As a surrogate,consider that in this set of upper income countries—Australia, Canada, France, the United Kingdom, and the United States—there are municipal wastewater-treatment plants serving populations that range in size from 4000 to about 50 000 people. For example, in the United States, the population of 325 million is served by about 15000 wastewater-treatment plants, so the average plant serves a community of about 22000 people. Plants serving populations of a million people exist. Here,we seek to estimate the number of facilities that might host waste-to-energy convertors. If the lowest density of the wastewater-treatment plants (1 plant per 50000 people) is applied to other waste depots, then there would be more than 100000 sites around the world (7.3 billion people/50000 people served per site).
《Table 2》
Table 2 Comparison of the scale of the annual production of petroleum with energy that might be produced from the conversion of various waste streams.

a Calculated from production rates collated by the World Bank [2] and heating values estimated in Ref. [3].
b Calculated from estimates of production rates by pigs [8], dairy cows [9], and beef cows [8], and heating values estimated in Ref. [10].
c World Bank’s estimate of flaring [11] and a heating value for natural gas of 37 MJ·m-3 [12].
d Site capacities are typical for the United States [5].
e 150 000 barrels per day (bpd) is the average capacity the world’s oil refineries calculated from data provided in Ref. [7]; the heating value of 1 bbl (1 bbl =158.9873 L) of oil is 6.1 GJ, 127 kg.
Moreover, as shown in Table 2, the amount of material that might be converted at each site is large enough to be bothersome (i.e.,tons to kilotons per day) but small enough to require technology that will be unlike that used in the industrial refining of petroleum or the manufacture of chemicals.
An engineering solution to the valorization of waste will require a robust technology that can be practiced economically and,of course, in a safe and environmentally friendly manner,in remote locations near to the source of the feedstock. Those constraints could be satisfied with operating conditions close to ambient temperature and pressure , implying that intensified unit operations, particularly those that do not rely merely on thermal activation, would be preferred. The large number of possible sites motivates the consideration of a modular, manufacturable design rather than a site-specific, stick-built architecture characteristic of traditional refining and chemical plants.
《2.Notional process design》
2.Notional process design
The core of a waste-to-fuel or-chemical facility would include an omnivorous front end, upgrading stage(s), and separations. Experience at Pacific Northwest National Laboratory (PNNL) suggests that hydrothermal liquefaction (HTL) can transform a wide range of carbon/ hydrogen / oxygen (C/H/O)-containing streams (e.g., algae[13], sewage sludge[14], or wood pulp[15])into a bio-oil that is more thermally stable and has significantly higher heating value than bio-oil produced by pyrolysis[15–17]. We have demonstrated [18] a modular, pilot-scale system whose throughput corresponds roughly to 10% of the lower range of throughputs presented in Table 2, as shown in Fig. 1. The photograph shows from left to right, modules for preparing and handling the feed, HTL (beneath the yellow hoods), and recovery of the bio-oil. This system can produce about 16 L h-1(2.4 bbl d-1) from organic sludge.
《Fig.1》

Fig.1.A skid-mountable HTL unit developed at PNNL.The carboy pictured at front right has a volume of about 1 m3.
Because the hydrothermally liquefied intermediate is dispersed in an electrically conductive polar medium (water, alcohols plus dissolved salts), it is natural to consider electrochemically activated processes to hydrogenate the bio-oil and to electrolytically condense the plentiful carboxylic acids produced by the hydrolysis of the carbon–carbon (CAC) bonds in the feed. Hydrogenations of the components of bio-oil (Fig. 2) have been demonstrated[19–22]. Electrochemical condensation reactions are well known from classical organic chemistry[23].
《Fig.2》

Fig.2.Examples of hydrogenations encountered in upgrading bio-oil. The highlighted entries represent electrochemical reductions that we have performed at PNNL.
The separation of nonpolar products (e.g.,hydrocarbons) from a polar, possibly surfactant-laden aqueous stream should be possible, but because we have not yet investigated it, it is represented only notionally on a hypothetical process flow diagram (Fig. 3). We have identified several classes of technical challenges that could impede the introduction of such technology (Table 3).
《Fig.3》

Fig.3.Hypothetical process flow diagram for converting waste into valorized products. The electrochemical upgrader,which would best operate in flow, not batch,is highlighted to emphasize that it represents the most significant gap in our base science and the process design.
《Table 3》
Table 3 Technical impediments to implementation of a waste-conversion process

The third challenge in the table regarding water cleanup will be discussed in Section 4.
Electrochemically activated conversions enable process intensification: They can afford rates of conversion that satisfy Weisz’s window of realistic rates[24], namely on the order of 1 mol (m3 ·s)-1 even at ambient conditions, because small, readily applied potentials, say 0.1 V,correspond to an energy field that would be obtained in a thermal bath at a temperature about 1000 K higher.
For reactions that are electrochemically activated:

where Re is the rate of the electrochemically activated reaction, Re,ref is the rate of a reference electrochemically activated reaction, Dg is the difference in overpotential for the two reactions, F is the Faraday constant, R is the gas constant, and T is temperature. At a low operating temperature of, say,350 K for a two-electron process, a 0.1 V change in the applied overpotential, g, from that of a reference state raises the reaction rate by a factor of about 800.
For reactions that are thermally activated, with an apparent Arrhenius activation energy, Ea:

where Rt is the rate of the thermally activated reaction, Rt,ref is the rate of a reference thermally activated reaction, Ea is the apparent Arrhenius activation energy, and Tref and T are the temperature at which the reference and desired reaction take place, respectively.
If Ea and Tref are representative of a catalyzed hydrodeoxygenation at, say, 50 kJ·mol-1 and 300°C[25], then the temperature required to achieve a rate constant that is 800 times greater is about 1580 K, or 1000 K higher.
Moreover, as will be discussed below, a reticulated semi-structured electrode,such as a carbon felt, performs as a static mixer, effecting high rates of mass transfer even in creeping flow.
《3.Extrapolating to flow electrochemistry》
3.Extrapolating to flow electrochemistry
Although much of the past and current research in electrochemistry uses batch reactors, these would be cumbersome to employ even at the throughputs corresponding to the lowest entries presented in Table 2. Therefore,in designing the hypothesized process ,we have assumed that the electrochemical upgrading—indeed, all the unit operations—would be continuous.
In our current work,we use flow electrolysis cells that derive from previous experience with redox flow batteries. The cells are sometimes said to have a "filter press”architecture (Fig. 4) because the anode,electrolyte membrane, cathode, flow distributors, and current collectors are stacked between thrust plates.
《Fig.4》
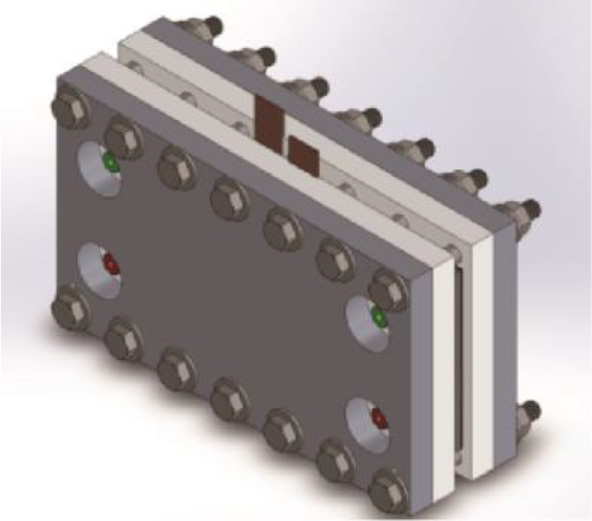
Fig.4.Rendering of a flow electrolysis cell that is being scaled up at PNNL for upgrading bio-oil produced from waste.
The electrodes, both the cathode and anode, consist of nanometersized metal particles supported at loadings of 5–10 wt% on a conducting graphite felt that was calcined in dilute air to make it wetted by water. In our preliminary experiments, we used an electrode devised from a direct methanol fuel cell for the anode (Ru on carbon paper) , and we focused on the reduction (cathodic) reactions. The course of the reduction process depends on the substrate and the choice of metal: Aromatic aldehydes (e.g.,benzaldehyde) reduce easily on Pt group metals; however,because those metals favor hydrogen atom transfer, the faradaic efficiency of the process suffers (i.e.,the hydrogen that is generated can transfer to the substrate or just bubble away). We are still in the process of devising correlations for the activities of the redox metals and their interactions with a wide range of substrates (i.e.,aromatic aldehydes, aliphatic aldehydes, sugars, and aromatic oxygenates such as phenol, acetophenone,and others that are found in bio-oils). Promising results have been reported from our laboratory for model compounds and for actual bio-oil[26,27].
In parallel to this work, we are characterizing the flow reactor itself to ensure that the catalyst we employ will be used effectively. For example,we have demonstrated by flow visualization in a win-dowed cell (Fig. 5) that even at creeping flow (Re 10), the flow profile through the reactor is plug-like.
《Fig.5》
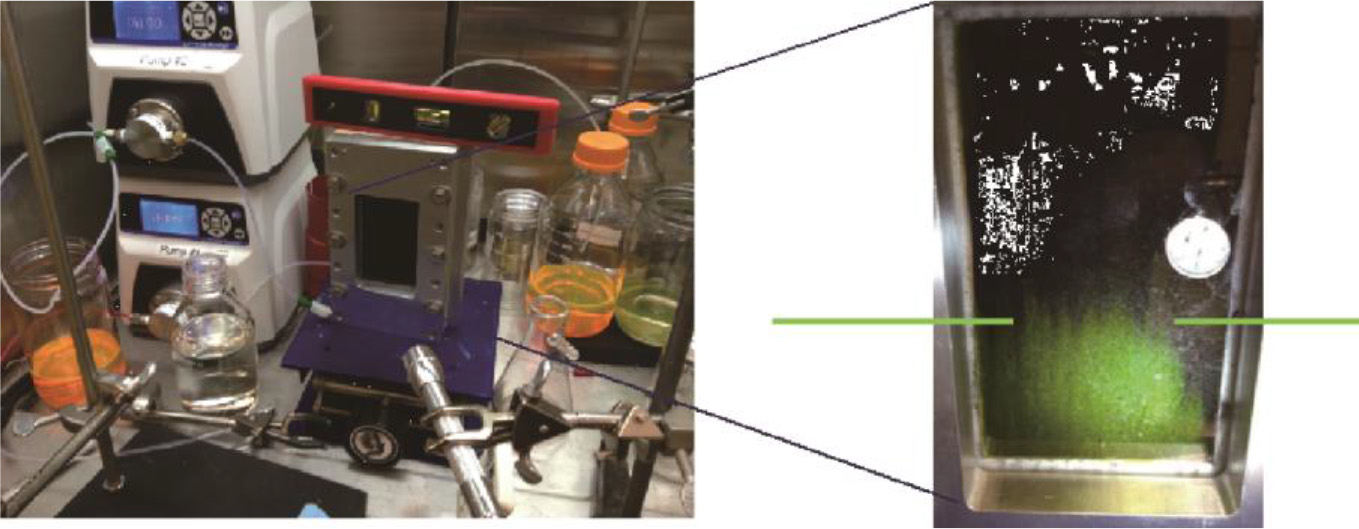
Fig.5.Visualization using Rhodamine G of the flow through a windowed electrolysis cell. The nearly flat front as the dye proceeds upward, indicated by the horizontal bars,looks like plug flow(i.e.,flat, not a parabolic profile), despite the very small Reynolds number(10).
We are in the process of measuring the effective mass transfer rates to determine whether the observed rates of conversion represent the intrinsic reaction kinetics or, rather, the rates of transport to/from the electrode surfaces. Preliminary analysis suggests that the rate of mass transfer varies with flow rate as expected[28]:

where Sh is the Sherwood number (ratio of rates of mass transfer to diffusion), Re is the Reynolds number (ratio of viscous to inertial forces), Sc is the Schmidt number (ratio of momentum and mass diffusivities), Le is the aspect ratio of the flow channel,and k 0.3. For the operating conditions we have employed, where 100% conversion corresponds to a conversion rate of 0.3 mmol s-1, this analysis implies that the design of our reactors allows them to operate in a kinetically limited regime ; that is, the rate of reaction is less than the rate of transport (Table 4) [28–30].
《Table 4》
Table 4 Operating conditions for a filter press-style flow electrolysis cell, indicating operation in a kinetically limited regime.

《4.Coupling reduction and oxidation》
4.Coupling reduction and oxidation
The aqueous phase produced during HTL contains many compounds (Fig. 6) that can, in principle, be oxidized in the anode compartment of the flow electrolysis cell. Therefore, by directing the wastewater into the anode compartment and the bio-oil feed into the cathode compartment(Fig. 7), the flow electrolysis cell could simultaneously remediate the wastewater while upgrading the bio-oil. This configuration could succeed in "preventing a waste and turning it to profit,”as envisioned a century ago by one of the founders of the discipline of chemical engineering in the United States[31].
《Fig.6》
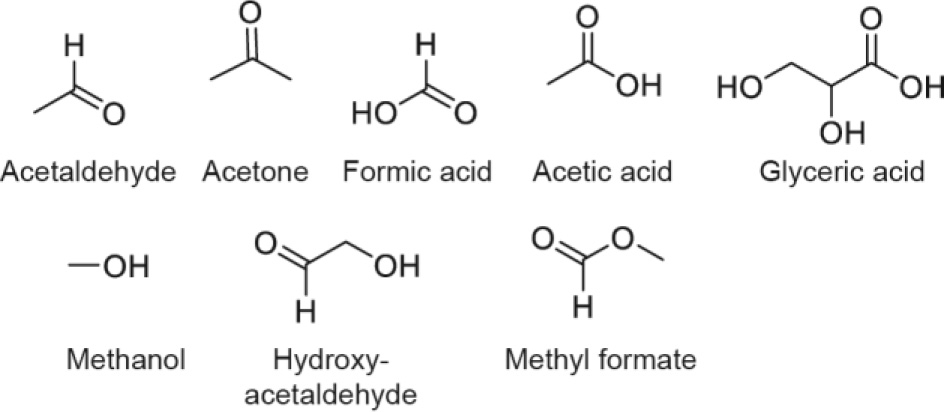
Fig. 6. Compounds representative of those that report to the water phase during HTL of waste.
《Fig.7》

Fig. 7. Configuration of the electrolysis operation that both upgrades and remediates.
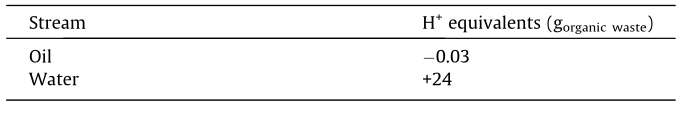
From our analysis of the hydrogen deficiency of the bio-oil and the chemical oxygen demand of the wastewater[14], we have determined that the stoichiometric ratio of oxidizable and reducible species (Table 5) could be more than sufficient to satisfy, and perhaps power,the upgrading reaction. That excess means that the electrochemical process could be net-electricity neutral and, perhaps, even an exporter of electrical power. However, the relative rates of the reactions at potentials that yield high overall conversion and selectivity have yet to be measured. Moreover, the detailed operation of the facility with respect to importing or exporting electrical power will require an optimization based on the costs of the inputs and the value of all the products, which are likely to be place and time-dependent.
《Table 5》
Table 5 Stoichiometry of upgrading HTL bio-oil from wastewater treatment sludge (at a conversion rate of 0.4 kg oil per kilogram sludge).
《5.Preliminary estimate of capital costs》
5.Preliminary estimate of capital costs
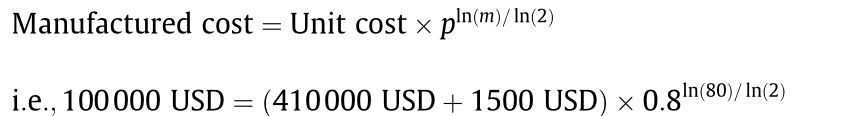
We expect that the technology overviewed here could achieve significant market penetration if it could be sold at a price of around 100000 USD ( bbl·d)-1 of capacity. That level of capital expense is low enough such that it could be paid back quickly (about three years if the products were sold at 50 USD·bbl-1 and if a credit of 50 USD·t-1 could be claimed for avoiding the waste disposal fee). The internal rate of return for that scenario would be 35% over a 10-year period.An equipment price of 100 000 USD (bbl·d)-1 is approximately the cost of a small hydrothermal reactor unit (100000 USD(bbl d)-1) plus an electrolyzer (1500 USD(bbl d)-1, see below) when manufactured in large quantities (m>80):
The capital expense of a hydrothermal reactor unit,which, inessence, is a pump, a heated tube,and a hot filter, albeit constructed from corrosion-resistant alloys (Fig. 3), is about 410000 USD(bbl ·d)-1[14] when extrapolated to 1 bbl ·d-1 using a power-law extrapolation (n=0.7) for the first plant.
We have based a preliminary estimate of the capital expense ofthe electrochemical upgrader on PNNL’s detailed estimate[32] for the hardware cost (Fig. 8) of a flow electrolyzer, namely,300 USD ·kW-1.
《Fig.8》

Fig. 8. Fractional costs of the hardware of a flow electrolyzer. PCS: power control system; PVC: polyvinyl chloride.
The electrolyzer would have to pass a current, I,corresponding to the stoichiometry given in Table 5:
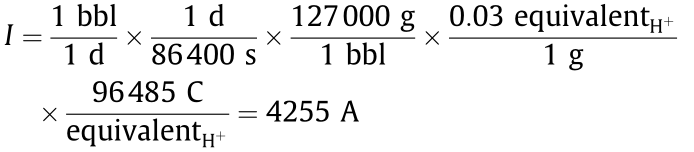
At a cell potential of 1 V (comparable to what we typically use to perform the reductions shown in Fig. 2), the power draw would be 4.2 kW. Therefore,the cost of the electrolyzer would be about 1500 USD(300 USD ·kW-1 4.3 kW). A learning rate, p=80%, consistent with mass manufacturing,lowers the total capital expenditure (CapEx)cost to about 100 000 USD (bbl ·d)-1 when the number of units, m=80 units have been manufactured:
There would also be costs for preparation of the feed (i.e., separation, comminution)and product separation that would have to be covered in the capital budget.Still, 100000 USD (bbl ·d)-1 appears to be a reasonable first estimate.
It should be re-emphasized that the approach envisioned here would rely on numbering up, not scaling up, the unit operations. Therefore,we expect more benefit from economies of manufacture (learning)than from economies of scale.
《6.Summary》
6.Summary
Preliminary experience and the estimates described here offer the hope that waste-to-fuel and waste-to-chemicals processes are both technically and economically feasible. The technology is being refined in current research at PNNL to develop the catalysts and the separators required to implement waste-to-fuel and waste-to-chemicals processes at the scale and in the remote locations associated with the envisaged feed stocks. We have also investigated the economics of numbering up versus the more traditional scaling up in order to address the size of the global accumulation rates of waste. That analysis will appear soon in the reports from a series of workshops sponsored by the US Department of Energy and held in 2015–2016[33,34].
《Acknowledgements》
Acknowledgements
This research was supported by the Laboratory Directed Research & Development program at Pacific Northwest National Laboratory (PNNL). PNNL is operated by Battelle for the US Department of Energy under contract DE-AC05-76RL01830.
《Compliance with ethics guidelines》
Compliance with ethics guidelines
Robert S.Weber and Johnathan E.Holladay declare that they have no conflict of interest or financial conflicts to disclose.


 京公网安备 11010502051620号


