

《1.Introduction》
1.Introduction
Superior materials for gas storage have become increasingly sought after, and porous materials offer attractive solutions for storage applications such as carbon capture and sequestration or methane (CH4) and hydrogen (H2) storage for energy use. Nanoporous materials such as ordered carbons and metal–organic frameworks (MOFs), among others, have been broadly evaluated for the storage of gases such as carbon dioxide(CO2) ,CH4, and H2 because of their large pore volumes and high surface areas. The structure of these nanoporous materials must be fully characterized in order to correlate favorable structural features to gas storage performance. Structural characterization includes methods such as X-ray diffraction (XRD), nuclear magnetic resonance (NMR), and scanning electron microscopy (SEM); however, gas sorption is perhaps most suited to this task because it evaluates the entire micropore and mesopore range in the bulk material (see Refs.[1–5]).
The International Union of Pure and Applied Chemistry (IUPAC) recently published updated recommendations regarding physical adsorption characterization, including the classification of isotherms [1]. The IUPAC isotherm classifications, which provide initial guidance on how to interpret adsorption isotherms for the purpose of structural characterization, are shown in Fig.1 [1]. To summarize:Microporous materials lead to Type I isotherms; non porous or macroporous adsorbents yield Type II isotherms; Type III and Type V isotherms represent cases in which there is no identifiable multilayer formation,meaning that there are relatively weak adsorbent–adsorbate interactions; mesoporous materials give Type IV isotherms;and Type VI isotherms represent layerby layer adsorption on a smooth nonporous surface. Proper choice of the adsorptive, coupled with stateoftheart pore size calcula tions based on statistical mechanics such as molecular simulation or density functional theory (DFT), makes it possible to accurately evaluate the pore size distribution within the material. Advanced analyses of the isotherm hysteresis also make it possible to gain information about the pore shape and connectivity of the porous network,which is important for both storage and transport prop erties. In addition, gas sorption techniques of both subcritical and supercritical gases, utilizing both low and highpressure measure ments, are capable of directly assessing the amount of gas that can be stored in a nanoporous material, as well as its potential for gas separations [6].
《Fig.1》
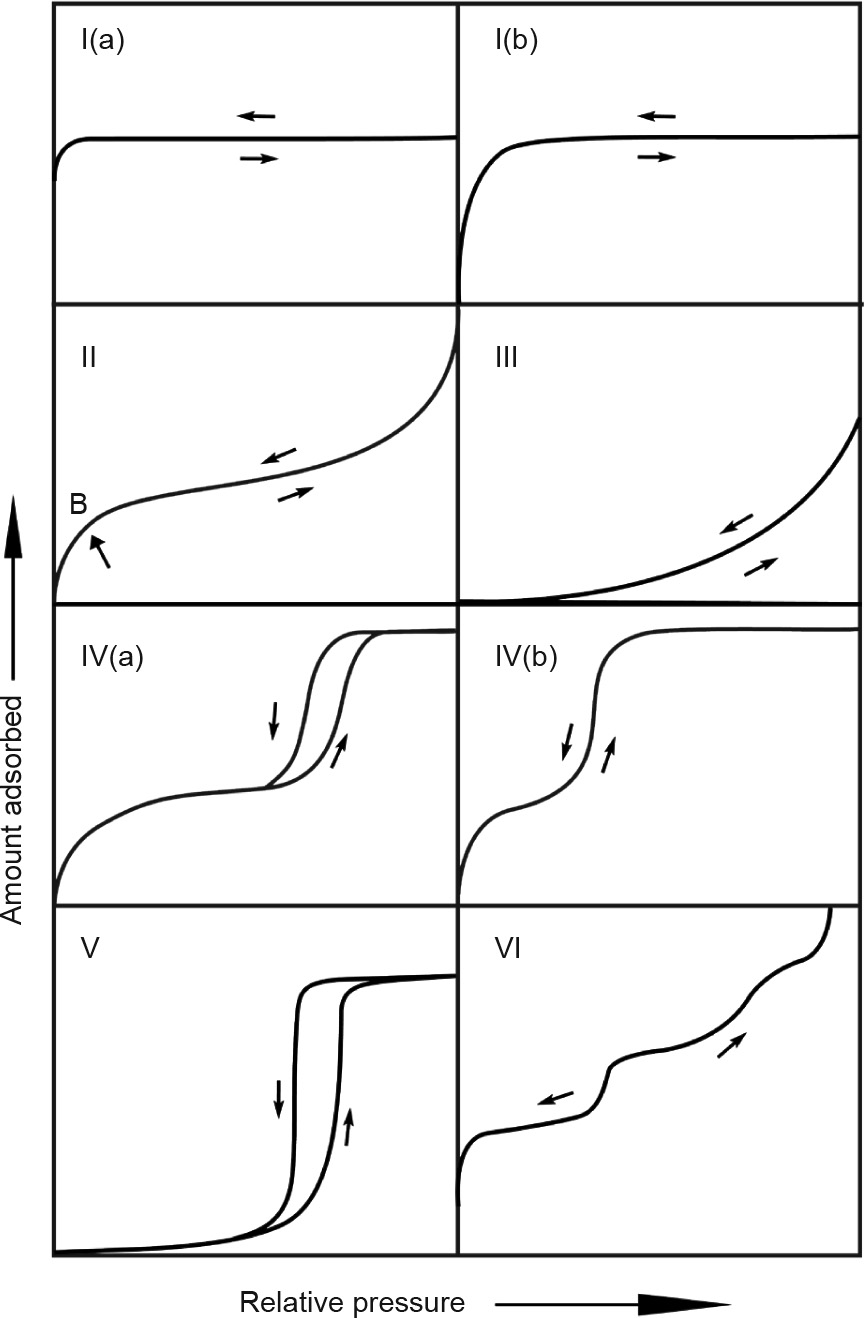
Fig.1. Classification of physisorption isotherms [1]. B represents monolayer formation. (Reproduced with permission © IUPAC, De Gruyter, 2015)
In this short paper, we review some selected important aspects for a reliable characterization of nanoporous gas storage materials. We also discuss choosing the correct adsorptive for surface area and pore size characterization (in light of the recent IUPAC recom mendations for physical adsorption characterization [1] ) and pre sent recommended methods for pore size analysis. Some relevant examples of gas storage materials from the literature are high lighted . Finally, selected examples of the highpressure gas storage evaluation of nanoporous materials are presented.
《2.Choice of adsorptive》
2.Choice of adsorptive
For surface area and pore structure analysis, choosing the proper adsorptive is critical. Although nitrogen (N2) adsorption at 77 K was the accepted standard adsorptive for both micropore and mesopore size analysis for many years, it has been shown that nitrogen is not always appropriate for surface area and micropore size analysis. Nonpolar materials, and specifically non functionalized carbons, can be accurately analyzed using nitrogen at 77 K; however, specific interactions between the quadrupole moment of the nitrogen molecule and various surface functional groups and exposed ions that are present in materials such as MOFs or zeolites lead to inaccurate analyses. This affects both the orientation of the adsorbed nitrogen molecules and the micro pore filling pressure. Such specific interactions shift the porefilling pressure of nitrogen to very low relative pressures (a P/P0 equal to about 10-7) (e.g.,Refs. [1,2,7]); consequently, the porefilling pres sure is not correlated with micropore size. In contrast to the issues with nitrogen adsorption, argon (Ar) adsorption at 87 K (the boiling temperature of argon) does not display any specific interactions with surface functionality or uncertainty in orientation, and is the recommended choice by IUPAC for micropore characterization [1]. In addition to using liquid argon, a variety of commercially available cryostats and cryocoolers make it possible to control the experimental temperature at 87 K with high precision. Because argon (87 K) adsorption fills micropores in many cases at signifi cantly higher P/P0 than nitrogen, it is possible to reliably resolve small differences in micropore size [2–4,7,8]. One example of the difference between the N2 and Ar isotherms is shown for a micro porous copperbased MOF in Fig. 2 [7]. The semilogarithmic plot highlights the differences between the two isotherms in the lowpressure regime. Argon fills the micropores at higher relative pressures, whereas the microporefilling in the N2 isotherm shifts to a lower relative pressure due to the specific interactions between N2 and the polar MOF surface. It is interesting to note that the isotherms on this MOF indicate that the material undergoes a structural transition during argon adsorption, which, however, is less pronounced for nitrogen (77 K) adsorption. This is evidenced in the argon isotherm by the observed step and hysteresis loop at a P/P0 that is below the pressure range in which capillary condensation hysteresis occurs (capillary condensation hysteresis occurs for argon and nitrogen at their boiling temperatures at P/P0 ca.0.4). Hysteresis due to structure changes will be discussed in more detail in the last section of this review;however, it is necessary to be extremely cautious in the interpretation of adsorption data obtained on nonrigid materials (e.g., some MOF materials). Structural changes of the adsorbent lead to steps/ hysteresis in adsorption isotherms that cannot be analyzed with standard methods for surface area and pore size analysis and that may lead to serious artifacts. Novel theoretical approaches that make it possible to account for the nonrigid nature of the adsorbent are required here, and such methodologies are under development[9].
《Fig.2》
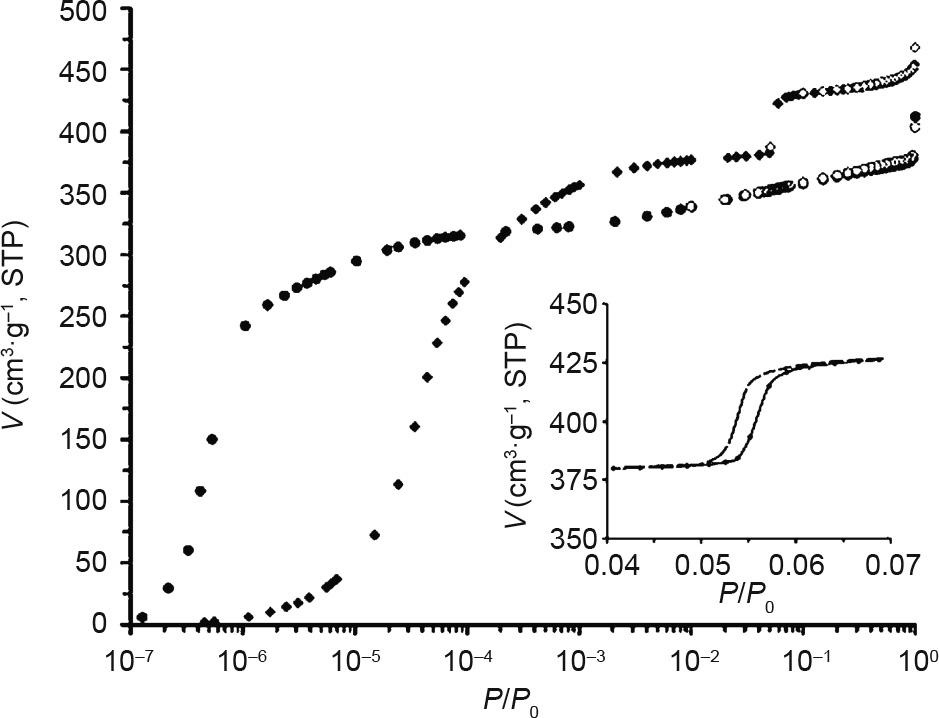
Fig.2.Semilogarithmic plot of N2 (77 K,circles) and Ar (87 K,diamonds) adsorption isotherms in a copperbased MOF [7]. V: volume adsorbed. (Reproduced with permission from Wiley)
Complementary to nitrogen (77 K )or argon (87 K) adsorption is CO2 adsorption at 273 K. Nitrogen and argon are prevented from entering the narrowest micropores (of width smaller than 0.45 nm) due to kinetic restrictions. These limitations can be overcome by using CO2 adsorption close to room temperature, at which the kinetics are more favorable, coupled with the slightly smaller kinetic diameter of CO2 as compared with nitrogen and argon, thus allowing access to the ultramicropores. For these reasons, CO2 is the standard adsorptive for the characterization of microporous carbons [1,5]. However,similar to nitrogen, CO2 has a quadrupole moment that affects the adsorption on microporous materials with polar functionality, such as MOFs, zeolites,and certain highly oxidic nanoporous carbons. It should be noted that from 273 K up to atmospheric pressure (i.e.,the maximum pressure in conventional adsorption equipment utilized for physisorption characterization), CO2 is restricted to the pore filling of pores that are narrower than about 1 nm because of the high saturation pressure (26 141 torr, 1 torr=133.322 Pa) and because the ambient pressure corresponds to a relative pressure of only approximately 10-2.
《3.Adsorption mechanism》
3.Adsorption mechanism
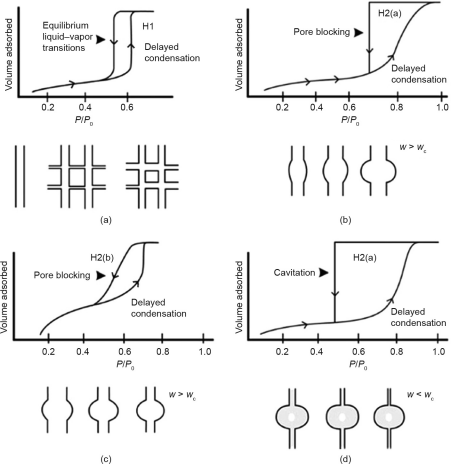
Before structural information can be obtained from gas adsorption data,it is important to understand the underlying mechanism of adsorption, which is correlated with the surface and pore structure and is reflected in the shape of the adsorption isotherm. The relative pressure at which pores of given width fill is dependent on many aspects, including the size and nature of the adsorptive, pore shape, and effective pore width. The filling of micropores is a continuous process that occurs at low relative pressures (P/P0<0.015). Micropores lead to Type I (a )and Type I (b) isotherms according to the 2015 IUPAC classifications [1]. Mesopores fill via a different mechanism—multilayer formation followed by capillary condensation, which leads to Type IV(a ) or Type IV(b) isotherms,depending on the size of the mesopores. In a Type IV (a) isotherm, capillary condensation in larger mesopores (>4 nm) leads to hysteresis,and there is a correlation between the shape of the observed hysteresis loop and the textural properties of the adsorbent [3,4]. In fact, IUPAC has also classified the different shapes of hysteresis loops [1]. Selected examples are shown in Fig. 3 [4]. Fig. 3 (a) shows the classical example of capillary condensation that is delayed due to the existence of metastable adsorption fluid in the adsorption branch,while evaporation occurs via equilibrium from an open pore [10–12]. This hysteresis is found primarily in ordered mesoporous materials with uniform cylindrical pore or ordered threedimensional pore networks.
In materials containing complex pore systems,such as ink bottleshaped pore networks,pore evaporation no longer occurs via equilibrium from an open pore, but is delayed—the wider pore body remains filled until a lower pressure is reached,when the neck evaporates,leading to Types H2(a) and H2(b) hysteresis, according to the IUPAC classification (Fig.3). Type H2(a) hysteresis (Fig.3(b)) occurs when the pore cavity size distribution is wide compared with the neck size distribution, leading to a steep desorption step in the isotherm. Type H2 (b) hysteresis (Fig.3(c)) occurs when the opposite is present: a narrow distribution of pore bodies with a wide neck size distribution.Fig.3(d)illustrates the case of desorption via cavitation.It has been shown that if the pore neck diameter is smaller than a certain critical size at a given temperature and adsorption, desorption occurs via cavitation—that is, spontaneous nucleation of a bubble in the pore causing the pore body to empty while the pore neck remains filled.For nitrogen (77 K) and argon (87K) adsorption,the critical neck width is 5–6 nm [13–15].
《Fig.3》

Fig.3. The different hysteresis loop shapes and how they are correlated to both pore network and adsorption mechanism [4].(a)Type H1 hysteresis; (b)Type H2 (a) hysteresis showing desorption pore blocking effects; (c) Type H2(b) hysteresis also showing desorption pore blocking effects; (d)Type H2 (a) hysteresis indicating cavitation in the desorption branch.The pore illustrations represent an example of the connectivity that would lead to each isotherm above it.w:neck width; wc: critical neck width. (Reproduced with permission from The Royal Society of Chemistry)
A full understanding of the observed hysteresis loop is necessary in order to differentiate between equilibrium evaporation/desorption,pore blocking, and cavitation.In the case of pore blocking or cavitation, care must be taken to choose the appropriate branch of the isotherm (adsorption) for the calculation of the pore size distribution, and a method must be chosen that takes into account the correct mechanism of adsorption. In addition, more advanced tools such as hysteresis scanning can assist with the elucidation of the pore connectivity of a material [16–19]. A comprehensive discussion of these tools and methods is given in a recent review article (see Ref. [4] and the references therein).
《4.Surface area》
4.Surface area
Surface area is an important parameter for optimizing materials for many applications, including gas storage. Despite documented limitations, the Brunauer–Emmett–Teller (BET) method is the most widely used method for the assessment of microporous and mesoporous adsorbents.The BET equation, when applied over the classical range of monolayer and starting multilayer formation (P/P0=0.05–0.3), is applicable for nonporous, macroporous, and mesoporous materials with pore width >4 nm (e.g.,isotherm Types II and IV according to the IUPAC classification, see Fig.1); however, the mechanism implied by the BET theory is not applicable to microporous materials. Because of this, the calculated area for microporecontaining adsorbents should be considered only a "BET area”(not identical with a reliable surface area ,i.e., the probeaccessible surface area), and strict criteria should be applied to determine the linear range for the BET calculation. These criteria are specified in the recent IUPAC recommendations [1]. Adherence to the criteria permits the comparison of BET areas among labs, but does not necessarily increase the accuracy of the determined BET area.
Choosing the appropriate adsorptive is also critical for surface area calculations. The crosssectional area of the adsorbate is an important parameter for the accuracy of the surface area calculation. Nitrogen (77 K) has been the traditional adsorptive for surface area measurements, and the widely accepted value for the crosssectional area (0.162 nm2) assumes that the nitrogen molecule is lying flat on the surface. In fact, it has been shown that functional groups that interact with the quadrupole moment of nitrogen lead to an orientation effect of the adsorbed nitrogen molecule. Because of this, the actual crosssectional area may be much smaller than the usually assumed value, adding a large uncertainty to the result:up to 20% for some surfaces [1]. Unlike nitrogen, argon does not exhibit specific interactions due to surface functional groups; being an atom, argon will always lie on the surface in the same manner, regardless of the polarity of the material, thus eliminating the uncertainty in the effective crosssectional area [20–23].
《5.Pore size》
5.Pore size
Traditional macroscopic thermodynamic methods for pore size calculation, such as the Dubinin and Saito–Foley (SF) methods for micropore analysis and the Barrett–Joyner–Halenda (BJH) method for mesopore analysis, are known to underesti mate the pore size by as much as 30% [1–3,7,8]. This is because these models do not accurately describe the state of the confined fluid in the pore. The problems associated with the traditional methods have been dealt with by applying microscopic methods that are based on molecular simulation, such as DFT. These methods give thermodynamic and density profiles of confined fluids in pores and are capable of describing the adsorbed phase accurately, to the molecular level. These stateoftheart methods take into account pore geometry and have been developed for a wide variety of materials such as silicas, carbons, zeolites, and so forth. DFT captures the mechanism of micropore filling and those of pore condensation, evaporation, and hysteresis in mesopores. Consequently, one DFT method can be employed to calculate a reliable pore size distribution over the complete micropore and mesopore range.
Nonlocal density functional theory (NLDFT), which was first reported in 1993 [24] and then further advanced [25,26], represented a significant improvement in the accuracy of the DFT method for pore size distributions. NLDFT methods make it possible to acquire accurate pore size information from both the adsorption and desorption branches of the hysteresis loop, which is critical for pore size characterization of complex pore networks, as discussed above. The mesopore size distribution can be obtained from the adsorption branch of the isotherm by taking into account the delay in condensation due to metastable pore fluid using a metastable adsorption branch DFT kernel [13,14], which is necessary for accurate analysis of isotherms containing Types H2(a) and H2(b) hysteresis loops,where the desorption branch no longer represents an equilibrium vapor–liquid phase transition. Methods for pore size analysis based on DFT are widely used; they are recommended in the 2015 IUPAC recommendations [1] and featured in international standards (e.g.,ISO 159013). These methods are commercially available for many essential adsorptive and adsorbent pairs [10].
It should be noted that while NLDFT methods dedicated to carbon and oxidic surfaces exist, the very specific surface properties of MOFs challenge the development of a characteristic MOF DFT ker nel. However, it has been shown that accurate pore size distribu tions may still be generated, as compared to classical methods, if the pore geometry of the DFT model matches the pore geometry of the experimental sample. An efficient method for selecting the most appropriate model is given in Ref. [27] and is further reviewed in Ref. [6].
One shortcoming of the NLDFT method for pore size characterization of carbons is that the solid surface is treated as chemically homogeneous and molecularly smooth. This leads to distinct layering steps in the theoretical adsorption isotherms, which are not observed experimentally, causing artifacts in the NLDFT pore size distributions at around 1 nm. Numerous approaches have been proposed to represent the surface heterogeneity, including the development of advanced structural models by Monte Carlo techniques, modeling the carbons with a mixed geometry model, or twodimensional DFT approaches [28–32]. In order to account for the effect of surface heterogene ity present in certain carbon materials, quenched solid density functional theory (QSDFT) has been developed, which includes a characteristic roughness parameter to represent the molecularlevel surface corrugations[3,8,33]. The QSDFT method,originally developed for slitshaped pores, has also been expanded to micromesoporous materials with cagelike or channellike geometries [34].
An example of QSDFT applied to chemically activated carbons developed for CO2 storage applications is shown in Fig.4 [35]. QSDFT pore size distributions were used to qualitatively correlate the pore structure of the carbon to the activation conditions of the material, and allowed to determine which pores controlled the CO2 filling capacity and selectivity—critical information to aid in the design of carbon sorbents for lowpressure capture and stor age of CO2 from flue gas [35].
《Fig.4》
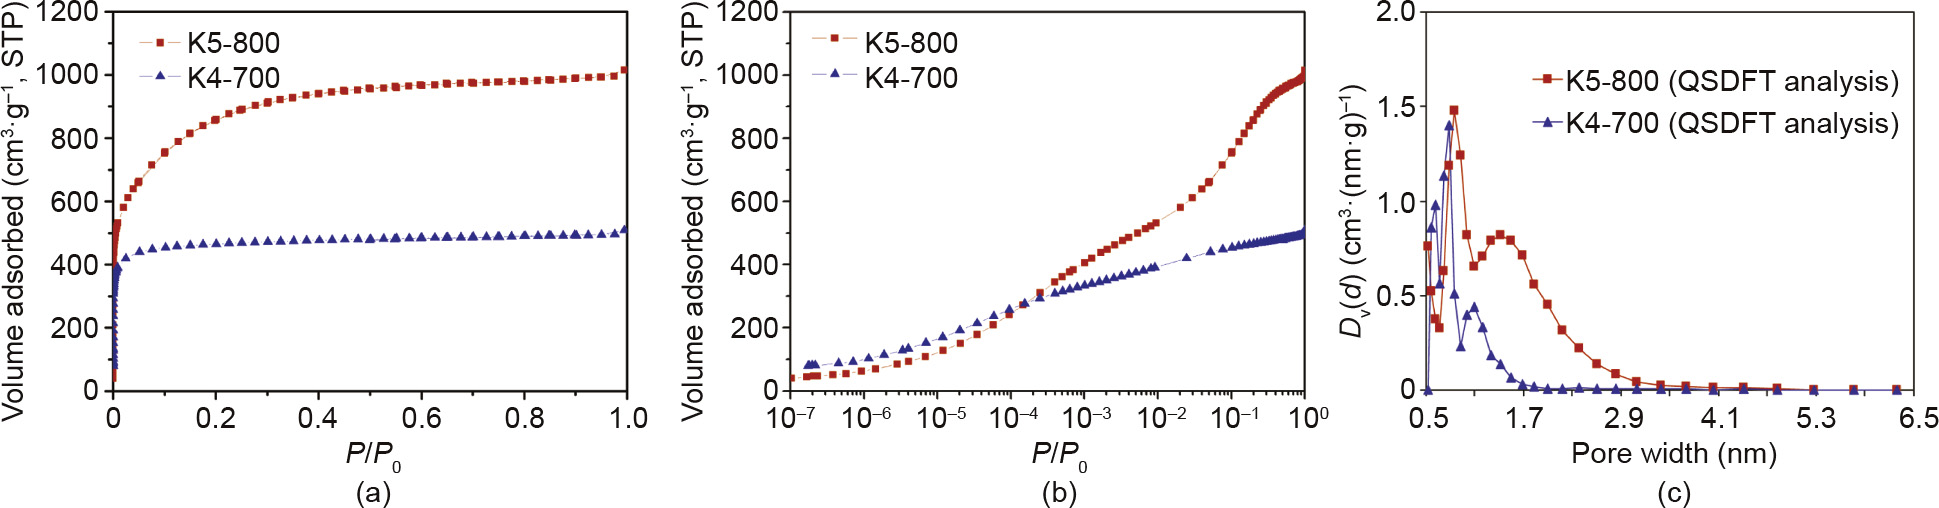
Fig.4.Highresolution N2 isotherms of carbons K5800 and K4700 shown on(a) a linear scale and (b)a semilogarithmic scale. (c) The corresponding pore size distribution Dv (d) from QSDFT analysis [35]. (Reproduced with permission from American Chemical Society)
《6.Highpressure gas sorption and gas storage evaluation》
6.Highpressure gas sorption and gas storage evaluation
In addition to the structural characterization (BET surface area, pore size, volume, connectivity, etc.), gas sorption can be used to directly assess the storage capacity of porous materials at the pres sure and temperature of the application for gases of interest such as CO2, CH4, and H2, among others. Highpressure adsorption intro duces additional complexities into the data interpretation because there is often confusion and/or inconsistent usage of the excess, total, and absolute adsorbed amounts. For low pressures (1 bar,1 bar=105 Pa), the surface excess and the absolute adsorbed amounts are identical; however, for highpressure gas adsorption measurements, the difference cannot be ignored [1]. Discussion on this topic and clear definitions were recently given in the aforementioned recent IUPAC report [1]a nd in the context of MOF char acterization (see Ref. [6] and the references therein). In summary, the surface excess adsorption is the amount that is directly measurable via adsorption,which can then be converted into the abso lute and total amount of gas adsorbed if the overall amount of gas stored in the pores is important.
CO2 and CH4 adsorption (nσ) up to high pressures was measured on microporous socMOF (Fig.5) at various temperatures as a study of this material’s potential for CO2/CH4 storage and separation [27]. Note that for all temperatures studied, CH4 is well above its critical temperature, while CO2 is subcritical for 273 and 298 K measurements. This difference in thermodynamic state is at least partially responsible for the larger CO2 adsorption capacity as com pared with CH4. From these data, it can be concluded that CO2/CH4 separation should be most efficient at pressures up to ca.3 bar for a temperature at which CO2 is subcritical. The effect of the thermo dynamic state of the bulk fluid on the adsorption uptake is also clearly shown in Fig.6 [27,36], which illustrates the adsorption of hydrogen in microporous socMOF at temperatures above and below the critical temperature(Tc) [36]. In fact, a Type I(a) isotherm is observed at the boiling temperature of hydrogen (20 K, T/Tc=0.61), indicating that, in contrast to H2 adsorption at 77 K(T/Tc=2.33), the entire pore space has been filled below 1 atm(1 atm=101 325 Pa) of pressure with a liquidlike phase.This also explains the significantly different uptakes of CH4 and H2 at 107 K (Fig.6) [27]; that is, CH4 (T/Tc=0.56) again reveals a Type I isotherm, indicating complete pore filling with liquidlike methane, in contrast to the supercritical H2 (T/Tc=3.24) adsorption isotherm.
《Fig.5》
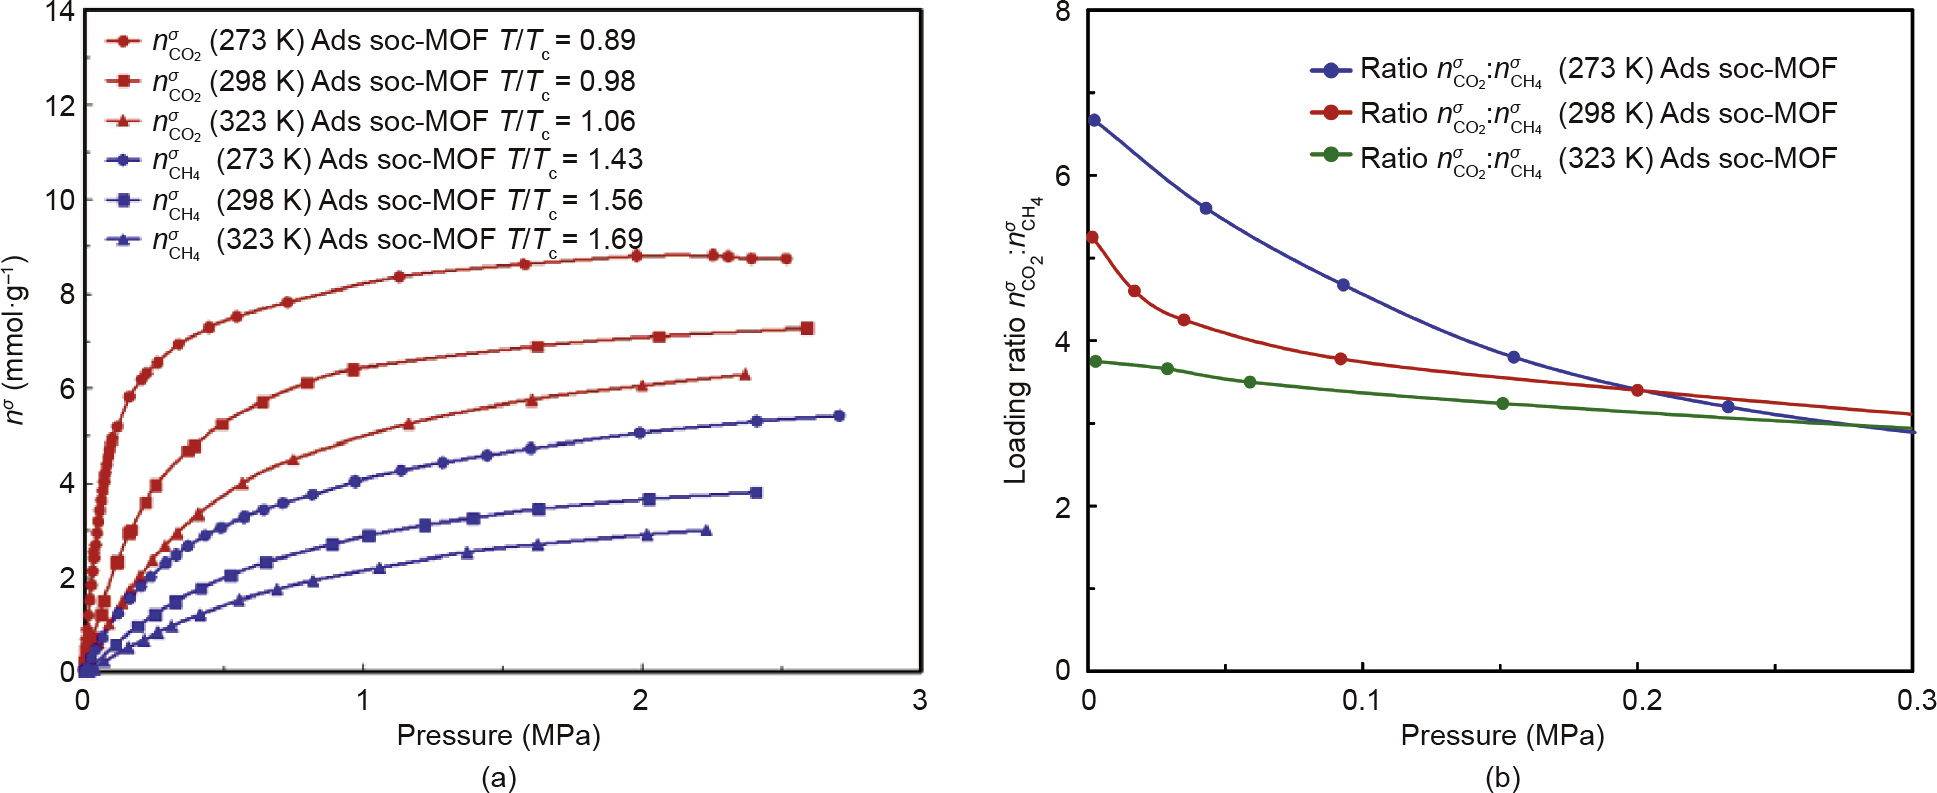
Fig.5. Comparison of(a) CO2 and CH4 adsorption and (b) their loading ratio at various temperatures on socMOF [27]. Ads: adsorption. (Reproduced with permission from Elsevier)
《Fig.6》
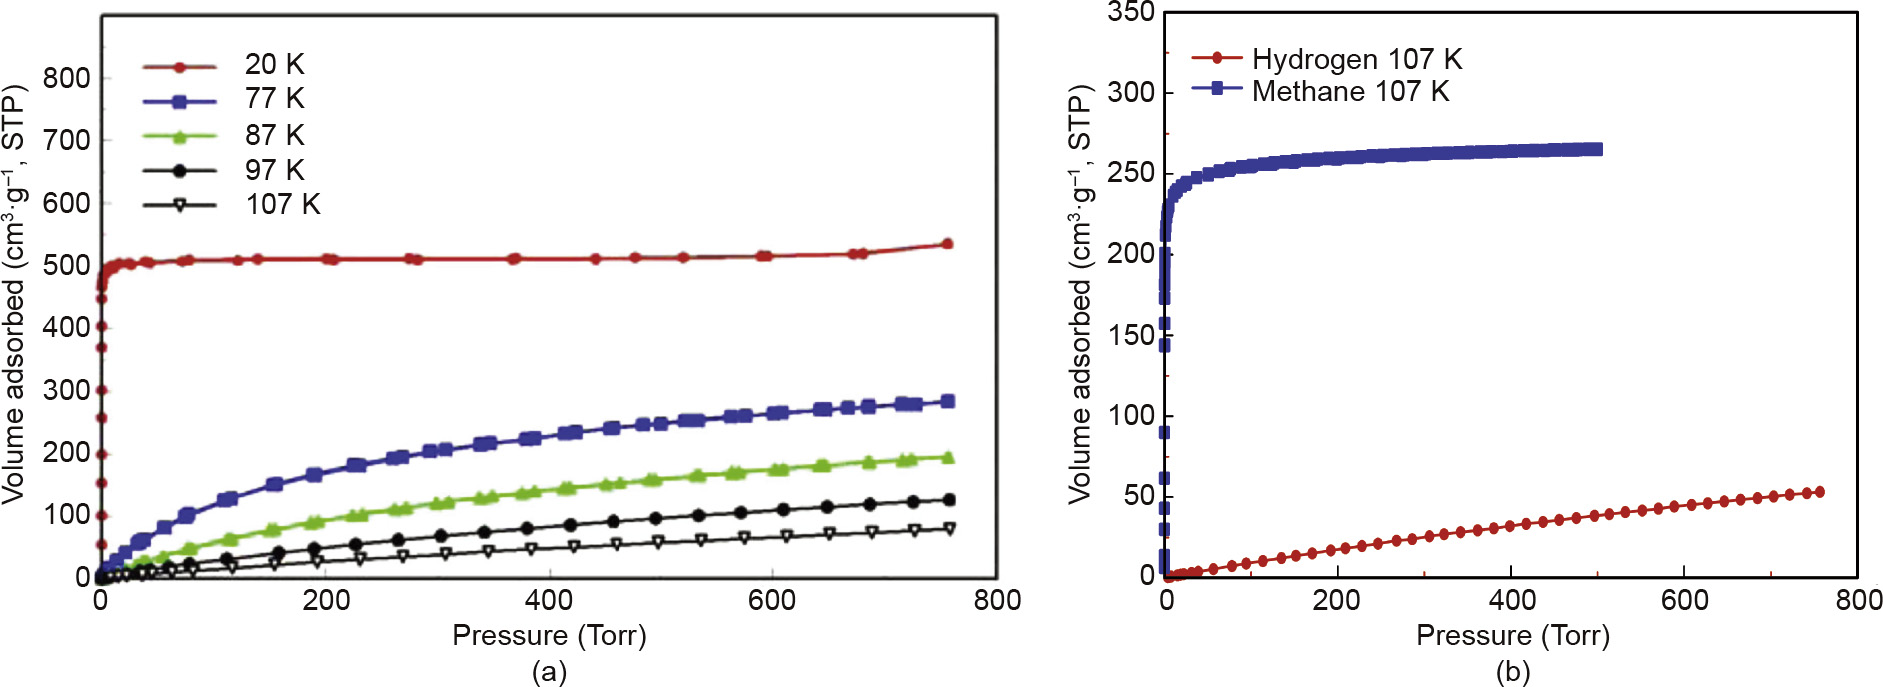
Fig.6. (a) Variabletemperature H2 adsorption data for FesocMOF collected in the range of 20–107 K [36] (reproduced with permission from American Chemical Society); (a) comparison of hydrogen and methane isotherms at 107 K [27] (reproduced with permission from Elsevier).
An ultramicroporous MOF, RPM3Zn, was recently studied for both H2 and CO2 storage applications [37]. The H2 and CO2 isotherms measured at various temperatures are shown in Fig.7 [37]. For this sample, hysteresis is observed in both the H2 and CO2 isotherms;however, the hysteresis here is of a completely different origin and is not associated with a mechanism that is char acteristic of capillary condensation into mesopores. In the case of this MOF, the H2 hysteresis, which is characteristic of nonclosing adsorption/desorption branches, is due to kinetic restrictions resulting from extremely narrow ultramicropores (effective pore width below 0.5 nm). In the case of hydrogen, this hysteresis disappears with increasing temperature(at 97 K), which makes it possible to obtain reliable heat of adsorption data from isotherms obtained in the range from 97 to 117 K [37]. The CO2 adsorption isotherms on this MOF were also measured across a wide range of temperatures and pressures, from below the triple point up to supercritical temperatures and pressures. The characteristic two step CO2 isotherms at temperatures below 234 K are associated with a distinct, closed hysteresis loop, which considerably differs from the open H2 hysteresis, and which is due in this case to a structural change of the MOF material (as confirmed by powder Xray diffraction, PXRD). It is interesting to note that the hysteresis narrows and eventually disappears at higher temperatures, leading to reversible CO2 isotherms at temperatures of 273 K and higher. This was essentially the first example reported in a MOF in which disappearance of hysteresis at a"critical temperature”was noted when a structural change (or phase transition) accompanied a gas adsorption process. The underlying mechanism of this interesting behavior is not fully understood at present, and more experimental and theoretical work is necessary; however, the shrinkage and disappearance of hysteresis may indicate that the nucleation barriers associated with the structural change of the MOF’s structure decrease with increasing temperature and finally disappear at a certain "critical temperature,” above which very small pressure variations can induce reversible structural changes of the framework. This "super flexibility”of the MOF framework might open up interesting opportunities in gasseparation applications.
《Fig.7》
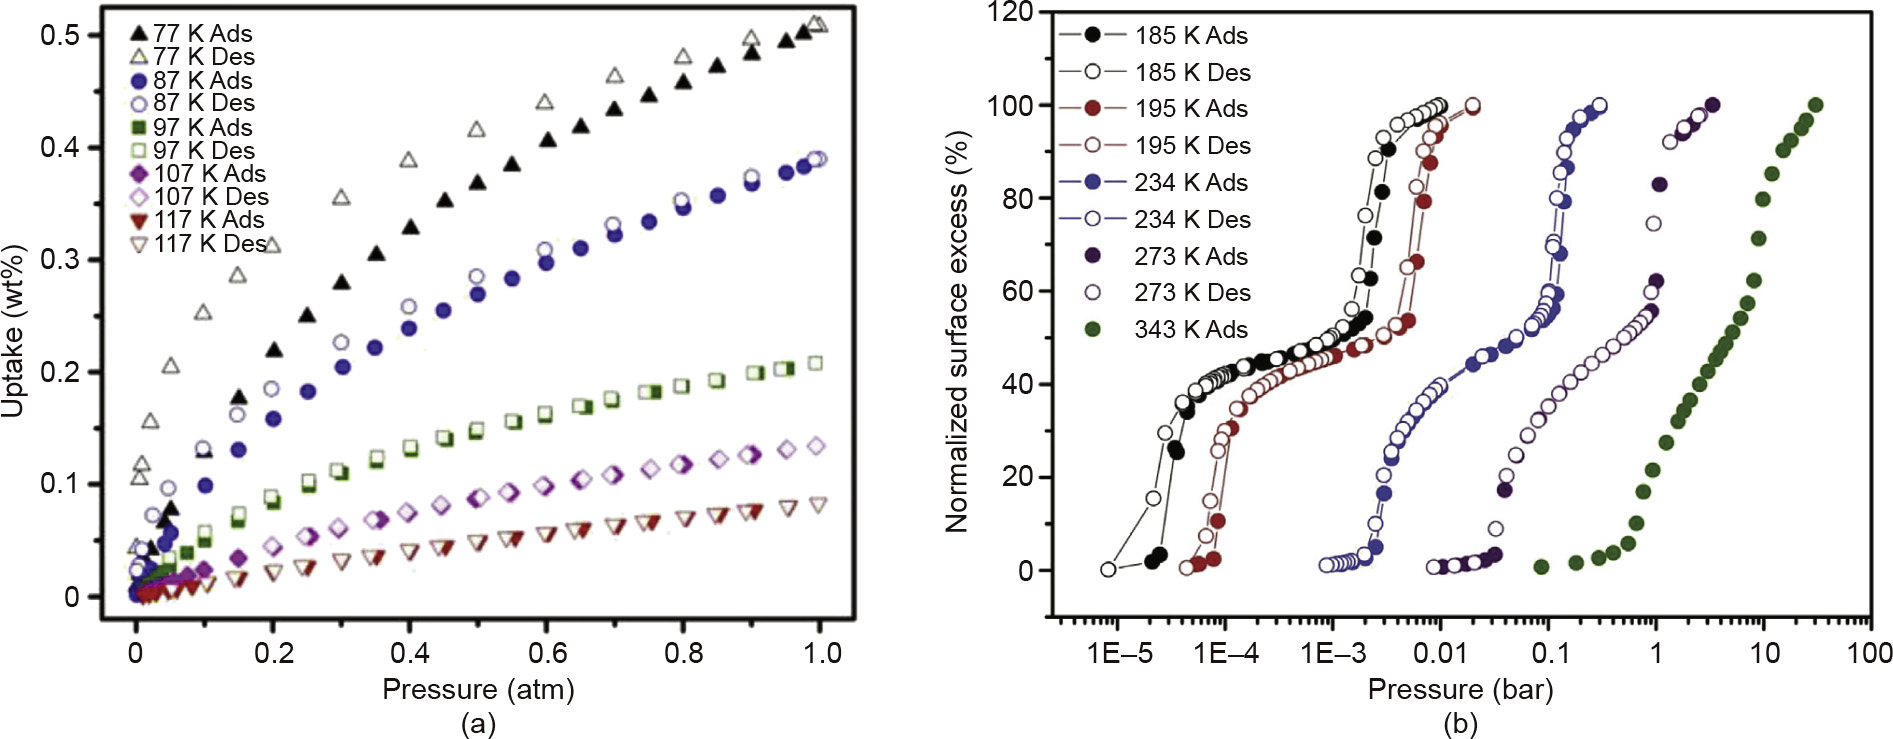
Fig.7. (a) H2 adsorption from 77 to 117 K; (b) CO2 adsorption from 185 to 343 K on an ultramicroporous MOF [37]. Des:desorption. (Reproduced with permission from Elsevier)
Activated carbons have also been extensively investigated for gas storage and separation applications, particularly for CO2 stor age. One strategy that has been employed to increase the CO2 stor age capacity of these materials is doping the carbon with heteroatoms such as nitrogen and oxygen [38,39]. An example of heteroatomdoped carbons is shown in Figs.8 and 9 [40]. Fig.8 details the structural characterization and includes the Ar (87 K) adsorption isotherms and the resulting QSDFT pore size distribu tions. Fig.9 shows the CO2 surface excess and absolute adsorbed amount at high pressures (up to 40 bar) for these carbons. These sorbents exhibit outstanding CO2 capture capacity at low pressure (atmospheric) due to the presence of ultramicropores,but also show high capacity at high pressures (30–40 bar) due to the welldeveloped hierarchy of large micropores and narrow meso pores in the carbon [40].
《Fig.8》

Fig.8. (a)Argon (87 K) sorption isotherms for heteroatomdoped carbons BIDCX700 and (b) corresponding QSDFT pore size distributions Dv (d) (for clarity,pore size distribution curves are offset) [40]. (Reproduced from The Royal Society of Chemistry)
《Fig.9》
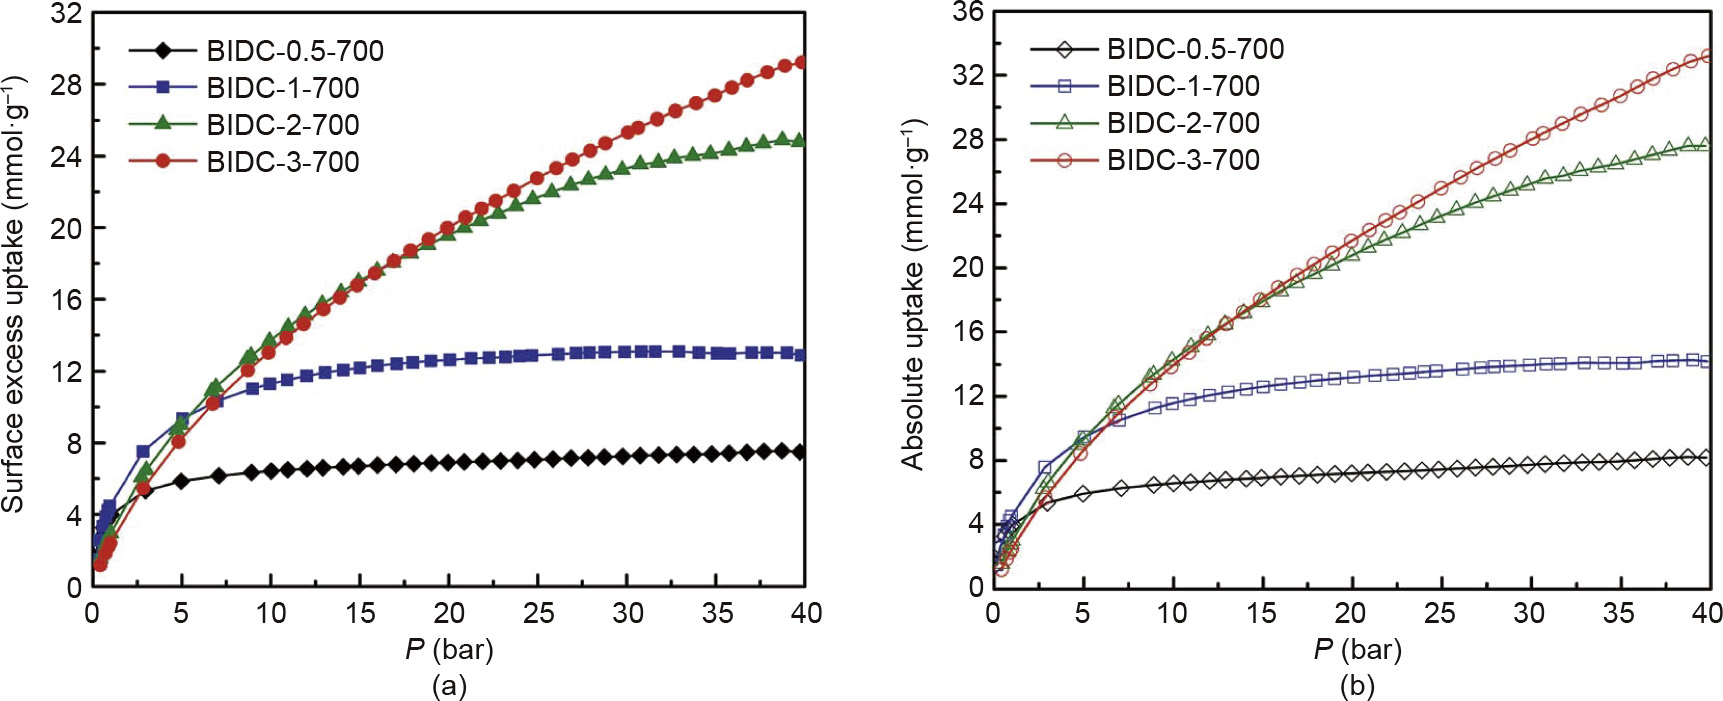
Fig.9. (a) CO2 surface excess and (b) CO2 absolute adsorption isotherms at 298 K for heteroatomdoped carbons [40]. (Reproduced with permission from The Royal Society of Chemistry)
《7.Conclusions》
7.Conclusions
Recent advances in the structural characterization of micro porous and mesoporous materials by gas adsorption have been possible because of the advancement in understanding the phase and adsorption behavior. A proper understanding of the structure is crucial for correlating the structure and the gas storage abilities of a material. Clear recommendations for choice of adsorptive have been provided by IUPAC; namely, that Ar (87 K) adsorption is recommended, particularly for materials containing polar func tionality, and that CO2 (273 K) is useful for the characterization of ultramicroporous carbons. Proper choice of adsorptive, coupled with advanced DFT methods for pore size characterization lead to accurate pore size distributions for nanoporous materials. Further textural information can be obtained by interpreting the resulting gas sorption hysteresis loop for mesoporous materials. Finally, gas adsorption at high pressures can be used to directly assess the capabilities of a material for the storage of gases such as CO2, CH, and H. It is necessary to be extremely cautious in the interanalysis. Novel theoretical approaches that account for the non rigidity of the adsorbent are needed, and such methodologies are under development.
《Compliance with ethics guidelines》
Compliance with ethics guidelines
Katie A.Cychosz and Matthias Thommes declare that they have no conflict of interest or financial conflicts to disclose.


 京公网安备 11010502051620号


