


《1. Introduction》
1. Introduction
Hydrological hazards have always been a major threat to safety in coal mines. Many kinds of water hazards have been encountered in Chinese coal mines, and water burst and inrush accidents in coal mines have resulted in numerous casualties and huge property losses. Hydrogeological work is fundamental to ensuring the safe operation of coal mines, so it is essential to obtain detailed information on the geological and hydrological conditions of a coal mine in order to solve hydrogeological issues and prevent and control water hazards.
Hydrological hazards costed lives and destroyed property before in the Anjialing No. 1 Coal Mine. During the resources integration effort that was made after China Coal acquired the Anjialing No. 1 Coal Mine, it was found that there was a significant lack of hydrological information on the old goaf and its water distribution, which posed a serious safety risk [1,2]. Potential water hazards in the mine include water in the upper coal-bearing strata, various small occurrences of water seepage and Ordovician limestone water. A particular hazard is posed by the water abundance that is present in a labyrinthine network of tunnels that were dug by the local private owners of small coal mines or by villagers, many of which have no records filed due to unlawful production.
To solve this safety issue, many attempts have previously been made to determine the scope of the old goaf and the water distribution in the Anjialing No. 1 Coal Mine. Various geophysical methods have been separately applied, including logging, seismic method, direct current resistivity, audio magnetotellurics, controlled-source audio-frequency magnetotellurics (CSAMT), transient electromagnetics, and high-density resistivity. However, due to their poor resolution, all of these methods failed to reveal the precise boundaries of the goaf or of the structures that can become water passages, such as mine tunnels, collapse columns, and faults. Nevertheless, these prior attempts did provide a certain amount of information on the scope of the goaf.
In this work, the wide-field electromagnetic method (WFEM) was employed to collect high-resolution data. The resulting huge quantities of three-dimensional (3D) data were then precisely inverted by flow field fitting (FFF), thereby yielding a precise distribution of the resistivity of the area that was measured. This is the first example of the application of FFF in the detection of coal mine hydrological hazards. The borehole-surface excitation technique was also adopted in order to improve the response from both the goaf and the water-bearing zones. High-precision electric field measurement was carried out at different borehole excitation depths. The range of the water-bearing zones and the relation between them were then determined by analyzing the differences between the apparent resistivities at different excitation depths.
Based on this detailed understanding of the local geology, the scope of the goaf and the water distribution in the coal mine were precisely identified from the 3D resistivity distribution that was inverted with a high resolution. Thus, this method provided a reliable technical support for safe coal production, leading to the release of nearly 4 km2 of coal seam for operation; in addition, the findings of this method were practically verified during production.
《2. Principles behind the exploration methods 》
2. Principles behind the exploration methods
《2.1. The wide-field electromagnetic method 》
2.1. The wide-field electromagnetic method
The WFEM is a brand-new method proposed by He [3,4], which can be considered as a significant improvement to the well-known CSAMT. Unlike the CSAMT, which can only work in the far field, WFEM can work in the far field, the transition zone, and part of the near field, with both the grounded electric dipole and the ungrounded magnetic loop being used as field sources. In the transition zone and in the far field, the apparent resistivity is iteratively calculated from the measured electric fields and/or magnetic fields.
The WFEM technique can use a grounded dipole as an artificial electric source to generate changes in electric or magnetic fields (Fig. 1). This grounded dipole source can transmit different electromagnetic waves with different frequencies. At the receiver, the wide-field apparent resistivity can be calculated by measuring the electric field and/or the magnetic field. More specifically, only one component—either an electric field or a magnetic field—is needed in the WFEM technique.
Fig. 1 illustrates the half-space model with a grounded dipole source. In the figure, dL represents the length of the current dipole;  are the resistivity, permeability, and dielectric coefficient of the medium, respectively; and
  is the azimuth angle of the cylindrical coordinate system. Both the relative dielectric coefficient
  and the relative permeability
  are fixed at 1. All components of the electromagnetic field in the cylindrical coordinate system are expressed as follows [5]:
《Fig.1》
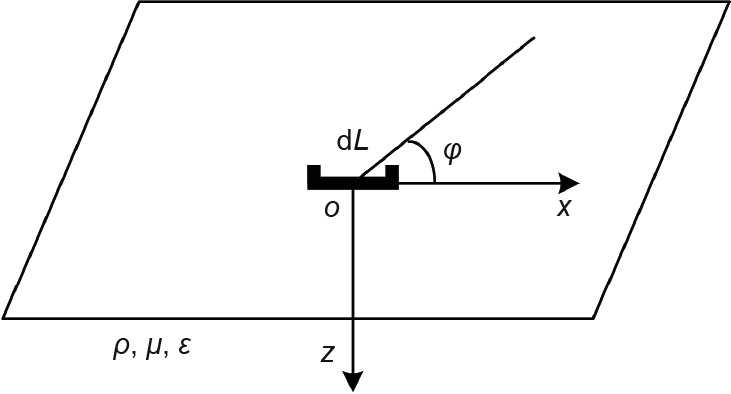
Fig. 1. An illustration of the half-space model with a grounded dipole in a cylindrical coordinate system.


where I represent the emission current; i and e represent the imaginary symbol and exponential operation, respectively; Er, Eφ, and Ez represent the electric field components in the direction of r, φ, and z, respectively; Hr, Hφ, and Hz represent the magnetic field components in the direction of r, φ, and z, respectively; k is the wave number, where k2 =-iωμ/ρ, and ω is angular frequency; and Iv and Kv are the v-order first and second Bessel functions with imaginary argument ikr/2, respectively.
Er, Eφ, Hr, Hφ, and Hz all contain information on the underground resistivity distribution  , so the apparent resistivity can be obtained by measuring any one of them and solving the corresponding formulas in Eqs. (1)–(6).
WFEM sounding that employs an electric current dipole source on the ground surface and measures the x component of the horizontal electric field Ex is known as E-Ek WFEM, and has been widely used in field work [3,4].
Using Eqs. (1) and (2), and the coordinate transformation Ex = Ercosφ -Eφsinφ, leads to the following:

where

The function f E-Ek (ikr) is composed of frequency, resistivity, and offset, reflecting the propagation characteristic of the electromagnetic wave under the ground, which is known as the E-Ek electromagnetic response function of the WFEM. In the formula -ikr =(-1- i)r/δ (δ is skin depth), Ex can be obtained by observing the electric potential difference between the two points M and N; therefore, the potential difference between M and N:

where  is the distance between the electrodes M and N. Thus,

Using the geometrical coefficient KE-Ek , where

allows the apparent resistivity formula for the E-Ek WFEM to be obtained as follows:

The resistivity value of underground media is also contained at the right side of Eq. (12). An iteration algorithm can be used to obtain the optimal value of the apparent resistivity. However, before the iterative strategy is used, an appropriate evaluation of Eq. (11) must be performed. Since the equation may have multiple solutions, it is difficult to obtain the right solution. The solution to this equation has been proved and published by Wang and Xiong [6]. In the iterative method, an initial value is needed to solve the nonlinear resistivity equation. By combining one component of the electromagnetic field with other parameters, the initial value of the apparent resistivity can be updated. If the relative difference between these two values is less than 1%, the later value can be used as the final apparent resistivity.
《2.2. Flow field fitting method》
2.2. Flow field fitting method
The principle behind the FFF method is similar to that of a flow field and current field. Under certain artificial current field conditions, the boundary conditions of the flow field are the same as those of the current field. The key lies in how to establish the artificial current field [7–10].
The motion of water can be expressed by the flow velocity u. In a Cartesian coordinate system, the three components along the axis are ux, uy and uz. Water is an incompressible fluid that satisfies continuity equations:

where ∇ is the Hamilton operator.
Considering that u is irrotational, there must be a flow potential function H:

where “–” indicates the direction of the velocity pointing to the potential. Eq. (14) indicates that the velocity of the flow is equal to the negative gradient of the potential.
Eq. (14) is then substituted into Eq. (13) to yield the following:

where ∇2 is the Laplacian. Eq. (14) shows that the velocity potential in the irrotational field flow satisfies the Laplace equation. If some parts of the field are unimpeded, for example through the porous medium, the coefficient K should be added to Eq. (14):

where K is the permeability coefficient and Eq. (16) is Darcy’s law.
If the boundary between a fluid and other object is impermeable, water cannot flow through the boundary; that is

where n indicates the normal direction of the boundary. If the boundary is permeable, according to the continuity equation given as Eq. (13), the normal component of the boundary flow velocity u should be continuous; that is, un1 = un2, where the indices 1 and 2 represent the two sides of the boundary, respectively.
The distribution of current is described by the current density J of a point in space. Considering the constant current field, when the space is outside the source, J satisfies the continuity equation ∇·J =0.
The constant current field is irrotational, and is connected to the current density by Ohm’s law in a differential form: J= σE = -σ∇V, where σ is the dielectric conductivity of the medium. The conductivity of natural water varies from 0.01 to 10 s·m-1 , mainly depending on the concentration of its ions, and the value 1 s·m-1 is generally accepted. E is the electric field intensity—that is, the negative gradient of the electric potential. The current density is proportional to the gradient of the potential drop. The conductivity of a natural water body can be considered to be constant; therefore, ∇2 V = 0. In other words, the potential V also satisfies the Laplace equation.
At the interface of two different types of media, the normal component of the current density is continuous; thus,

If one side of the dielectric is an insulator so that there is no electric conductivity, then

Thus, there is a mathematical and physical similarity between the irrotational water flow field and the constant current field, and between the flow velocity of the flow field and the current density of the current field (Table 1). These similarities form the basis of the FFF principle.
《Table 1》
Table 1 Similarities between the water flow field and the current field.

《3. Geological setting and geophysical outline》
3. Geological setting and geophysical outline
《3.1. Geological setting》
3.1. Geological setting
The survey area is located in the middle of the Pingshuo Coal Mine, which is west of the Maguan River. Most of the surface is covered by Cenozoic strata, a typical loess hilly landform. The strata are almost horizontal, with a dip of generally less than 10 degrees. The coal-bearing strata are mainly Carboniferous and Permian, and the lithology of the strata is mainly composed of sandstone siltstone, followed by clay rock. Coal is mainly distributed in the upper Carboniferous Taiyuan Formation and lower Permian Shanxi Formation.
The study involves the exploration of the No. 4, No. 9, and No. 11 coal seams. The No. 4 coal seam is located in the Taiyuan Formation of upper Carboniferous, which is mainly composed of clarain, followed by durain with a weak glass luster and uniform structure. The gangue is mudstone, the roof is K3 sandstone, and the seam thickness is about 10.47 m. The No. 9 coal seam is located in the Taiyuan Formation of upper Carboniferous, which is mainly composed of clarain, followed by durain with a weak glassy luster, internal fissures, and broken blocks. The waste rocks are mudstone containing pyrite nodules, and the seam thickness is about 13.75 m. The No. 11 coal seam is located in the Taiyuan Formation of upper Carboniferous, which is mainly composed of semibright coal with a banded structure. Its internal fissures are relatively developed, and the seam thickness is about 3.73 m.
《3.2. Main aquifers and aquicludes 》
3.2. Main aquifers and aquicludes
The major coal seams are located in the Taiyuan Formation of upper Carboniferous. The five sandstone layers of K6, K4, K3, S2, and S1 are the aquifers in Carboniferous-Permian (Table 2). Of these, K6 and K4 are indirect water-filled aquifers of the No. 4 coal seam, located in the top and bottom of the Shihezi Formation of Permian; K3 is a direct water-filled aquifer of the No. 4 coal seam, located in the bottom of the Shanxi Formation of Permian; S2 is located between the No. 4 and the No. 7 coal seams; and S1 is located between the No. 7 and the No. 9 coal seams. These five layers of sandstone constitute the main aquifers in the coal mine that pose a threat to coal mining.
《Table 2》
Table 2 Hydrogeological characteristics of the formation

q is the water content.
The main aquiclude of the coal mine is mudstone, between Carboniferous and Permian; this is mainly distributed within a clasolite aquifer that is predominantly composed of shale and mudstone.
《3.3. Physical characteristics 》
3.3. Physical characteristics
The physical basis of electrical prospecting is to measure the electrical difference between the target and the surrounding objects. According to the information on physical properties (Table 3), the resistivity clearly differs between a coal seam, wall rock, and watery zone. Thus, if the goaf contains water, its resistivity will be very low.
《Table 3 》
Table 3 Resistivity character of strata

《4. Exploration arrangements》
4. Exploration arrangements
《4.1. The wide-field electromagnetic method 》
4.1. The wide-field electromagnetic method
A diagram showing the WFEM arrangement is provided in Fig. 2. The transmitter was located in the north part of the area to be studied, with an offset between 4500 and 5900 m. The transmission cable was about 1000 m long, the emission voltage was 700–800 V, and the emission current was about 120 A. The frequency range was from 8192 to 0.75 Hz, which contains 40 frequencies and is suitable for exploration from the surface down to a depth of 2 km under the earth.
《Fig.2》

Fig. 2. Schematic diagram of the WFEM arrangement.
《4.2. The flow field fitting method 》
4.2. The flow field fitting method
The arrangement of the borehole-surface FFF method is shown in Fig. 3. The system is divided into two parts: the transmitter and the receiver. The wellhead position was at the center of the measurement grid, and the measurement was arranged in eight directions. The measurements were carried out two times. For the first measurement, electrode A1 was placed at the surface of the borehole; at the other end, electrode B was placed at infinity (i.e., more than 3000 m away from the wellhead) in order to transmit signals and measure the potential difference. For the second measurement, electrode A2 was placed into the watery zone in the borehole, while electrode B was still placed at infinity in order to transmit signals and measure the potential difference. The first measured potential difference was treated as the normal field. Based on the difference between these two potential differences, the distribution of the electric field generated by the watery zone was obtained; from this, the range of the water-bearing zones and the relation between them were deduced.
《Fig.3》
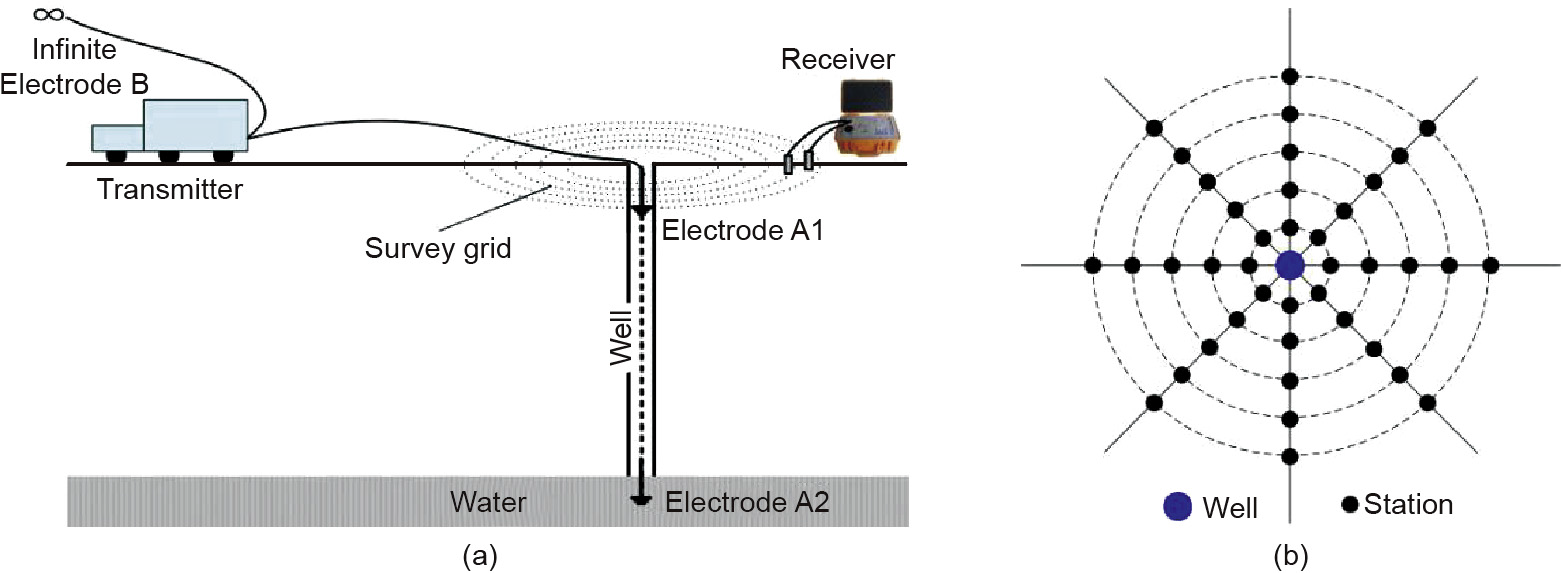
Fig. 3. Arrangement of (a) the surface-borehole FFF and (b) the survey grid.
A layout of the survey grid is shown in Fig. 3(b). Taking the borehole as the center, five concentric circular measurement nets were arranged. The distance between the concentric circles was 100 m, and eight measuring points were arranged on each concentric circle. MN of 20 m was applied.
《4.3. The borehole-surface high-resolution exploration grid 》
4.3. The borehole-surface high-resolution exploration grid
The survey grid is shown in Fig. 4. The survey area was about 2320 m in the east–west direction and 400 m in the south–north direction. The grid scale was 40 m × 40 m, and total number of measuring points was 1911. A total of 10 survey boreholes were used for the FFF.
《Fig.4》
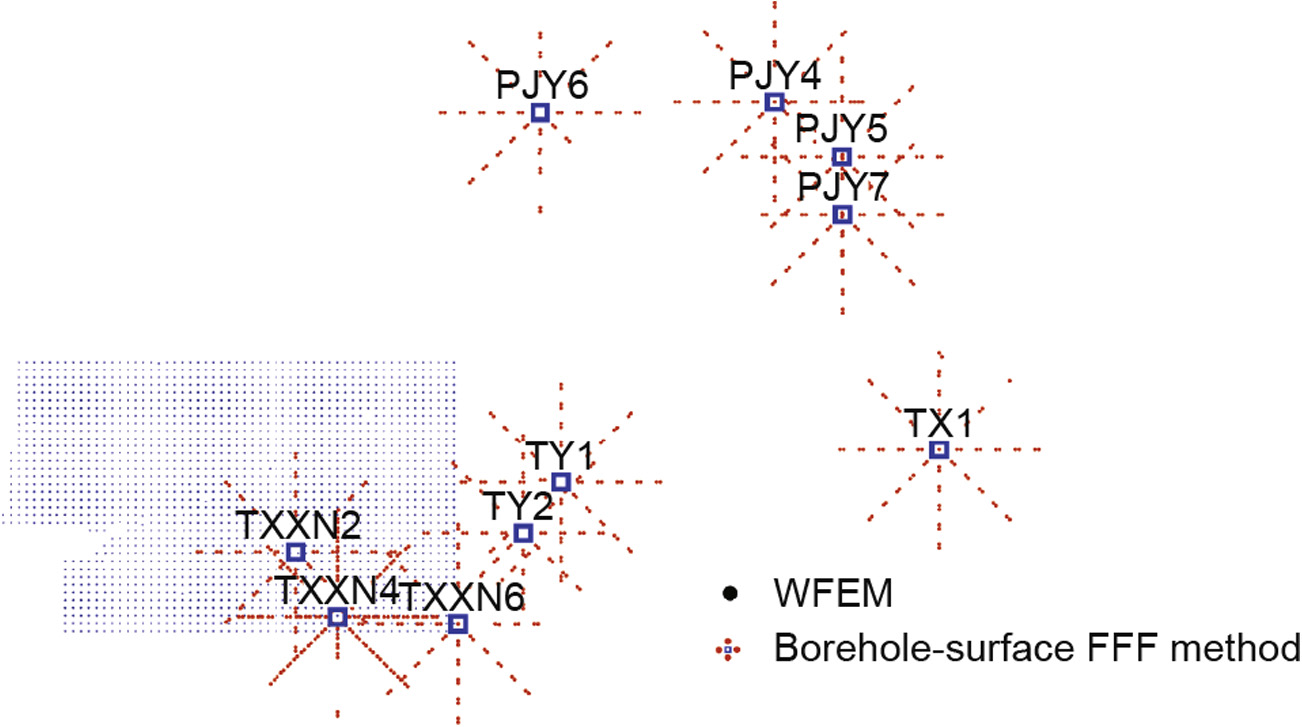
Fig. 4. Borehole-surface high-resolution exploration grid.
《5. Data processing 》
5. Data processing
《5.1. Processing the wide-field electromagnetic data》
5.1. Processing the wide-field electromagnetic data
A geoelectric model of the measured area was established based on the geophysical data, combined with the regional geological information and the electrical characteristics of the stratum lithology. Two-dimensional (2D) continuous media inversion was carried out. Next, based on the results of the 2D inversion, 3D media inversion was performed. Geological interpretation was conducted on the results of the 3D inversion, mainly based on the apparent resistivity profile measured by the WFEM. In this way, the geological and geophysical characteristics of the area under study were revealed by a combination of WFEM and FFF method.
Under normal conditions, the underground resistivity is inversely related to the water content. Thus, it will be relatively high if the area has little or no water in general, but relatively low for a watery region. Based on the 3D resistivity data from the inversion, the resistivity planes at the depths of the No. 4, the No. 9, and the No. 11 coal seams were obtained. Here, only the resistivity plane of the No. 4 coal seam is shown (Fig. 5).
《Fig.5》

Fig. 5. Watery zones at the depth of the No. 4 coal seam, as revealed by WFEM (unit: m)
Fig. 5 demonstrates the watery zone of the No. 4 coal seam as revealed by the WFEM. In this figure, dark blue represents rich water-bearing areas, light blue represents water-bearing zones, and yellow represents weakly water-bearing areas. There are two main blocks of rich water-bearing areas. One, known as watery anomaly No. I, is located in the southwest, where there are many production shafts and many abandoned small kilns. Thus, this watery zone is due to the watery goaf. The other rich waterbearing anomaly, No. II, is located in the northeastern part of the survey area; however, this anomaly is weak.
Fig. 6 displays the resistivity plan at the depth of the No. 4 coal seam. In this figure, the dark blue color represents ultra-low resistivity, light blue represents low resistivity, yellow represents medium resistivity, and red represents high resistivity. According to both physical and geological characteristics, regions of ultralow resistivity correspond to rich water-bearing areas, regions of low resistivity correspond to water-bearing zones, and regions of high resistivity correspond to the goaf without water. In the same way, the watery anomalies in the No. 9 and the No. 11 coal seams can be obtained (Fig. 7 and Fig. 8).
《Fig.6》
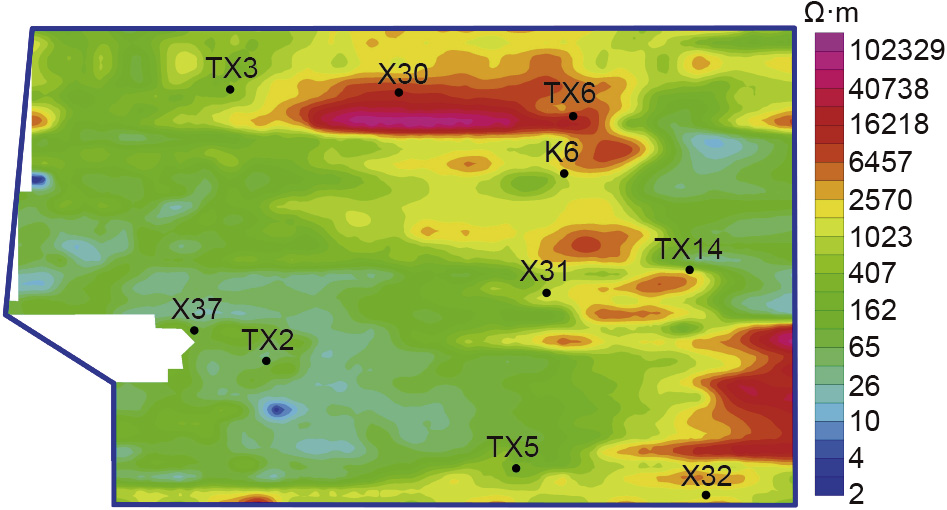
Fig. 6. Resistivity plan of the depth of the No. 4 coal seam
《Fig.7》
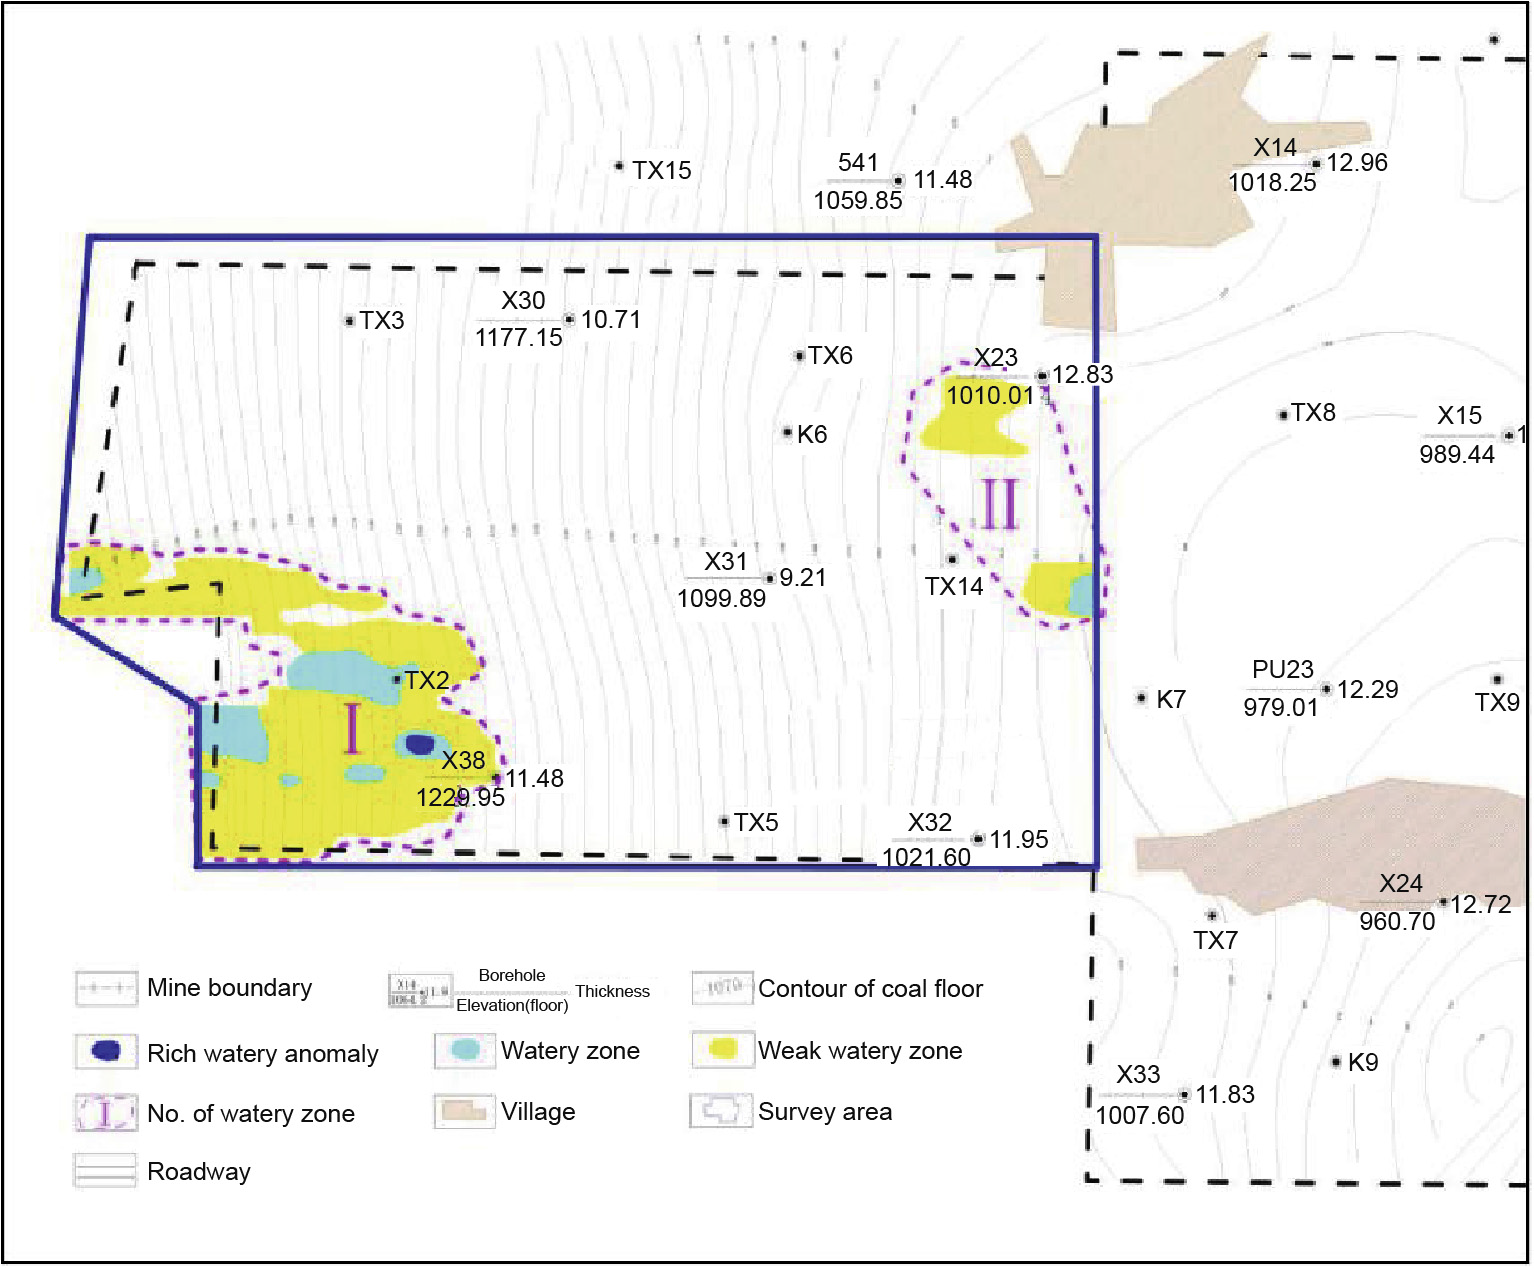
Fig. 7. Watery zones at the depth of the No. 9 coal seam, as revealed by WFEM (unit: m)
《Fig.8》
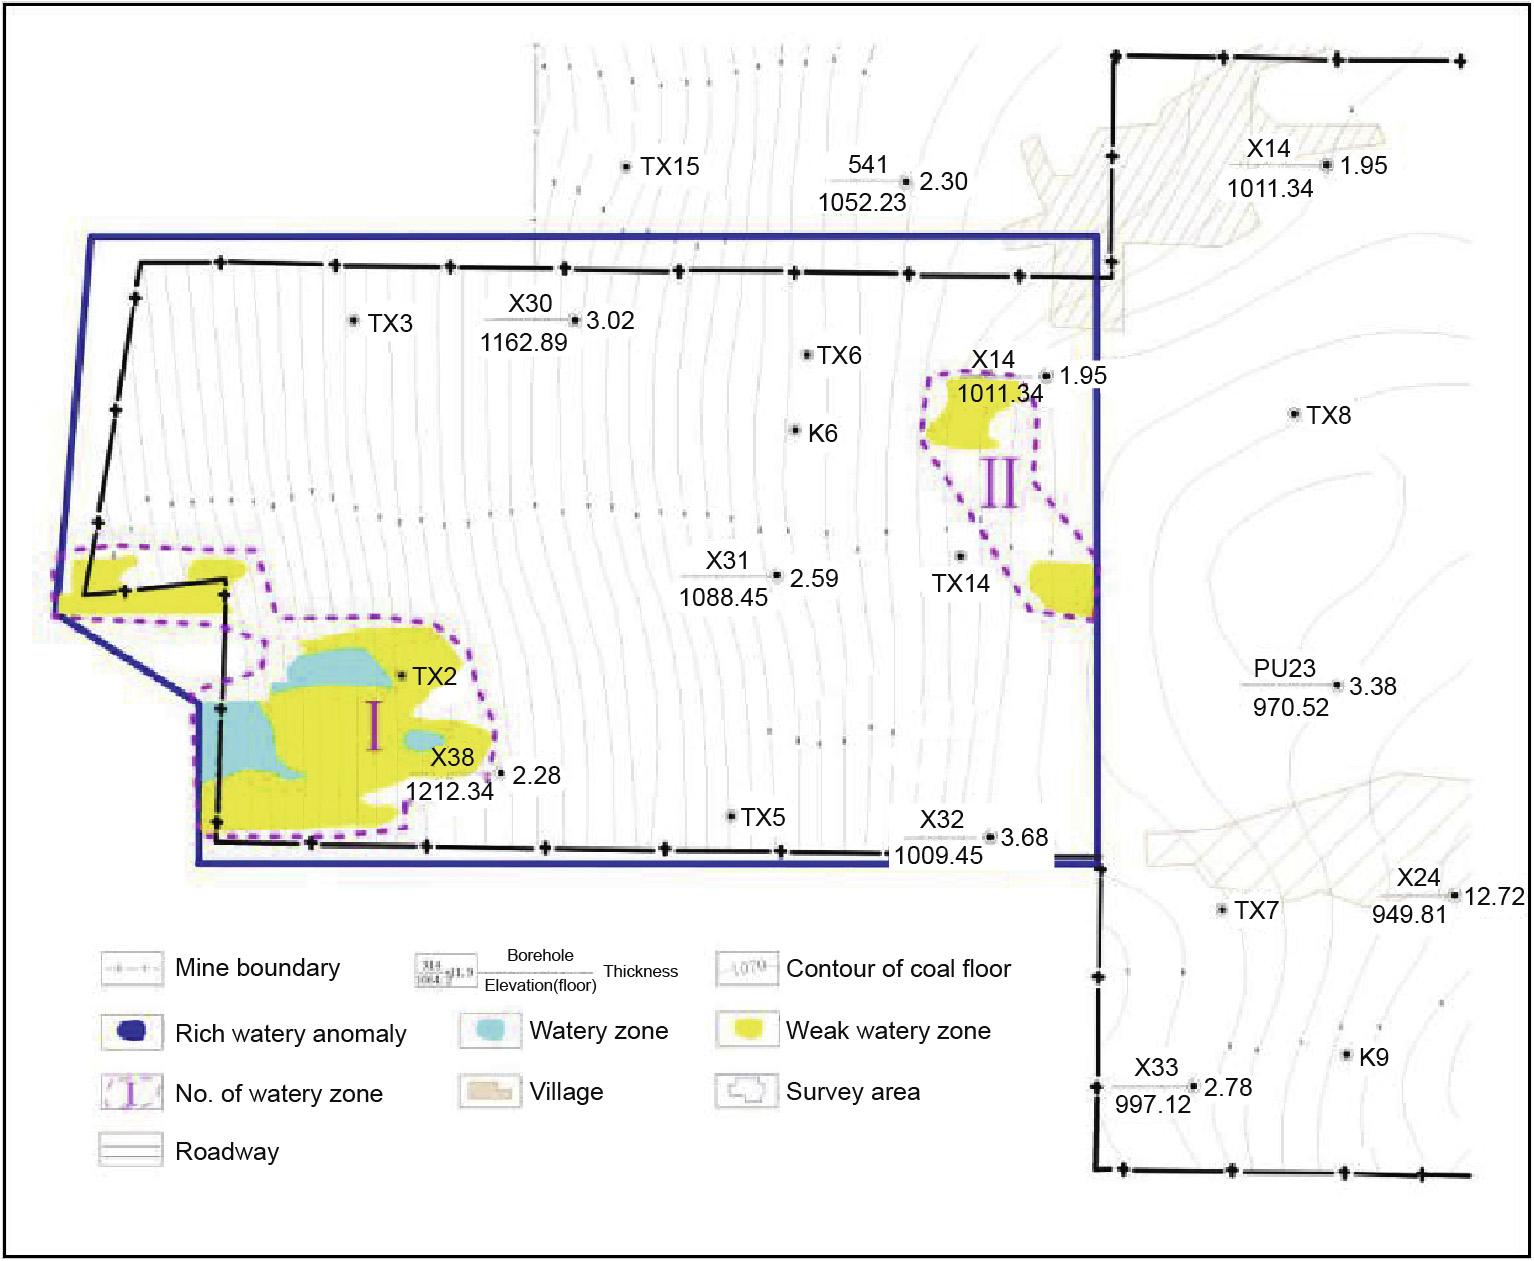
Fig. 8. Watery zones at the depth of the No. 11 coal seam, as revealed by WFEM (unit: m).
Fig. 7 shows the watery zone of the No. 9 coal seam, as revealed by the WFEM. The main distribution character of the watery anomaly of the No. 9 coal seam is similar to that of the No. 4 coal seam. There are two main blocks of rich water-bearing areas. Watery anomaly No. I is once again located in the southwest, although it is smaller than that of the No. 4 coal seam. The other rich waterbearing area, No. II, is located in the northeastern part of the survey area; however, this anomaly is weak.
Fig. 8 shows the watery zone of the No. 11 coal seam, as revealed by the WFEM. The main distribution character of the watery anomaly of the No. 11 coal seam is similar to that of the No. 9 coal seam. There are two main blocks of rich water-bearing areas. Watery anomaly No. I is again located in the southwest, but it is smaller than that of the No. 9 coal seam. The No. II rich water-bearing anomaly is located in the northeastern part of the survey area; however, this anomaly is very weak.
《5.2. Data processing of the borehole-surface flow field fitting method》
5.2. Data processing of the borehole-surface flow field fitting method
First, the apparent resistivity is calculated according to the measured potential difference. The resistivity plane at different depths, according to the position of electrode A (Fig. 3), can be used to analyze and interpret the geoelectric characteristics. Next, the apparent resistivity at each depth of electrode A is divided by the apparent resistivity of electrode A located on the surface. The resultant normalized resistivity plan can be applied to eliminate the anomalies caused by the change in surface resistivity.
《6. Exploration results and discussion》
6. Exploration results and discussion
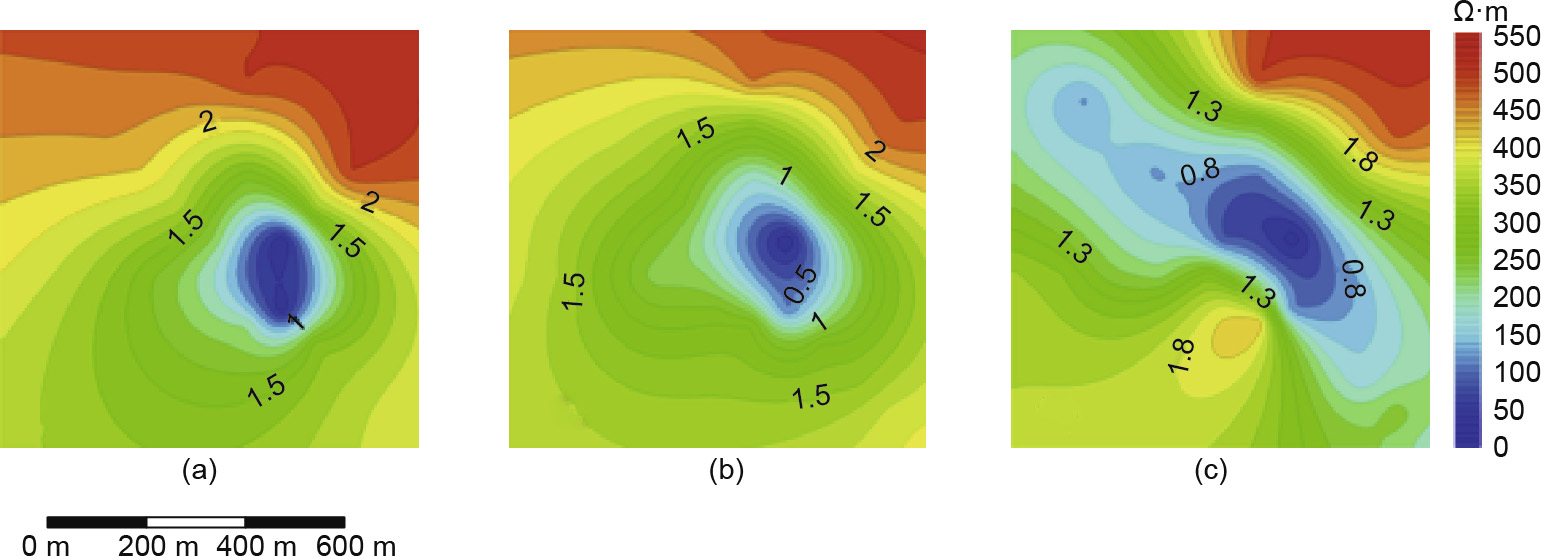
In the PJY 4 test borehole, four different depths of electrode A were arranged, at 0, 100, 160, and 220 m, respectively. The No. 4 coal seam lies at a depth of 220 m. The apparent resistivity obtained at these different depths (Fig. 9) can be employed to analyze the geoelectric properties and thus identify the distribution of watery areas. The apparent resistivity distribution characteristics were similar when electrode A was located at the depths of 100 and 160 m. However, when electrode A was placed at a depth of 220 m, the distribution character showed a major change. Next, the apparent resistivity at the electrode A depths of 100, 160, and 220 m was divided by the apparent resistivity at the electrode A located on the surface. The resulting three normalized resistivity plans were applied to eliminate the anomalies caused by the change of surface resistivity. The normalized resistivity plans are shown in Fig. 10. It is clear that when the depth is 100 and 160 m, respectively, there is almost no change; however, an obvious change occurs at a depth of 220 m. An obvious low-resistance band with a northwest–southeast direction can be seen. It is speculated that this band is caused by a watery zone.
《Fig.9》

Fig. 9. Apparent resistivity plans obtained in the PJY 4 test borehole. (a) 0 m; (b) 100 m; (c) 160 m; (d) 220 m.
《Fig.10》

Fig. 10. Normalized apparent resistivity plans obtained in the PJY 4 test borehole. (a) 100 m; (b) 160 m; (c) 220 m
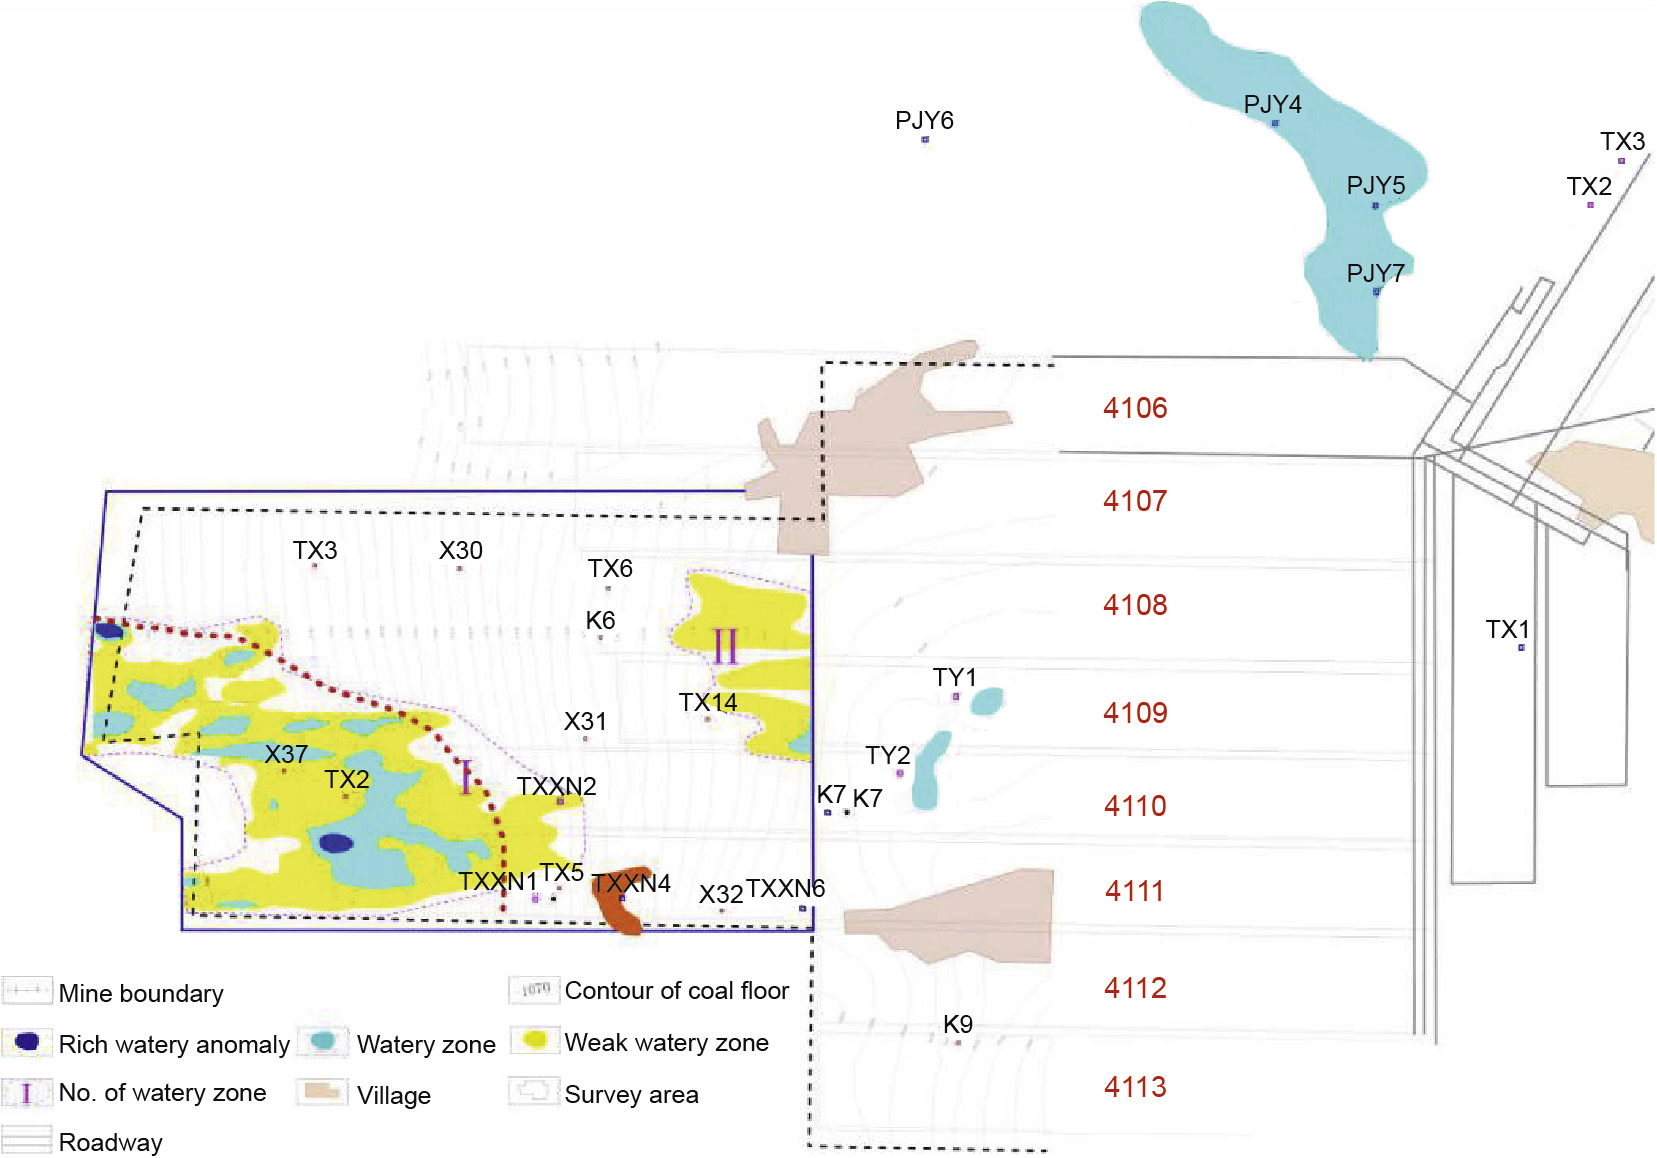
Fig. 11 shows the goaf and the water distribution in the Anjialing No. 1 Coal Mine, based on the results of using both WFEM and borehole-surface FFF. It can be seen that there are locations with a high potential for water-hazard danger; the location with the highest risk is in the southwestern part of the survey area, which has a rich water-bearing zone. Moreover, a suspected water-hazard area is located in the northeast part of transport roadway 4106, where the resistivity is very low. However, further research is required to identify the relationship between this lowresistivity anomaly and its water-bearing property. The highresistivity anomaly located in the south of the survey grid is mostly likely caused by the goaf. Based on this detailed understanding of the hydrogeological properties of the survey area, a mining area of nearly 4 km2 has been released for development these results have also been verified during practical coal production.
《Fig.11》

Fig. 11. Exploration results showing the goaf and water distribution.
《7. Conclusions》
7. Conclusions
By using a combination of 3D WFEM and the borehole-surface FFF high-resolution exploration technique in the Anjialing No. 1 Coal Mine, detailed geological data were obtained that allowed the goaf and water-bearing zones to be accurately located. More specifically, the rich water-bearing zones revealed by the watery anomalies are mainly distributed in the southwestern part of the Fig. 9. Apparent resistivity plans obtained in the PJY 4 test borehole. (a) 0 m; (b) 100 m; (c) 160 m; (d) 220 m. Fig. 10. Normalized apparent resistivity plans obtained in the PJY 4 test borehole. (a) 100 m; (b) 160 m; (c) 220 m. Fig. 11. Exploration results showing the goaf and water distribution. 674 J. He / Engineering 4 (2018) 667–675 WFEM survey area; there is also a second suspected water-bearing area. It was recommended that these rich water-bearing zones, as interpreted by WFEM and FFF, be avoided during subsequent production. This information provided reliable technical support for safe production in the Anjialing No. 1 Coal Mine. As a result, nearly 4 km2 of coal seams was released for development. These results were also verified during practical coal production.


 京公网安备 11010502051620号


