
《1. Introduction》
1. Introduction
Bioactuators, which generate power from living muscles, have been gathering attention as a different form of actuator [1–10]. Bioactuators can be driven without being supplied with energy or air pressure because they use chemical energy in the form of adenosine triphosphate (ATP). This type of actuator is inherently small and light, and has a high energy efficiency compared with other actuator types [11]. In research on bioactuators, electric stimulations [12] or chemical stimulations [13] have been used to control muscle contraction. These stimulations, however, cause contractions of entire muscle tissues, so they are not useful for handling complex movements.
In order to control muscle contractions partially and promptly, stimulations triggered by light, which have high temporal and spatial resolution, have been suggested [14–17]. The genetic tools used for this purpose are known as optogenetic tools [18,19], and their use allows muscles react to light stimulation [20,21].
Peristalsis is an important movement in the digestive systems of multicellular creatures that allows the conveyance of sustenance to their entire bodies. By deforming the tubular structure of these systems, the movement can convey tender materials without crushing the materials’ forms; furthermore, the large contact surface between the materials and the structure allows food (materials) to be assimilated effectively and efficiently. For industrial applications, peristalsis is also useful for transporting objects without the risk of outside exposure. Several investigations have reported successful reproductions of peristalsis using servomotors [22], pneumatic actuators [23], magnetic fields [24], a shape memory alloy actuator [25,26], and an electrostatic actuator [27]. Tubes are important structures for multicellular organisms, and organisms have gained peristaltic movement through evolution. We considered that by reproducing peristaltic movement with a bioactuator, it would be possible to achieve a breakthrough in creating more integrated tissue-engineered soft robots.
In this work, we designed, built, and tested a micro peristaltic tube powered by an optically controllable Drosophila melanogaster (D. melanogaster) larvae muscle (Fig. 1). We chose these larvae because they adopt peristaltic movement for their locomotion, so we considered their muscle structure to be optimized for peristalsis. In addition, methods have been established for the transgene transfer of D. melanogaster and these flies reproduce in a short time, making these larvae abundantly available.
《Fig. 1》

Fig. 1. Flow-generation mechanism of peristaltic pumps. (a, b) An industrial peristaltic pump with (a) a typical structural detail and (b) its simplified model; (c, d) a bioactuator peristaltic pump with (c) its simplified mechanism and (d) the concept of this experiment. For the industrial pump, its rotor places stress on the silicone tube surface and generates an internal flow. For the bioactuator peristaltic pump, optical light stimulation causes the contraction of muscles and generates an internal flow. Upon light stimulation, the tissue-engineered pump induces sequential muscle activation, gradually changing the stimulation area, in order to generate an undulating movement. Flow direction is changed by generating an asymmetric undulating motion between the left and right muscles.
First, using a transgenic method, channelrhodopsin-2 (ChR2) was expressed on larvae muscle tissue in order to control the muscle contraction with light stimulation. ChR2 is a light-gated cation channel that responds to blue light and increases the flow of cations into the cell, triggering an action potential and thus causing muscle contraction. To understand the performance, peristalsis of the larvae was observed by examining the moving surface. While changing the speed of the propagating light stimulation, we examined the contractile displacement on the larvae surface. The accumulated flow rate and optimal speed were then calculated. Finally, to reproduce peristalsis, we produced a tube using living muscle of D. melanogaster expressing ChR2. The micro tube was fabricated from the larva by detaching the head and tail and removing the tube contents. Although the excised tube was already dead as a creature, it was still alive as a tissue, and the contraction ability remained. To observe the internal flow, we introduced microbeads into the micro tube and measured their speed as they were conveyed by controlling the peristaltic movement of the micro tube.
《2. Material and methods》
2. Material and methods
《2.1. Obtaining photoresponsive larvae》
2.1. Obtaining photoresponsive larvae
To fabricate a light-responsive bioactuator, we used D. melanogaster (wild-type strain, Canton-S third instar) larvae material. We accessed the GAL4/UAS system [28] with the targeted genetic property on the cells of the D. melanogaster larvae as shown in Fig. 2. Adult male D. melanogaster, which have myocyte enhancer factor-2 (Mef2) on the GAL4 line (GAL4-Mef2) and adult virgin female D. melanogaster, which have ChR2 on the UAS tag (UASH134R-ChR2 [29]) were mated in a glass bottle that contained food including the photosensitizer, all-trans-retinal (ATR, SigmaAldrich). To obtain virgin female D. melanogaster, male and female flies must be separated within 7 h of their emergence. ATR is indispensable in the utilization of ChR2 because the insects do not generate ATR in their bodies. After mating, the females laid eggs within two days. The eggs hatched within a day; after five days, we obtained full-sized larvae just before they became pupae. This entire process was carried out at room temperature (25°C). ChR2 expression on the larvae muscle cells was verified by observing red fluorescence from mCherry, which expresses at the same location as ChR2 (Fig. 3), using a fluorescence microscope (BZ-X710, Keyence). The success rate of the expression was 100% (n = 18).
《Fig. 2》
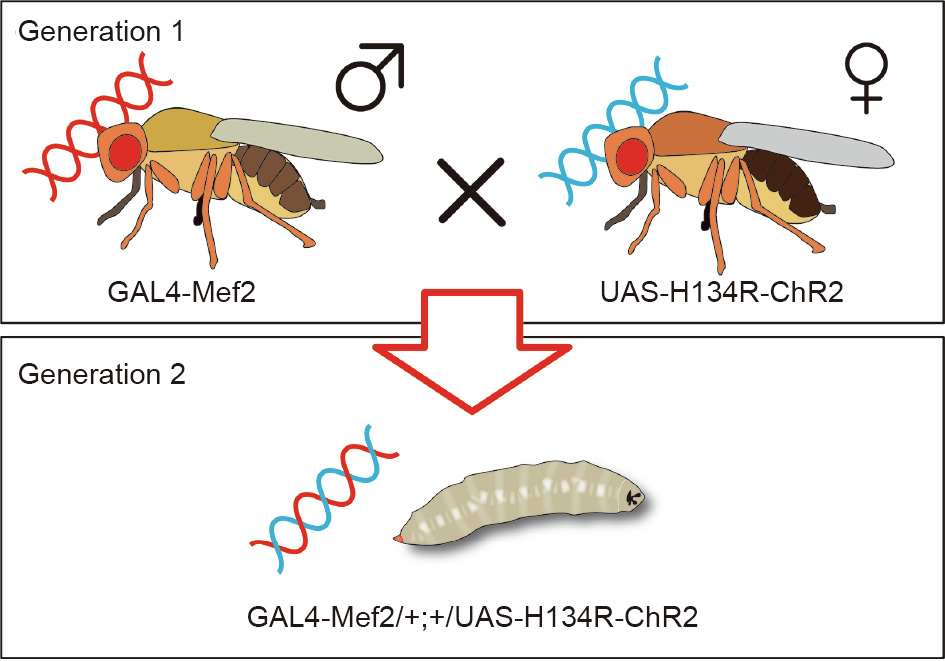
Fig. 2. Schematic diagrams showing how the GAL4/UAS system with the desired genetic property was obtained on the muscle cells of the larvae. Adult male GAL4- myocyte enhancer factor-2 (Mef2) and adult female UAS-H134R-ChR2 were mated to obtain larvae. Male D. melanogaster, which have Mef2 on the GAL4 line (GAL4- Mef2), and virgin female D. melanogaster, which have ChR2 on the UAS tag (UASH134R-ChR2), were mated in a bottle containing food including all-trans-retinal. The resulting larvae had H134R-ChR2 on all myocytes.
《Fig. 3》

Fig. 3. Fluorescence image for mCherry from larvae expressing ChR2. By comparing the left and right images, we observed the location of gene expression. Red fluorescence was observed for the entire body muscle in the right image.
《2.2. Obtaining the tubular structure》
2.2. Obtaining the tubular structure
The micro tube for the bioactuator was excised from the larva expressing ChR2 by means of dissection (Fig. 4). We cut off the head and tail with a stainless steel disposable surgical blade (Kai Medical) and drew out the tube contents. This tube consisted of cuticle and muscle tissues attached to the cuticle. Excised tubes were kept in Schneider’s Insect Medium (S0146, Sigma-Aldrich). The main nervous system of the larva was cut off, and no spontaneous contraction occurred on it. These micro tubes and their crosssections were observed directly using a fluorescence microscope, as described in Section 2.1. The photoresponsivity of the tubes was verified by observing the contraction on the surface with blue light stimulation. The success rate of the expression was 60% (n = 5).
《Fig. 4》
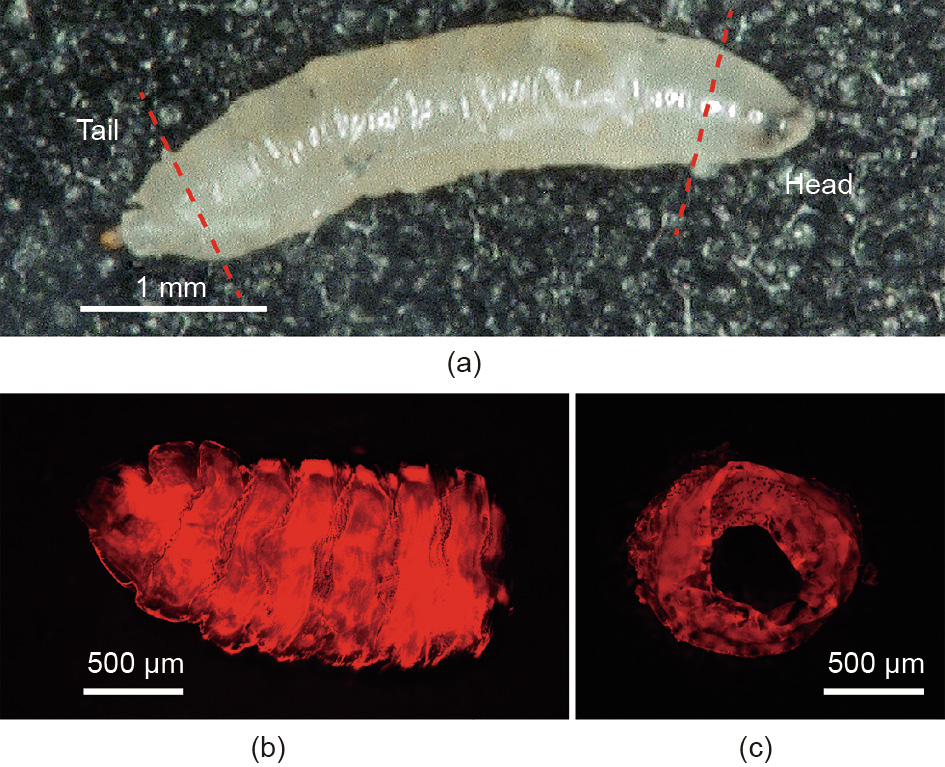
Fig. 4. Obtaining a tubular structure of living muscle tissue from a D. melanogaster larva. (a) The head and the tail ends were cut off, and all internal organs were removed; (b) a side view of a tube structure, with the head end on the right; (c) a partial cross-section of a tube structure.
《2.3. Setup for light stimulation》
2.3. Setup for light stimulation
The D. melanogaster larvae muscle is forced to contract in response to blue light stimulation (λ = 466 nm). As the contraction of the larvae varies according to light intensity, a uniform field of illumination is important. We built our stimulation setup from several pieces of equipment. An inverted microscope (Ti-U, Nikon) with an objective lens (4× magnification, numerical aperture 0.13, Nikon), a digital mirror device (DMD) projector (DLP light Commander, Texas Instruments), a plano-convex lens (diameter = 25 mm, f = 50 mm, Sigma Koki) and an achromatic lens (diameter = 25 mm, f = 100 mm, Sigma Koki) were assembled as shown in Fig. 5. The larvae tissues were stimulated on the microscope stage. The power density of the blue light was 2.0 mW·mm-2 on the stage surface. The propagation speed of the stimulation area was controlled as shown in Fig. 6. Each stimulation pattern was prepared using Paint software (Microsoft Paint, Microsoft). Each image was output as a bitmap graphic. The set of images was input into control software in order to control the projector. The speed of light propagation was controlled by changing the frequency. Our system had a temporal resolution shorter than 1 ms and a spatial resolution of up to 20 μm. A movie camera (FASTCAM SA3, Photron) was attached to record the moving images.
《Fig. 5》

Fig. 5. Experimental setup for light stimulation. “Lens 1” represents the planoconvex lens (diameter = 25 mm, f = 50 mm) and “lens 2” represents the achromatic lens (diameter = 25 mm, f = 100 mm). The distance from the DMD projector lens to lens 1 is about 100 mm and the distance from lens 1 to lens 2 is about 180 mm. The total distance from the projector to the microscope inlet is about 310 mm. These distances were finely adjusted after setting them up roughly, so that light was focused on the microscope stage. A pattern flow input from a personal computer was reflected onto the DMD projector irradiation pattern. The purple arrow shows the path of the patterned light stimulation. Yellow and red arrows show the path of light from the microscope light source. The yellow arrow represents white light and the red arrows represent the white light excluding blue-spectrum by means of a filter.
《Fig. 6》

Fig. 6. A set of input patterns used to control the peristaltic pumping action. The number of steps, propagation speed, and stimulation area width were changed arbitrarily. Each stimulation pattern was composed of a combination of a black rectangle (648 × 864 pixels) for the background and a white rectangle (42 × 864 pixels) for the light area, and was prepared using Paint software. Each image was output as a bitmap graphic. The set of the images was input into control software. A stimulation wave comprised 36 images.
《2.4. Visualization of internal flow》
2.4. Visualization of internal flow
To observe the internal flow, microbeads (i.e., polymer microspheres with the mean diameter of 99.5 cm ± 1.5μm in water, 4310A, Duke Scientific Corporation, Lot No. 30911) were employed. The microbeads were diffused in Schneider’s Insect Medium and injected into the micro peristaltic tube with a micropipette. The peristaltic pumping action was controlled and observed with the experimental setup shown in Fig. 5.
《3. Results and discussion》
3. Results and discussion
《3.1. Measurement of tube structure》
3.1. Measurement of tube structure
The micro peristaltic tubes were observed using fluorescence. The average length of the tube structure was 1342 μm (n = 6). The inner diameter was 423 μm and the outer diameter was 790 μm (n = 6). The original length of the larvae was greater than 3 mm, but dissection removed the inner pressure and the entire tissue shrank. The sizes were measured under standard atmospheric pressure; however, since the tubes were soft, they could be stretched by pulling.
《3.2. Measurement of muscle contraction》
3.2. Measurement of muscle contraction
We captured moving images with the setup described in Section 2.3. Each stimulation pattern was composed of a combination of a black rectangle (648 × 864 pixels) and a white rectangle (42 × 864 pixels), as shown in Fig. 6. We used 36 images for a stimulation pattern. With 36 images, a frequency of 36 Hz resulted in each cycle being one second long. With this stimulation, we controlled the peristalsis of muscle tissue, as shown by the timelapse images in Fig. 7 and in the movie provided in the Supplementary data (Movie S1). The micro tube exhibited a back-and-forth motion of contractions when the propagation direction of the stimulation was changed (Movie S2 in the Supplementary data). Without such control, the peristaltic cycles of larvae are unidirectional in nature. Therefore, this result indicated that the contraction was indeed induced by the light stimulation. By changing the speed of the propagating light stimulation while fixing the width of stimulation area at 400 μm, we examined the peristaltic pumping action by observing surface displacement ( ), as shown in Fig. 8. The propagation speeds of the stimulation areas were adjusted from 0 to 500 μm·s-1 , where μm·s-1 meant stimulation without propagation. As the propagation speed increased, the contractile displacement became smaller, as shown in Fig. 9(a). This change probably occurs because the muscle contraction is caused by cation flow, which is induced by ChR2. In this case, ChR2 did not receive enough energy to contract the whole tissue. To obtain larger displacement on the muscle with a high propagation speed, a more powerful resource is needed.
《Fig. 7》

Fig. 7. Time-lapse images of the peristaltic cycle with forced contraction controlled by light stimulation. Red rectangles indicate light stimulation areas. In these images, the output frequency was 3 Hz for 12 s. The contraction areas on the tube surface corresponded with the stimulation areas. The scale bar is 1 mm.
《Fig. 8》
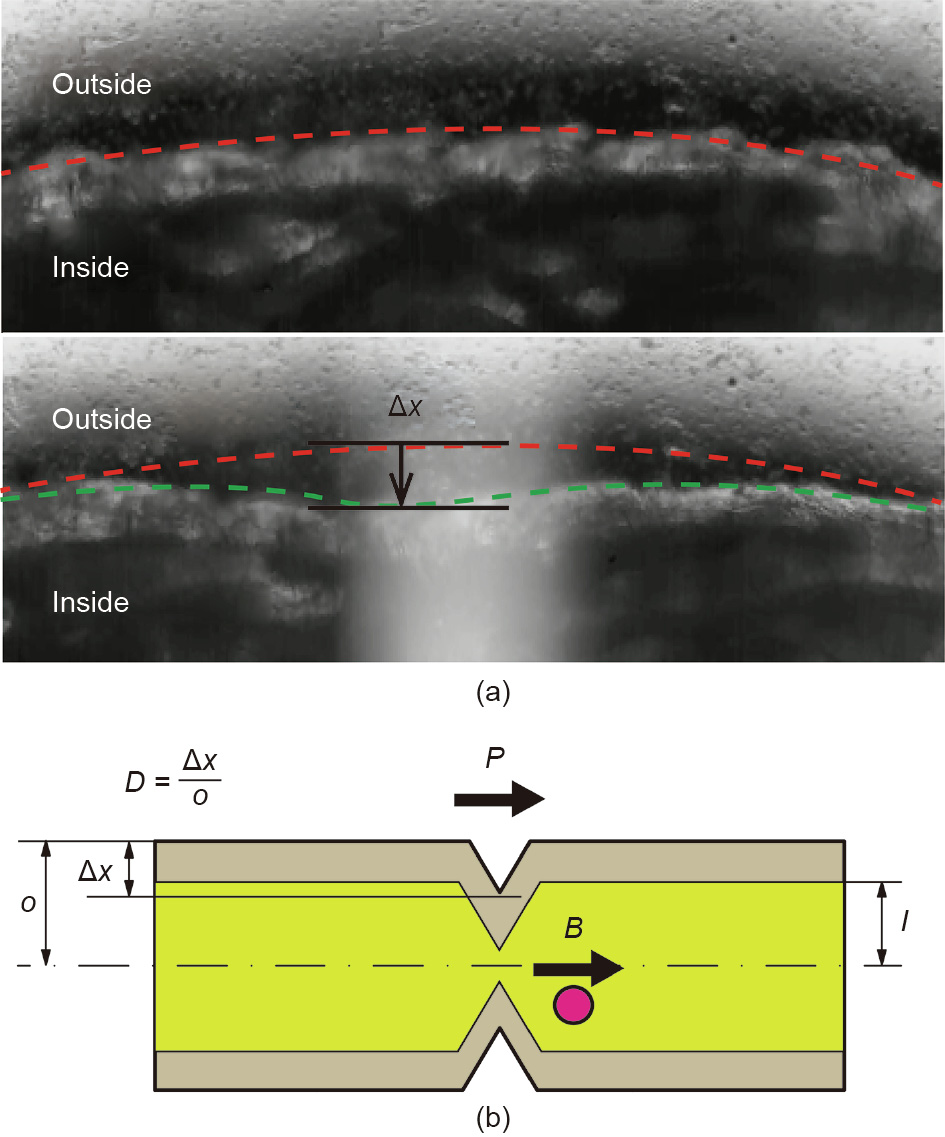
Fig. 8. (a) Observed displacement on the surface. represents the displacement from the original surface line. In the lower image, the tissue was exposed to light stimulation. (b) A schematic view describing the parameters to calculate the performance of the cell-based fluid actuation. The surface displacement volume was calculated by Eq. (1), where V is the flow volume, I is the inner radius of the tube, and D is the displacement rate. The displacement rate on the tissue surface is equal to the displacement divided by the radius of the body (o). P is the propagation speed of the light stimulation, and B is the observed speed of the microbeads.
We calculated the induced flow volume as the volume of the surface contraction. The surface displacement volume was calculated using Eq. (1), where V is the flow volume, I is the inner radius of the tube, and D is the displacement rate. The displacement rate on the tissue surface was equal to the displacement ( in Fig. 8) divided by the radius of the body. P is the propagation speed of the light stimulation (Fig. 8(b)).

The dimension represented by  is volume change per unit time. The propagation speed that gave the largest was selected as the optimal speed.
Next, using Eq. (1), we calculated the flow rate. As shown in Fig. 9(b), the highest flow rate was obtained when the propagation speed of the light stimulation was 400 μm·s-1 .
《Fig. 9》

Fig. 9. (a) Dependence of the displacement rate on the propagation speed of the light stimulation. The error bars show the standard deviations. (b) Calculated flow rate from the propagation speed and displacement rate in Eq. (1); 0 μm·s-1 refers to stimulation without propagation (n = 3).
《3.3. Demonstration of fluid actuation by peristalsis of the micro conveyor tube》
3.3. Demonstration of fluid actuation by peristalsis of the micro conveyor tube
We captured moving images of the tube. To control the peristaltic pumping action, we used 12 images for the stimulation wave, as shown in Fig. 10. Each stimulation pattern was composed of a combination of a black rectangle (1024 × 768 pixels) for the background and two white rectangles (75 × 768 pixels) for the light area, and was prepared using Paint software. Each image was output as a bitmap graphic. The set of images was input to control software in order to control the projector. By controlling the peristaltic pumping action of the tube, we succeeded in transporting the microbeads, as shown in Fig. 11 and the movie provided in the Supplementary data (Movie S3). When the width of the stimulation area was fixed at 400 lm and the propagation speed was fixed at 400 μm·s-1 , the microbeads were transported at an average speed of 120 μm·s-1 .
《Fig. 10》
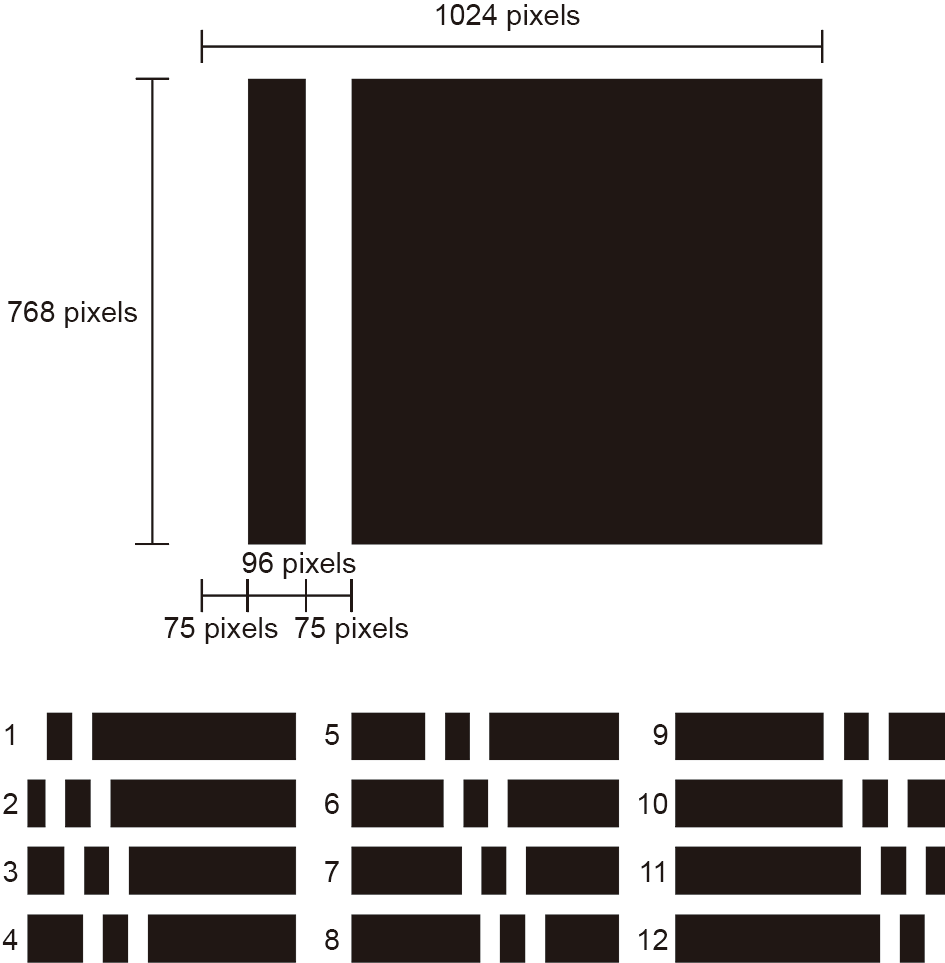
Fig. 10. The set of input patterns used to control the peristaltic pumping action. Each stimulation pattern, consisting of a rectangular image, was composed of a combination of a black rectangle (1024 × 768 pixels) for the background and two white rectangles (75 × 768 pixels) for the light area, and was prepared using Paint software. Each image was output as a bitmap graphic. The set of the images was input into control software. A stimulation wave comprised 12 images.
《Fig. 11》

Fig. 11. Time-lapse images when transporting microbeads. The change in microbead position shows that the microbeads were transported. The flow rate of the fluid inside the tube was calculated by dividing the displacement by the time. (a) Light stimulation reached the leftmost bead; (b) image taken 0.8 s later, where each dotted circle indicates a microbead location at that instant. Identical colors indicate identical microbeads. The speed of the propagating light stimulation was 0.5 mm·s-1 .
The experimental flow rate was calculated using Eq. (2), where V, I, and D are the same terms as in Eq. (1), and B is the speed of the transported microbeads (Fig. 8(b)).

For a B of 120 μm·s-1 , we calculated the experimental flow rate to be 6 nL·s-1 using Eq. (2). This value was smaller than the value of 12 nL·s-1 that was obtained from Eq. (1). One reason for this difference may be that the tube surface was not smooth.
We then compared the estimated performance with previously reported cell- or tissue-based bio-micropumps. Compared with another reported pump using a cardiomyocyte sheet (2 nL·min-1 ) [1], our present flow rate was 180 times higher. Compared with a polydimethylsiloxane (PDMS) membrane-based pump (0.226 nL·min-1 ) [30], our flow rate was 1800 times higher. The sizes of these pumps were different, and the power of the larvaederived muscle tissue was significant. We obtained stable flow without the use of any artificial valves or other soft materials. Since our tube was composed of only biomaterial, there was less wasted energy consumption.
《4. Conclusions》
4. Conclusions
In this work, we fabricated a micro peristaltic tube using a bioactuator, with D. melanogaster larvae muscle tissue expressing ChR2 as the material. By combining an inverted microscope, a DMD projector, and two lenses, we were able to control the peristaltic pumping action while simultaneously observing it. The peristaltic pumping action was induced by stimulation with blue light. Light stimulations cause less damage to tissues than other types of stimulation, including chemical and electrical stimulations. We examined the optimum speed of light propagation using the flow volume calculated from the observed displacement on the micro peristaltic tube surface. Under our experimental conditions, the optimal propagation speed was 400 μm·s-1 . If a stronger light source is used, it may be possible to obtain better muscle contraction and a higher flow rate. We succeeded in transporting microbeads at a speed of 120 μm·s-1 and a calculated flow rate of 12 nL·s-1 .
Studies on bioactuated machines have been limited to membrane-based animals such as jellyfish or stingrays [3,17]. To obtain large three-dimensional structures, a tubular structure must be introduced for energy circulation. Thus, the tubular tissue structure examined in this study represents a step forward in the development of more integrated bio-machines.
《Acknowledgements》
Acknowledgements
The present work was supported by Grant-in-Aid for Japan Society for the Promotion of Science (JSPS) Fellow (17J01742), JSPS, MEXT KAKENHI (21676002, 23111705, 26249027, and 17H01254), and the Industrial Technology Research Grant Program from the New Energy and Industrial Technology Development Organization (NEDO) of Japan.
《Compliance with ethics guidelines》
Compliance with ethics guidelines
Eitaro Yamatsuta, Sze Ping Beh, Kaoru Uesugi, Hidenobu Tsujimura, and Keisuke Morishima declare that they have no conflict of interest or financial conflicts to disclose.
《Appendix A. Supplementary data》
Appendix A. Supplementary data
Supplementary data to this article can be found online at https://doi.org/10.1016/j.eng.2018.11.033.


 京公网安备 11010502051620号


