

《1. Introduction》
1. Introduction
Inkjet printing is a cost-effective, fast, and versatile additive manufacturing technique. It is classified into continuous inkjet (CIJ) printing and drop-on-demand (DOD) printing, where DOD printing has wide applications in sensors [1], solar cells [2], memory devices [3], radio frequency devices [4], complex circuits [5], and tissue engineering [6,7]. DOD printing is popular because of its high accuracy, precision, and controllability for printing droplets. For example, it can be used in tissue engineering to place cells and biomaterials in specific target locations in order to achieve the necessary spatial resolution. Nevertheless, several adverse phenomena, including droplet satellites, large droplets, and slow droplet speed, can reduce printing precision, pattern quality, controllability, and stability, hence restricting extensive application of inkjet printing [8].
During DOD bioprinting, there are three droplet statuses: no droplet, only primary droplet, and primary droplet with satellites [9,10]. ‘‘Only primary droplet” printing is the ideal printing result that can deposit cells in specific positions. Satellites are typically small droplets that are generated with the formation of the primary droplet. Satellite formation is mainly due to excessive droplet deformation caused by the Rayleigh instability [10]. Once the Bernoulli pressure generated by the speed is larger than the capillary force (generated by the surface tension) and viscous force, satellites are generated and decrease the printing precision and pattern quality.
Since DOD printing is usually used in micro-printing processes, droplet diameter is an important index for printing precision. Furthermore, very low droplet speed may cause the breakup of the droplet near the nozzle and generate a wet perimeter around the orifice of the nozzle. In bioprinting, cells in residual liquid may adhere to the orifice of the nozzle, causing non-ideal wetting [11]. This phenomenon suppresses droplet formation and causes a non-straight flying trajectory, decreasing printing stability.
Droplet types, diameters, and speeds are influenced by printing parameters, such as the voltages applied in piezoelectric DOD printing, ink properties, and structure of the DOD print-head. It is difficult to describe the relationship between droplet features and printing parameters using a single physical model. Many researchers have focused on models that feature only one droplet with printing parameters for DOD printing. The main method is to study the generation and elimination models of satellites. Kim and Baek [12] have discussed the printability parameter range to produce a primary droplet without satellites using computational fluid dynamics (CFD) simulations. Dong et al. [9] have proposed a criterion for the maximal critical breakup length to avoid satellites. Poozesh et al. [13] have proposed a mechanism to generate various droplet sizes with no change in nozzle diameter, while satellites were generated.
Only a few studies have discussed a model that includes all of the above droplet features in order to optimize the DOD printing parameters, because these droplet features conflict with each other. For example, increasing droplet speed can enhance printing stability, but generates satellites. Reducing satellites or droplet diameter can improve printing precision, but may decrease droplet speed and printing stability. Thus, there is a need to find as good a solution as possible to balance these different goals through a multi-objective optimization (MOO) method.
Since no clear function model has been studied between droplet features and printing parameters, machine learning is herein proposed to map out this nonlinear and complex model. Machine learning has been proven to be effective in both classification and regression in many engineering fields [14–16]. Dos Santos et al. [17] used fully connected neural networks (FCNNs), a class of machine learning method, to build a model of the relation between printing parameters and droplet speed in pulsed gas metal arc welding. That work suggests that FCNNs work well in searching for a data relationship.
Many MOO methods have been proposed in the past, such as evolutionary methods [18,19] and descent methods [20]. Evolutionary methods use an evolutionary algorithm (EA), which is a generic population-based metaheuristic optimization algorithm. Candidate solutions to the optimization problem play the role of individuals in a population, and the fitness function determines the quality of the solutions. Descent methods use a gradient descent algorithm, which is a first-order iterative optimization algorithm. To find the local minimum of a function using gradient descent, steps are taken proportional to the negative of the gradient (or approximate gradient) of the function at the current point. FCNNs have more complex function structures than common functions because they may have several hidden layers. Optimizing FCNNs with EAs may not achieve a Pareto-efficient set, since there are no common convergence criteria. Instead, descent methods rely on rigorous convergence theorems and can achieve calculation stability.
To solve the problems of low printing precision and stability caused by satellites and a slow printing speed, we propose an efficient MOO design method for optimizing piezoelectric DOD printing parameters. Fig. 1 shows a schematic diagram of the proposed method. Both single-objective optimization (SOO) and MOO problems are built to optimize the DOD printing parameters, and FCNNs are used to identify the relationship between satellite formation and printing parameters. The simulation model in our previous work is used to collect datasets for the FCNNs due to its convenience and accuracy [21]. The SOO problem, which is solved by the Adam algorithm, simulates the case of reducing satellite formation with the use of a fixed print-head and bio-ink. The MOO problem simulates the case of building an experimental platform for optimal printing. A hybrid multi-subgradient descent bundle method with an adaptive learning rate algorithm (HMSGDBA) is proposed, which combines the multiple subgradient descent bundle (MSGDB) method with the Adam algorithm to solve the MOO problem. Our experiments verify that a single droplet with a smaller droplet diameter can be printed and a faster speed can be realized using the proposed method, thus improving the printing precision and stability.
《Fig. 1》

Fig. 1. Schematic diagram of the proposed method.
《2. Methodology》
2. Methodology
This section firstly presents a brief description of DOD printing and satellite formation, then discusses the FCNNs model of satellites formation and the optimal design problem of DOD printing parameters as well as the algorithms used in this paper, and finally introduces our experimental setup.
《2.1. Models of piezoelectric DOD printing and satellite formation》
2.1. Models of piezoelectric DOD printing and satellite formation
In this section we address models of piezoelectric DOD printing, which combines inverse piezoelectric effect and compressible fluid theory, and the satellite formation defined according to the degree of droplet deformation.
2.1.1. Models of piezoelectric DOD printing
In piezoelectric DOD printing, a transient mechanical pulse is applied to the fluid in the print-head by a piezoelectric actuator based on the inverse piezoelectric effect. This causes the bio-ink to be extruded through the nozzle, producing droplets as shown in Fig. 2. At each pulse cycle, a voltage is applied to the piezoelectric ceramic tube of the print-head to deform the tube wall. The deformation causes transient changes in the internal fluid volume in order to generate a pressure to produce droplets, according to the compressible fluid theory. The inverse piezoelectric effect, which includes compressible fluid theory, is expressed as follows:
《Fig. 2》

Fig. 2. Schematic of the piezoelectric DOD print-head.

where ε is the deformation displacement of the tube along the thickness direction (m); d33 is the piezoelectric strain constant of PZT-5H, the piezoelectric ceramics based on BaTiO3, 593 × 10-12 m·V-1 ; U is the applied voltage (V); ΔV is the change of fluid volume (m3 ); V is initial volume of fluid (m3 ); Δp is the pressure variation (Pa); and K is the bulk modulus of elasticity of the fluid, 2.18 × 10⁹ Pa.
The continuity equation (Eq. (4)) and the Navier–Stokes equation (Eq. (5)), along with Eqs. (1)–(3), form a complete mathematical description of piezoelectric DOD printing and droplet formation:

where  is the density of fluid (kg·m-3 ), u is the velocity (m·s-1 ), l is the viscosity of fluid (kg·m-1·s-1 ), and f r is the surface tension force (N).
The surface tension force  in Eq. (5) is expressed based on the continuum surface force model as follows [22]:

where  is the surface tension of bio-ink (N·m-1 ),
  is the volume-averaged density (kg·m-3 ),
  is the density of the current calculated phase in fluid (kg·m-3 ),
  is the density of the other phase in the fluid (kg·m-3 ),
  is the volume of the current calculated phase in the fluid, and
  is the volume of the other phase in the fluid.
is calculated with the volume-of-fluid model as follows [23]:

2.1.2. Models of satellite formation
Taylor [24] proposed the use of a dimensionless number D in Eq. (8) to define the degree of droplet deformation:

where D is the dimensionless number of droplet deformation, Ca is the capillary number, β and is the ratio of droplet viscosity to air viscosity .
Ca is expressed as follows:

where μ1 is the viscosity of bio-ink (m·s-1 ), Rd is the radius of droplet (m), and γ is the shear rate of the cell-laden bio-ink (s-1 ).
D is selected as the evaluation index of the droplet status. The relation between droplet status y and D is expressed as follows:

where s and l are the lower and upper boundary of D, respectively.
According to the mathematical model of DOD printing, the values of the Bernoulli pressure, capillary pressure, viscosity pressure, and unsteady pressure are determined by the applied voltage U, viscosity μ1 and surface tension σ of the bio-ink, and nozzle diameter of the print-head Dn. Droplet deformation is expressed as a function of the printing parameters as follows:

CFD simulations can simulate the piezoelectric DOD printing process as well as satellite formation [21], thus helping researchers to comprehend the working principles of DOD printing. However, this method cannot obtain a precise mathematical model of Eq. (11) because of its complexity. Thus, we select the FCNN method to fit this function, and use CFD simulations to collect training datasets (Fig. 1).
《2.2. Optimization design of DOD printing parameters》
2.2. Optimization design of DOD printing parameters
An optimization design of the DOD printing parameters can improve the printing performance and allow high precision and high stability. FCNNs are first developed to build a model of satellite formation; next, the optimization design is conducted in two cases, as shown in Fig. 1. The first case is an SOO of the applied voltage with the specific DOD print-head and bio-ink. The second case is an MOO design of all the printing parameters to obtain the optimal printing result.
2.2.1. FCNN model of satellite formation
FCNNs have three types of layers (Fig. 3): the input layer, hidden layers, and the output layer. The parameters to be analyzed constitute the input layer, and the fitted result is exported by the output layer. The middle hidden layers establish the nonlinear model of satellite formation, and can be one or many in number. The different layers are connected by weights and biases.
《Fig. 3》
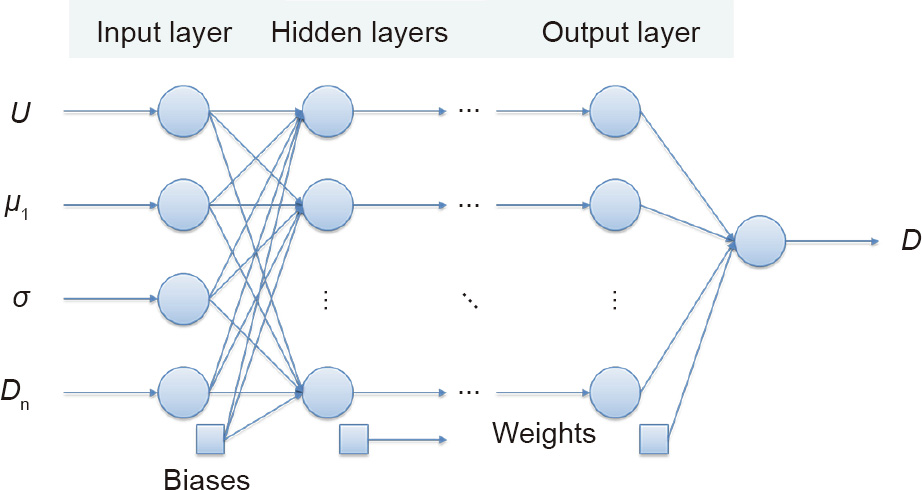
Fig. 3. Schematic diagram of FCNNs.
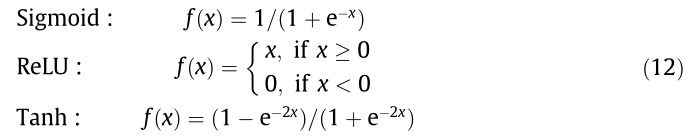
Since the function in Eq. (11) is piecewise continuous, the hidden layers in the FCNNs should be set as either a minimum of two layers comprising smooth activation functions, or one layer comprising both smooth and nonsmooth activation functions, in order to obtain satisfactory fitting results [25,26]. Here, the nonsmooth activation function is selected as the ReLU activation function, defined as rectified linear units, because of its sparse activation, which is beneficial in fitting the first part of the function  —that is, D = 0, corresponding to the ‘‘no droplet” status. Three structures of hidden layers were designed to achieve the best fitting accuracy. The first is composed of one hidden layer with two activation functions—that is, the sigmoid and ReLU activation functions, where the ReLU activation function is nonsmooth. The second comprises two hidden layers with one activation function each—that is, the ReLU and tanh activation functions. The last includes two hidden layers with three activation functions, where the first hidden layer combines the sigmoid and ReLU activation functions, and the second layer is comprised of the tanh activation function. The activation functions are expressed in Eq. (12):
The results of the CFD simulations were obtained as datasets for the FCNNs [21]. A total of 120 results were obtained, of which 87 were used as training sets and 33 as test sets. In the inputs of the datasets, the range of voltage was 15–54 V; the range of viscosity was 1.07–10 cP (1 cP = 10-3 Pa·s); the range of surface tension was 40–72.19 mN·m-1 ; and the range of the nozzle diameter was 25–120 μm. The ranges of the voltage and viscosity were set according to the working scope of our DOD print-head, the range of the surface tension was set based on the common cell concentrations of bio-inks [11], and the range of the nozzle diameter was set larger than the diameter of the cells commonly used for bioprinting. Each input set was selected to train the FCNNs by sufficient different droplet statuses. As listed in Table 1, the values of D were around 10-8 –10-7 with the prepared bio-inks described in Section 2.4. The outputs of the datasets were set as values of D magnified 106 times in order to improve the fitting accuracy. The Adam algorithm introduced in Section 2.3 was used to train the FCNNs. Three optimal FCNNs were obtained by optimizing the parameters of the FCNNs, including the numbers of hidden nodes, learning rate, and training epochs. Their structures and the test results are listed in Table 2. The third FCNN had the best test accuracy, with a least mean absolute error (MAE) of 9.4% and a least root mean squared error (RMSE) of 10.9%. This FCNN was set as the model of satellite formation in Eq. (11).
《Table 1》
Table 1 Values of D to print primary droplet in experiments.

《Table 2》
Table 2 Structures of the designed FCNNs and test results.

a lr represents the learning rate used in the Adam algorithm to train FCNNs.
2.2.2. Single-objective optimization design of voltages
In the first case, both the piezoelectric DOD print-head and the bio-ink are specified. The applied voltage is the only parameter to be adjusted, in order to reduce satellite formation. The design of the DOD printing parameters is treated as a SOO problem, as follows:

where D0 is the specific value of D that refers to the condition of printing a primary droplet without satellites ; c1 and c2 are the correction coefficients, c1 = 0.89 and c2 = 0.90. The Adam algorithm is used to solve this optimization problem.
D0 is determined through experiments according to the boundary of D (Table 1)—that is, s and l in Eq. (10). The experimental setup and the three cell-laden bio-inks used in the experiments are described in Section 2.4. The boundaries of D are listed in Table 1, which lists the maximum of s, named smax, as 2.39×10⁻⁸ and the minimum of l, named lmin, as 4.80 × 10⁻⁸ . Printing only primary droplets can be guaranteed when D belongs to [smax, lmin]. Here, D0 is set as a median value between smax and lmin—that is, 3.3 × 10⁻⁸ —as the objective value of D.
Two correction coefficients, c1 and c2, are set to reduce the error among the experiments, FCNNs, and simulation results. Simulation errors in the droplet radius and droplet speed are almost 7% and 4%, respectively [21], and c1 is thus set as 0.89. The FCNN error is 9.4% and c2 is set as 0.90.
2.2.3. Multi-objective design optimization of DOD printing parameters
In the second case, the setup of a bioprinting experimental platform requires suitable and cost-effective DOD print-heads and bioinks. Thus, all the printing parameters require optimization. The platform is expected to satisfy several requirements in addition to satellite reduction, such as high printing precision and a robust and easy printing process. These requirements can be realized by decreasing the diameter of the nozzle, increasing the printing speed by amplifying the applied voltage, and selecting a bio-ink with low viscosity and low surface tension. However, these demands conflict with the demand of reducing satellite formation [9]. Under this condition, the design of the DOD printing parameters is considered to be an MOO problem, as follows:

In the MOO model, f1 represents the goal of increasing printing precision and stability, while f2 represents the goal of avoiding satellite formation. The coefficient of 0.1 in f1 balances the effect of functions f1 and f2. , and
, and  n normalize the parameter according to their range as follows:

《2.3. Multi-objective optimization with the descent method》
2.3. Multi-objective optimization with the descent method
FCNNs are powerful models with non-convex objective functions that have very complex function structures. At first, we tried using an evolutionary MOO algorithm called the multi-objective particle swarm optimization (MOPSO) [27] to optimize Eq. (14); however, the result was non-convergent. Even though descentbased MOO algorithms have a slower numerical calculation speed than many evolutionary MOO algorithms, we selected them to solve the presented problem due to their rigorous convergence theorems. The HMSGDBA is hence proposed, which combines the MSGDB method with the Adam algorithm, in order to solve our MOO problem.
2.3.1. The multiple subgradient descent bundle method
The MSGDB method is a gradient descent-based method for convex nonsmooth MOO problems [28]. It uses the proximal bundle approach first to find descent directions for each objective function, considering the nonsmoothness features. A convex hull of these descent directions is formed, and the minimum norm element is then calculated as a candidate of the common descent direction for all objective functions. If a common descent direction is not found, the union of subdifferentials of the objectives is approximated instead of the above descent directions. This method can at least converge to a weak Pareto-optimal set. The steps of the MSGDB method are as follows:
(1) Initialization: Randomly select the starting point x1; set the stopping parameter εm > 0.
(2) Find the direction dii for all numbers of the objective junctions ii = 1, ..., m separately with an inner iteration kk as follows:

where  is a piecewise linear model to approximate the function fii [29], set dii = dii,kk .
(3) Calculate a minimum norm element as the common descent direction dll by solving the following:

(4) If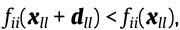 , go to step (6). Otherwise, go to step (5).
  then stop.
(5) Use the proximal bundle method to build a set of subgradients and find another candidate of the common descent direction [29].
(6) Update the parameters with a line-searched step size 

2.3.2. Adaptive moment estimation
The adaptive moment estimation (i.e., Adam algorithm) is a first-order gradient-based optimization algorithm of the stochastic objective function, which is computationally efficient, requests little memory, and is invariant to diagonal rescaling of the gradients [30]. It computes the individual adaptive learning rate for different parameters from estimates of the first and second moments of gradients. The method has been proven to be effective and is widely applied in training the weights matrices of deep learning networks [31]. This study used Adam algorithm to ① optimize the weights matrices of the designed FCNNs and ② generate updated steps in the proposed HMSGDBA. The core steps of Adam algorithm are summarized as follows:
(1) Initialization: f(θ) is the objective function with parameters θ; θ0 is the initial weights and bias matrix of the designed FCNNs; the initialized time step is t = 0; the learning rate η = 0.012; and the other initialized parameters are m0 = 0, v0 = 0, β1 = 0.9, β2 = 0.999, and ε = 10-8 .
(2) Obtain gradients with respect to the objective function at time step t:

(3) Update the biased first moment and second raw moment:
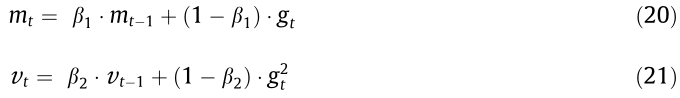
where  indicates the elementwise square gt ʘ gt.
(4) Compute the bias-corrected first moment and second raw moment:

(5) Update the parameters:

(6) If the convergence conditions are satisfied, the resulting parameters θt are returned; otherwise, go back to step (2).
2.3.3. The hybrid multi-subgradient descent bundle method with the adaptive learning rate algorithm
The MSGDB method may be unsuitable for optimizing the objective function of non-convex FCNNs due to the possibility of falling into a local optimum, while Adam outperforms other methods in such cases because it performs a form of step-size annealing and is able to jump out of the local optimum and be infinitely close to the global optimum [30]. HMSGDBA is hence designed to combine the advantages of MSGDB method and Adam algorithm in order to ensure convergence and calculation stability. In HMSGDBA, the common descent direction for all the objective functions is found using MSGDB, and the inputs parameters are updated by Adam algorithm with a learning rate of 0.001 along the found direction. The convergence conditions are set as  . Since the solution of an MOO problem with a gradient descent algorithm is sensitive in terms of starting points, several starting points are selected in order to obtain a Pareto-optimal set.
《2.4. Experimental setup》
2.4. Experimental setup
An in-house-developed piezoelectric DOD print-head with a nozzle diameter of 100 μm was used in this study (Fig. 4). A high-speed camera (Mini AX200 model, Photron), assisted by a super-bright light emitting diode (LED) (SLG-150V, REVOX Solutions by Photron), was used to capture the droplet trajectory at a frame rate of 40 000. The camera was focused on the middle plane of the nozzle, and the droplet formation process was recorded. The voltage pulse was applied to a piezo driver (JetDriveTM III, MicroFab Technologies Inc.) to produce droplets. The piezo driver was connected with the transducer of the print-head.
Three kinds of cell-laden bio-inks were used to test the SOO results (Table 3) [21]. These comprised HeLa cells and Dulbecco’s Modified Eagle Medium (DMEM), or sodium alginate (SA) dissolved in DMEM, to obtain different viscosities. When increasing the concentration of SA to 1.0%, two cell concentrations, 1 × 10⁶ and 5 × 10⁶ mL-1 , were initially used. The testing results showed that both had almost the same viscosity, while the one with 1 × 10⁶ mL-1 cells could not break into droplets after ejection. A possible reason for this result is that the surface tension value of this bio-ink decreases during the transient process of generating droplets, which reduces the total free energy and increases the printing difficulty [11]. Hence, cells with a concentration of 5 × 10⁵ mL-1 were selected for the preparation of bio-ink C as listed in Table 3 in order to ensure that the printer was working well.
《Fig. 4》

Fig. 4. Experimental setup for piezoelectric DOD cell printing. 3D: threedimensional.
《3. Results and discussion》
3. Results and discussion
Experiments were conducted to verify that the proposed method could be used to obtain stable and precise printing results. The optimization results introduce a guideline for the design of a DOD print-head.
《3.1. Verification of voltage optimization results》
3.1. Verification of voltage optimization results
In the SOO problem, the applied voltage was optimized to print only primary droplets with the bio-inks listed in Table 3. The initial voltage was randomly set at 40 V. Table 4 lists the droplet status under the initial voltages and the optimized voltages for each bio-ink. The experimental results showed that printing bio-inks A and B with the initial voltage generated satellites, while printing bio-ink C with the initial voltage did not generate droplets. All of the optimized voltages were able to generate only primary droplets when printed with the corresponding bio-ink (Fig. 5), which verified the designed FCNNs and the SOO results.
《Table 3》
Table 3 Properties of cell-laden bio-inks.

《Table 4》
Table 4 The droplet status under the initial voltages and the optimized voltages for cell-laden bio-inks.

《Fig. 5》
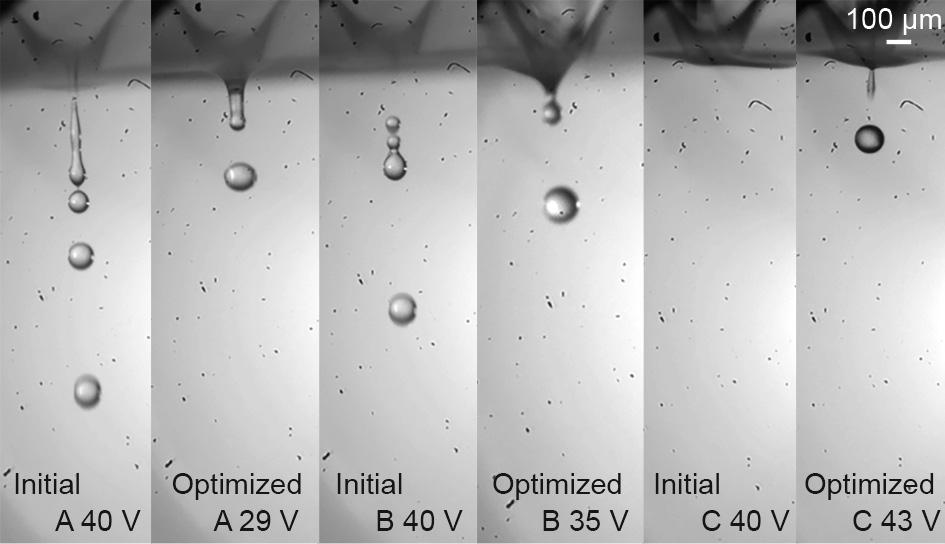
Fig. 5. Experiments printing different bio-inks with optimized voltages.
Given a specific bio-ink and DOD print-head, the applied voltage could be designed to print only primary droplets. This method can replace the trial-and-error process of cell printing experiments and can thus save researchers the expense of obtaining instruments for observing droplet statuses, such as high-speed cameras and microscopes.
《3.2. Optimization design of DOD printing parameters》
3.2. Optimization design of DOD printing parameters
In the MOO problem, based on the verified FCNNs, all the printing parameters were optimized by solving Eq. (14). A Paretooptimal set was obtained using HMSGDBA and MSGDB (Fig. 6). The results show that HMSGDBA achieves a Pareto set that is closer to the global optimum than the results obtained using MSGDB.
According to the results for HMSGDBA shown in Fig. 6, the maximum error of f2 is greater than 2 × 10⁻³ when f1 is at the minimal value of 0.4. The corresponding D is around 1.121 × 10⁻⁷ , which indicates that satellites will be printed. The value of f2 decreases with an increasing value of f1. At the labeled point in the figure, f2 is 6.12 × 10⁻⁶ and f1 is 0.14. This condition is ideal for printing only primary droplets in a stable manner. Although increasing f1 could further decrease f2, the printing precision and stability might worsen. The labeled point can hence be treated as a compromise solution. Table 5 lists the initial, optimized, and adjusted values of the printing parameters. It demonstrates that satellites can be printed initially with D of 8.84 × 10⁻⁸ . After optimization, only primary droplets are printed with a D of 3.75 × 10⁻⁸ , and the printing precision and stability are improved with a decrease in f1. Consequently, the optimal set of printing parameters is 39 V, 1.37 cP, 65.91 mN·m-1 and 29 lm. According to the common properties of the bio-ink and the nozzle diameter of the piezoelectric DOD print-head, the printing parameters are adjusted with a D of 3.77 × 10⁻⁸ . The optimized bio-ink can be prepared by adding surfactants to bio-ink A [32]. The small difference between the adjusted D and the optimal D can be omitted because it has no influence on the final printing results.
《Fig. 6》

Fig. 6. Solutions obtained in objective space for the optimization design of DOD printing parameters using HMSGDBA and MSGDB.
《Table 5》
Table 5 Comparison of printing performance with different printing parameters.

Due to the limitation of our DOD print-head, the proposed method was verified with a fixed nozzle diameter of 100 lm. The initial printing condition used bio-ink B with an applied voltage of 33 V. Even though a single droplets without satellites was printed at first, as shown in Fig. 7(a), no droplets were generated after several moments due to the generation of a wet perimeter caused by a slow droplet speed of 0.88 m·s-1 . Using the proposed method, the printing parameters were optimized for applied voltage, viscosity, and surface tension as 20 V, 1.05 cP, and 41 mN·m-1 , respectively. The designed bio-ink was prepared by mixing 0.01% w/v fluorosurfactant Novec FC-4430 with bio-ink A [32], and the viscosity and the surface tension of the prepared bio-ink are 1.07 cP, and 41.5 mN·m-1 . The small error of viscosity and surface tension between the designed and prepared bio-ink was ignored. The results showed that single droplets were printed stably with the prepared bio-ink (Fig. 7(b)) at a printing speed of 2.08 m·s-1 . A video of the printing process shown in Fig. 7 is provided in the Appendix A.
《Fig. 7》

Fig. 7. Experimental validation of the proposed method. (a) Experimental results with the initial printing parameters of U = 33 V, μ1 = 5 cP, and σ = 71.00 mN·m-1 ; (b) experimental results with the optimized printing parameters of U = 20 V, μ1= 1.07 cP, and σ = 41.5 mN·m-1 .
Considering that the DOD print-head is usually fixed, Eq. (14) was adjusted to determine suitable properties of bio-ink for different biological functions. The optimal value of f1 was set as -0.15 and the nozzle diameter was set as a constant for the best printing precision stability. The new objectives are expressed as follows:

The solutions of Eq. (25) illustrate that a satisfactory viscosity of bio-ink is from 1.00 to 2.60 cP, surface tension is from 50.35 to 67.55 mN·m-1 , and corresponding voltage is from 22 to 40 V. These results imply that printing a bio-ink with high viscosity, such as a high-concentration hydrogel, cannot yield the best printing precision with a robust printing process. The computed range for the viscosity and surface tension of bio-ink can be treated as a reference for the preparation of bio-ink.
《4. Conclusions》
4. Conclusions
This paper proposed an effective multi-objective design optimization method for optimizing piezoelectric DOD printing parameters to print droplets with a smaller droplet diameter and faster droplet speed, without satellites. SOO and MOO problems were solved through FCNNs in order to optimize the DOD printing parameters. FCNNs including two hidden layers with a nonsmooth activation function were verified as having the best accuracy. The experiments demonstrated that an optimized voltage for each bio-ink, obtained by solving the SOO problem, can be used to print single primary droplets successfully. The MOO problem was solved by the proposed HMSGDBA, which combines MSGDB with the Adam algorithm. The obtained approximation of the Pareto set was closer to the global solution than the results obtained using MSGDB. Compared with non-optimized initial printing parameters, the optimized parameters obtained by the proposed method were able to improve the printing precision and stability. Experiments were conducted to validate the SOO and MOO method with a fixed nozzle of 100 μm. The results showed that single droplets were stably printed after optimization in the SOO problem. In the MOO problem, the droplet speed was increased from 0.88 to 2.08 m·s-1 after optimization. Furthermore, based on the optimized nozzle diameter of the DOD print-head, a range of bio-ink properties was proposed as a reference for preparing bio-ink to obtain the best printing precision with a robust printing process. The suggested bio-ink viscosity is from 1.00 to 2.60 cP, the surface tension is from 50.35 to 67.55 mN·m-1 , and the corresponding voltage is from 22 to 40 V. The proposed method improves the printing precision and stability for precise order of cell arrays. Optimized results can be treated as a guideline for the setup of a piezoelectric DOD bioprinting experimental platform.
《Acknowledgement》
Acknowledgement
This work was supported by the China Scholarship Council (CSC) (2016080037).
Compliance with ethics guidelines
Jia Shi, Jinchun Song, Bin Song, and Wen F. Lu declare that they have no conflict of interest or financial conflicts to disclose.
《Nomenclature》
Nomenclature
ε deformation displacement of the tube along the thickness direction (m)
d33 piezoelectric strain constant of PZT-5H, the piezoelectric ceramics based on BaTiO3, 593 × 10-12 m·V-1
U applied voltage (V)
 change of fluid volume (m3 )
V initial volume of fluid (m3 )
r inner diameter of piezoelectric ceramic tube (m)
 pressure variation (Pa)
K bulk modulus of elasticity of the fluid, 2.18 × 10⁹ Pa
![]() density of fluid (kg·m-3 )
density of fluid (kg·m-3 )
u velocity (m·s-1 )
p static pressure (Pa)
μ viscosity of fluid (kg·(m·s)-1 )
 surface tension force (N)
surface tension force of the current phase
σ surface tension of bio-ink (N·m-1 )
 volume-averaged density (kg·m-3 )
 density of the current calculated phase in fluid(kg·m-3 )
 density of the other phase in the fluid (kg·m-3 )
 volume of the current calculated phase in the fluid
 volume of the other phase in the fluid
D dimensionless number of droplet deformation
μ1 viscosity of bio-ink (m·s-1 )
Rd radius of droplet (m)
s lower boundary of D
l upper boundary of D
Ca capillary number, a dimensionless number
β ratio of droplet viscosity to air viscosity
γ shear rate of the liquid, i.e., cell-laden bio-ink (s-1 )
Dn nozzle radius of DOD print-head (m)
c1 , c2 correction coefficients: c1= 0:89; c2= 0:90
Appendix A. Supplementary data
Supplementary data to this article can be found online at https://doi.org/10.1016/j.eng.2018.12.009.


 京公网安备 11010502051620号


