

《1. Introduction》
1. Introduction
Metamaterials are rationally designed materials with periodic/ aperiodic structures and unusual physical properties, such as a negative Poisson’s ratio, negative elasticity, negative refractive index, or negative thermal expansion [1–4]. A pentamode material (PM), as one type of metamaterial, is characterized by five eigenvalues of zero, which means that only one direction can bear a load [5]. Experiments have revealed that the Poisson’s ratio of PM structures is 0.5, which is the same as that of fluid. Hence, pentamode structures are sometimes called "metafluids” [6]. Given their particular physical properties of isotropy, a large bulk modulus, a low shear modulus, and a Poisson’s ratio of 0.5, PM structures have been employed in many fields, especially for the applications of acoustic absorbers and cloaking devices [7,8]. In past decades, various PM structures, including diamond, hexagonal, and honeycomb shapes, have been investigated experimentally and theoretically [9–13]. The mechanical and acoustic properties of PM structures have also been investigated [14–16].
Recent studies have explored the acoustic application of PM structures. For example, Cai et al. [17] studied the mechanical properties and acoustic performance of novel PM honeycomb structures with solid bulky weights. Their numerical results indicated that the mechanical properties of PM structures cannot be simply translated to their acoustic properties. Chen et al. [13] designed hexagonal PM structures and used an electrical discharge machining (EDM) technique to fabricate an annular PM cloak machined from an aluminum block. The cloaking performance of the cloak was also demonstrated experimentally. Zhao et al. [16] designed a two-dimensional (2D) honeycomb PM structure using homogenization theory and fabricated a Ti–6Al–4V PM structure using a wire-cut EDM low-speed (WEDM-LS) process. The simulative and experimental results demonstrated that the designed water-like PM structure had an acoustic function. However, the abovementioned traditional manufacturing processes are slow and expensive, which is not beneficial for scaled engineering applications.
Additive manufacturing (AM) technology, a state-of-the-art manufacturing method, is currently popular and has become an important processing method in the last decade for the production of a wide variety of components and complex engineering structures [18,19]. Kadic et al. [14] first fabricated a PM with diamond structures using dip-in direct laser writing (DLW) optical lithography, and found that the mechanical properties of the PM—that is, the ratio of the bulk modulus to the shear modulus—could realistically be made to approach 1000. Schittny et al. [20] further investigated the elastic properties of polymer-based three-dimensional (3D) pentamode metamaterials, and revealed that the Young’s modulus and the shear modulus are both positively correlated with the ratio of the minimal diameter to the lattice constant. However, the mechanical properties of polymeric materials (E = 3 GPa) [21] are greatly inferior to those of metallic alloys such as titanium alloy (Ti–6Al–4V, E = 120 GPa) [22]. Amendola et al. [22] experimentally studied the mechanical response of Ti–6Al– 4V PM diamond structures fabricated by electron-beam melting (EBM) technology; their results showed that the geometry of the PM unit cell and the macroscopic aspect ratio of the lattices influence the lateral and vertical stiffness of PM structures. It is worth mentioning that selective laser melting (SLM) is considered to be one of the most promising AM technologies because it can manufacture near-net shape components with complex geometries directly from loose metal powders [23–26]; thus, SLM is suitable for preparing delicate and intricate metallic PM structures. Hedayati et al. [27] implemented a vector-based energydistribution strategy developed for SLM to additively manufacture Ti–6Al–4V PM diamond structures, and found that the mechanical properties of the PM diamond structures were independent of the relative density (i.e., the ratio of the solid volume to the total volume of a unit cell) and were merely related to the minimal geometry size. Thus, the mechanical and mass-transport properties of PM structures can be decoupled from each other, giving such structures great potential for biomedical application.
In summary, the previous published work revealed that 2D PM honeycomb structures can exhibit promising frequencyindependent acoustic properties. Nevertheless, little work has been devoted to analyzing the effects of the structural parameters of 2D PM structures on the mechanical properties—that is, the elastic modulus and Poisson’s ratio. The relationship between geometric size and mechanical properties is not yet fully understood, especially in terms of the thin walls, which denote the minimal dimension in the PM structures. The effect of multilayer numbers on the mechanical properties of 2D PM structures is still unclear. Due to the limited resources in this project, only static mechanics were investigated by theoretical mechanical calculations, semianalytical finite-element (FE) optimization, and partly experiments verifications. The further dynamic mechanics and yield behaviors were also analyzed in another our publication by fully-coupled simulated and experimental method [28]. The two part works in static and dynamic mechanical analyses, respectively, would improve the comprehensive mechanical research on PM configurations.
This paper extends the acoustic properties of the 2D PM structures presented by Ref. [16] to the static mechanical properties. As previously mentioned, metallic PM structures possess good mechanical properties and are suitable for engineering applications in comparison with polymeric PM structures. Due to its good processability, corrosion resistance, high specific strength, and biocompatibility, Ti–6Al–4V has been widely applied in the field of aerospace equipment and medical implants [29–32]. Therefore, Ti–6Al–4V metallic PM structures were studied in this work. To be specific, the mechanical properties and stress distribution of 2D PM honeycomb structures with different thin wall thicknesses and different layer numbers were investigated by the FE analysis using COMSOL Multiphysics software. The simulated mechanical properties of the PM structures were compared with the experimental testing results, and the reasons for discrepancies between the simulation results and experimental results were explained.
《2. Numerical models》
2. Numerical models
2.1. Computer-aided design model
A 2D PM honeycomb structure and its static mechanical properties were studied in this work; its unit cell shape and dimensional marks are shown in Fig. 1(a). This PM microstructure has two whole star weights, four semi-star weights, two half-length thin walls, two half-thickness thin walls, and four full thin walls. Each weight is connected to three independent thin walls, and the angle between every two thin walls is 120. The length of the unit cell (L ), the height of the unit cell (H ), the length of the thin walls (l ), the thin wall thickness (t ), the length of the star weight edge (w ), the vertical height of the weight center to the edge (h ), the length between two centers of a star weight ( ), and the angle (θ ) have the following mathematical relationship:

《Fig. 1》

Fig. 1. (a) 2D PM unit cell with star weights and thin walls; (b) 3D model of the 4 2 unit cells of the PM structure; (c) schematic diagram of the boundary conditions; (d) characteristic of the displacement map of the PM structures under compression tests calculated by COMSOL Multiphysics; (e) schematic diagram of the relationship of the displacement contour, displacement in the x-direction, and displacement in the y-direction. L: the length of the unit cell; H : the height of the unit cell; w : the length of the star weight edge; l : the length of the thin walls; t : the thin wall thickness; h : the vertical height of the weight center to the edge; : the length between two centers; θ : angle; F : force; Ux : the displacement of the trace surface in the x-direction; Uy : the displacement of the upper plate in the y-direction;  : the average displacement of the trace surface in the x-direction;
  : the average displacement of the upper plate in the y-direction.
When the honeycomb structure is established, θ is fixed at 60. The building direction is set as the z -direction in order to fabricate PM structures with fine surface integrity and without support materials, which can improve the manufacturing quality and reduce the post-treatment steps.
The geometric parameters are as follows: the building thickness Hz in the z-direction is 10 mm, the length of the star weight edge w is 2.25 mm, the height of the weight center to the edge h is 1.3 mm, the length between two centers of the star weight is 5 mm, and the thin wall thickness t is set as a variable. These structural styles were also adopted to analysis the dynamic mechanics and yield behaviors of PM configurations in another relevant work [28].
《2.2. Finite-element model》
2.2. Finite-element model
Simulations of static compression processes were performed to explore how changes in the geometric characteristics of the PM structures—such as the thin wall thickness and layer number— affect the mechanical properties. PM structures usually possess a small ratio of shear modulus G to bulk modulus B (G/B ) meaning that the Poisson’s ratio v of the PM structures is close to 0.5, according to the equation below [33].

In the simulation, which was conducted using COMSOL Multiphysics, the computer-aided design (CAD) model was simplified as a 2D plane structure, as shown in Fig. 1(b). The steady-state solver was added to the solid mechanics module because only the linear elastic stage of the uniaxial compression process was studied in this work. Each PM structure model was placed between two parallel rigid plates, as shown in Fig. 1(c). The contact condition between the plates and the PM model was set at a static friction of 0.15. The displacement of the bottom plate was fixed in all directions, while the top plate moved downward to compress PM structures with a tiny force, F = 10 N. The boundary on the left edge was set as symmetric, while the right middle edge denoted the trace surface.
Recently, Cho et al. [34] studied the microstructural inhomogeneity in SLM-built Ti–6Al–4V and the consequent changes in the elastic modulus, and noted that the elastic modulus of Ti–6Al–4V is approximately 120 GPa, although this value can increase with different types of quenching and aging treatments [35]. Thus, in the material properties, the Young’s modulus of Ti–6Al–4V was manually set to 120 GPa. The material was assumed to have a mass density of 4.42 g·cm-3 and a Poisson’s ratio of 0.34 [22,32]. The computed displacement contour of a PM structure subjected to a compressive load of 10 N is shown in Fig. 1(d), where is the average displacement of the upper plate in the y -direction and is the average displacement of the trace surface in the x -direction. The same methods were also found in recent studies [36–38]. The displacement contour can be divided into an x -direction displacement contour and a y -direction displacement contour by the vector relation, which is convenient for calculating the transverse strain  and longitudinal strain
  (Fig. 1(e)).
The original length and height of the PM structures were measured and marked as  × L and
  ×H , respectively, where and are the column number and layer number, respectively. Thus, the Poisson’s ratio can be calculated using Eq. (3).
《3. Experimental study》
3. Experimental study
《3.1. SLM process》
3.1. SLM process
The powder size distribution of the raw material Ti–6Al–4V is homogeneous, with a particle diameter range (D10–D90) of 27.4–51.1 μm and an average particle size (D50) of 37.4 lm; the material was plasma atomized and produced by Falcon Tech Co. Ltd., China. The morphological characteristics are shown in Fig. 2. It can be observed that this Ti–6Al–4V powder has a narrow particle size distribution and that the particles show a highly spherical morphology, which is suitable for the SLM manufacturing process. The PM structures, with 4 × 4 unit cells, were designed with a unit cell size of 5 mm and thin wall thicknesses of 0.18, 0.25, 0.35, and 0.45 mm, respectively. Ti–6Al–4V PM specimens with a size of approximately 34.64 mm × 60 mm × 10 mm were fabricated using a Renishaw AM250 system consisting of a continuous single-mode ytterbium fiber laser (maximum output of 500 W,  = 1070 nm, beam spot size of approximately 0.075 mm). The experimental protocol is outlined in Section 5. The processing parameters were set as follows: The laser power was 200 W, the layer thickness was 30 μm, the point distance was 75 μm, the exposure time was 50 μs, and the hatch distance was 80 μm.
《Fig. 2》
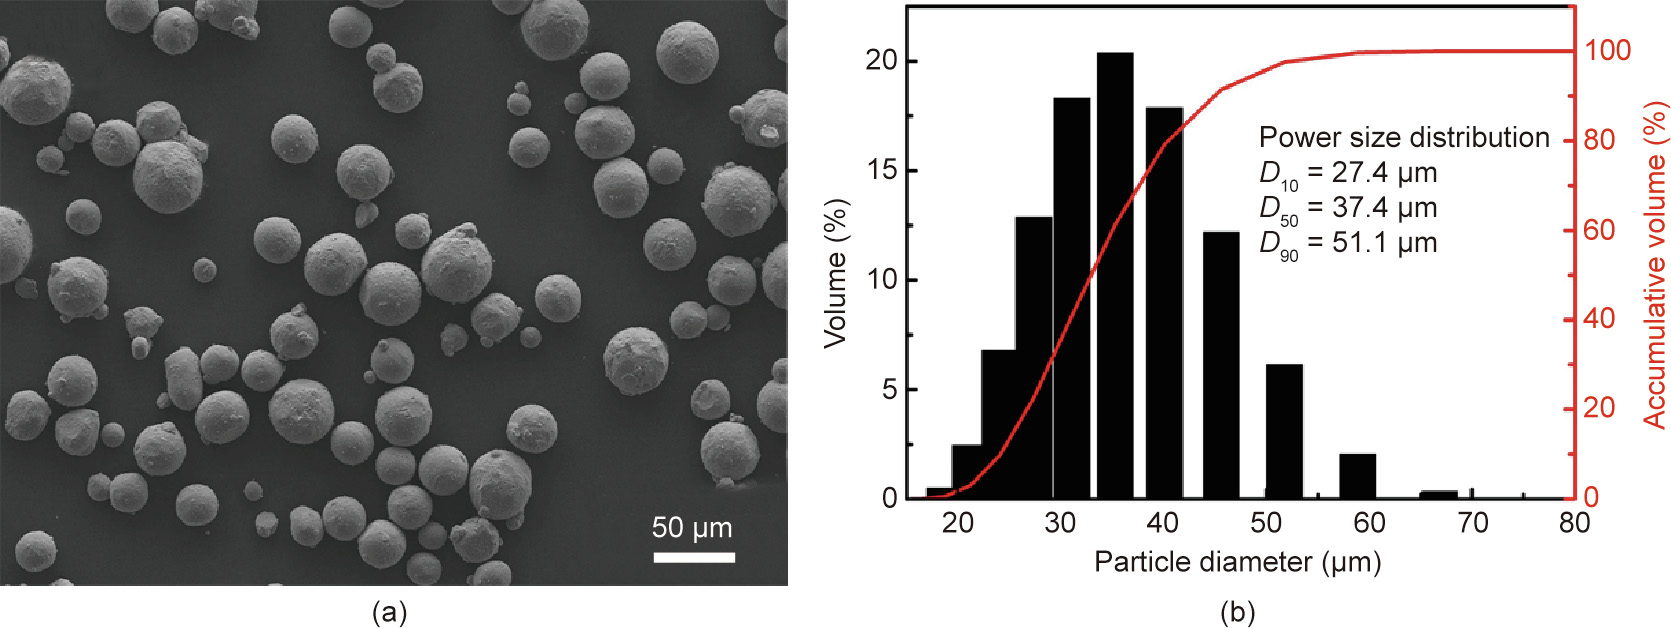
Fig. 2. (a) Scanning electron micrograph of Ti–6Al–4V powder; (b) particle size distribution.
《3.2. Mechanical and morphology characterizations》
3.2. Mechanical and morphology characterizations
Quasi-static uniaxial compression tests were performed at room temperature with a constant engineering strain rate of approximately 1 × 10⁻⁴ s-1 using an INSTRON E8862 testing instrument (Instron Ltd., UK). The vertical displacement and horizontal displacement were captured by an advanced video extensometer (AVE) during the loading process. The real-time image processing algorithm locates the center of four gauge markers, two of which are horizontal markers and two of which are vertical markers. The transverse and longitudinal strains of the specimen are then calculated from the mark separation at the start of the test and the current mark separation. For each specimen, an average value of two independent measurements was used to calculate the strains, which were subsequently used to determine the Poisson’s ratio. The surface morphology of the as-built samples and raw powder features was characterized using scanning electron microscopy (SEM, JSM-7600F) and optical microscopy (OM).
《4. Numerical results and discussion》
4. Numerical results and discussion
《4.1. Effects of the thin wall thickness》
4.1. Effects of the thin wall thickness
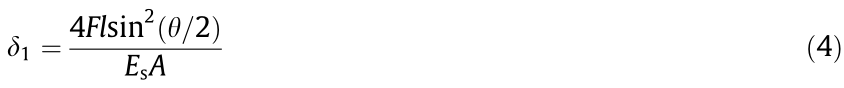
An analytical calculation was conducted in advance of the simulation works to analyze the relationship between the compressive modulus and the thin wall thickness. The schematic in Fig. 3 shows that the PM unit cell is initially supported by a uniaxial compressive load. Let F act as the compressive force. Every diagonal thin wall, such as the AB thin wall, exhibits stretching deformation and bending deformation, which are caused by an axial stress  , and a bending moment M, respectively. The total deformation δ , consists of axial deformation in the x -direction δx and longitudinal deformation in the y -direction δy, exhibits stretching deformation and bending deformation, which are caused by an axial force and a bending moment, respectively. We calculated the total deformation of a PM unit cell in the y-direction, including the deformation of two vertical half-thickness thin walls, two half-length thin walls, and four diagonal thin walls. In the analytical calculation, the deformation of weights was ignored.
《Fig. 3》
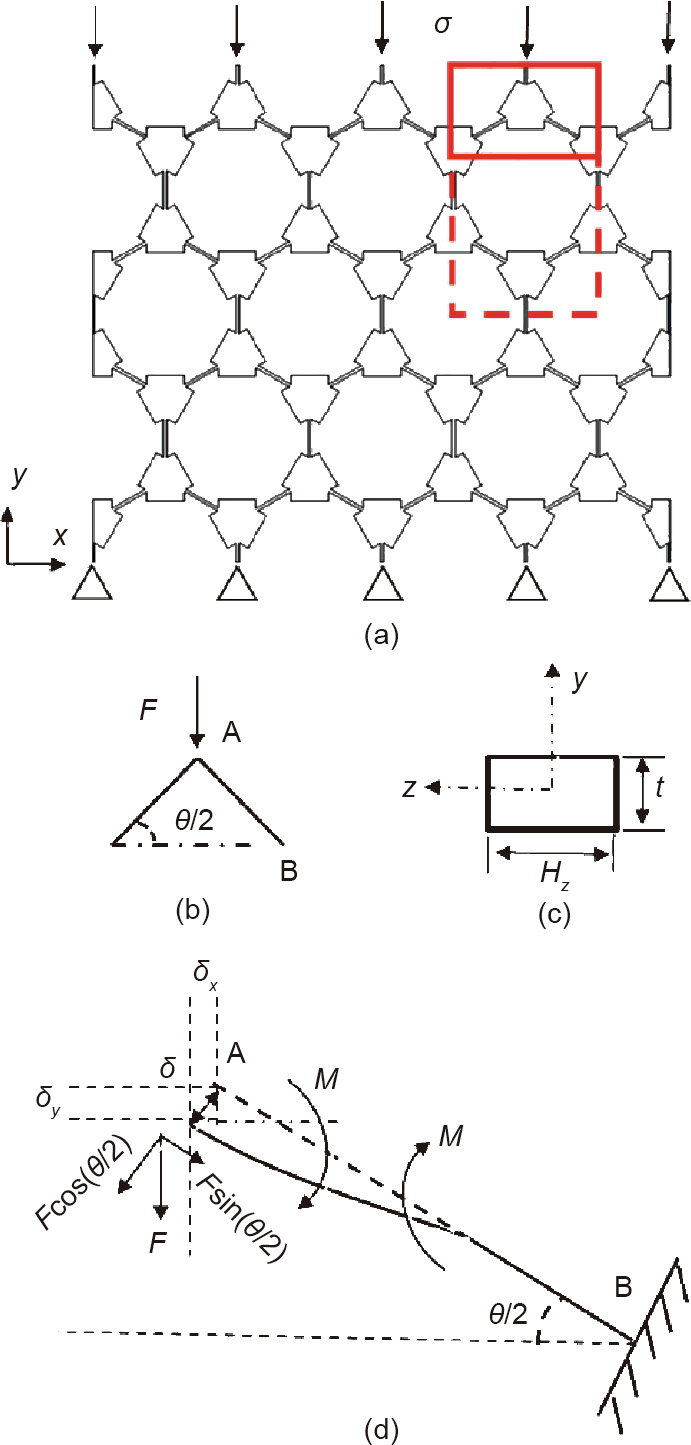
Fig. 3. Schematic of a PM structure loaded in the y -direction. (a) The boundary conditions of the PM structure; (b) the force applied to a third model of a PM unit cell; (c) cross-section diagram of an arbitrary thin wall; (d) diagram of a diagonal thin wall. σ : axial stress; F : the compressive force; AB: a representative diagonal thin wall; M : bending moment; δ : total deformation; δx: longitudinal deformation in the x -direction; δy: longitudinal deformation in the y -direction.
The total deformation along the y -direction consists of three parts. First, the deformation of the diagonal thin walls in the y -direction resulting from the axial force is given by Eq. (4):
where Es is the elastic modulus of the matrix material and A is the cross-section area of the thin walls. Using the Euler‒Bernoulli beam theory to analyze the bending deformation, called the second part, the deflection  of the diagonal thin wall caused by the bending moment is calculated as follows:

where I is the second moment of inertia, which can be expressed as follows for a rectangular cross-section:

Thus, the deformation in the y -direction is obtained by Eq. (7):

Finally, the third part is obtained from the deformation of the vertical half-thickness thin walls and the half-length thin walls in the loading direction, which is given by Eq. (8):

The sum of the deformation of each part in the loading direction is the total deformation of a PM unit cell obtained by Eq. (9):

Under compression, the stress–strain relationship for a PM unit cell can be shown as follows:

where the 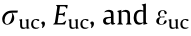 are the stress, elastic modulus, and strain of a PM unit cell, respectively.
The compression stress of a PM unit cell is obtained as follows:

The compression strain of a PM unit cell can be calculated by dividing the deformation of the unit cell in the y-direction by the height of the PM unit cell:

The total deformation of a PM unit cell is obtained by Eq. (13):

Taking Eqs. (9) and (13) together, the ratio of the elastic modulus of the PM unit cell to the elastic modulus of the parent materials is shown as follows:

Substituting the value of θ , the following equation is obtained:

Using Eq. (15), it can be determined that the compressive moduli of the PM structures correlates well with t/l . The analytical relationship between the thin wall thickness and the compressive modulus is shown in Fig. 4 as the blue curve. It is theoretically verified that the compressive modulus of the PM structures is closely associated with the minimal geometric size in PM structures, which was also demonstrated by Hedayati et al. [27].
《Fig. 4》

Fig. 4. Plots and comparison of calculated and simulated compressive modulus of PM structures with various thin wall thicknesses, along with the Poisson’s ratio versus thin wall thickness.
In Fig. 4, the compressive moduli of the PM structures gained by the FE results were compared with those of the analytical results. It is worth noting that the compressive moduli obtained from the FE results and the analytical results both increase monotonically as the thin wall thicknesses increase and are in good agreement with each other, with deviations under 25%. The distinction between them is that the theoretical calculation ignored the weights in which plastic hinges can more easily form under load conditions. In addition, the analytical compressive modulus of a PM unit cell is derived based on the assumption of a finite space in which there are no constrained boundary conditions from one unit cell to another. They are only effective for a single unit cell. As there are numerous unit cells, the mechanical properties of multilayer lattices differ from those of traditional single-unit cells. Li et al. [39] revealed the relationship between a single unit cell and numerous unit cells to predict the compressive modulus and strength of a multilayer lattice. Thus, the results of the analytical calculations are inevitably different from those of the simulations. As the thin wall thicknesses increase, the constraints between the unit cells are more significant; therefore, the blue and black curves have a tendency to diverge.
The red curve in Fig. 4 also shows the influence of the thin wall thicknesses of the PM structures on the Poisson’s ratio. It is intuitively seen that the Poisson’s ratio continues to descend as the thin wall thickness increases from 0.15 to 0.45 mm. The blue and red curves intersect at a point that corresponds to the horizontal ordinate, x = 0.35 mm. When the thin wall thickness varies from 0.15 to 0.35 mm, not only do the PM structures have higher strength to resist deformation compared with normal PM structures [22,27], but their Poisson’s ratios also does not get much lower than 0.5.
Fig. 5 shows the computed displacement maps of the PM structures with different thin wall thicknesses for the deformation of the x -direction and y -direction. The level of deformation is lowest for the PM structure with a thin wall thickness of 0.45 mm and highest for the PM structure with a thin wall thickness of 0.18 mm. The compressive modulus gradually increases when the thin wall thickness increases from 0.18 to 0.45 mm. This phenomenon corresponds with the analytical results. Fig. 5(a) also shows that a relatively large deformation occurs on the upper half of the PM structure in the y -direction, while the maximum deformation occurs on the right side of the middle part in the x -direction. As a result, the horizontal and longitudinal deformations show an apparent lamination phenomenon, which is represented by short dashed lines. For PM structures with different thin wall thicknesses, the deformation levels of the same zone differ, which illustrates the effect of geometrical characteristics—especially thin wall thickness—on the mechanical properties. A similar result was observed in the layered pentamode structures designed by Amendola et al. [40]. They concluded that the mechanical properties of pentamode lattice structures primarily depend on the geometry of the unit cell—even more than on the nature of the employed materials.
《Fig. 5》

Fig. 5. Variation of the displacement of the designed PM structures along the x -direction and y -direction with different thin wall thicknesses t : (a) t = 0.18 mm; (b) t = 0.25 mm; (c) t = 0.35 mm; and (d) t = 0.45 mm.
《4.2. Effects of the layer number》
4.2. Effects of the layer number
Fig. 6 summarizes the plots of the simulation results for layer number versus Poisson’s ratio (Fig. 6(a)) and versus the compressive modulus of the PM structures (Fig. 6(b)). In Fig. 6(a), for PM structures with different thin wall thicknesses, all the plotted curves of layer number versus Poisson’s ratio exhibit a sharp rising trend when the number of layers increases from one to three. After three layers, the Poisson’s ratio of the PM structures progressively tends toward a stable value ranging from 0.50 to 0.55. The two parameter combinations for closing to a 0.50 Poisson’s ratio are as follows: 0.25 mm thickness with 4 × 3 unit cells and 0.35 mm thickness with 4 × 4 unit cells (for a Poisson’s ratio of 0.51 and 0.50, respectively); these combinations are respectively referred to as "4 × 3–0.25” and "4 × 4–0.35” in this section. The structure with thickness of larger than 0.35 mm would not be considered to construct the PM due to weaken pentamodal property based on the result of Section 4.1.
《Fig. 6》
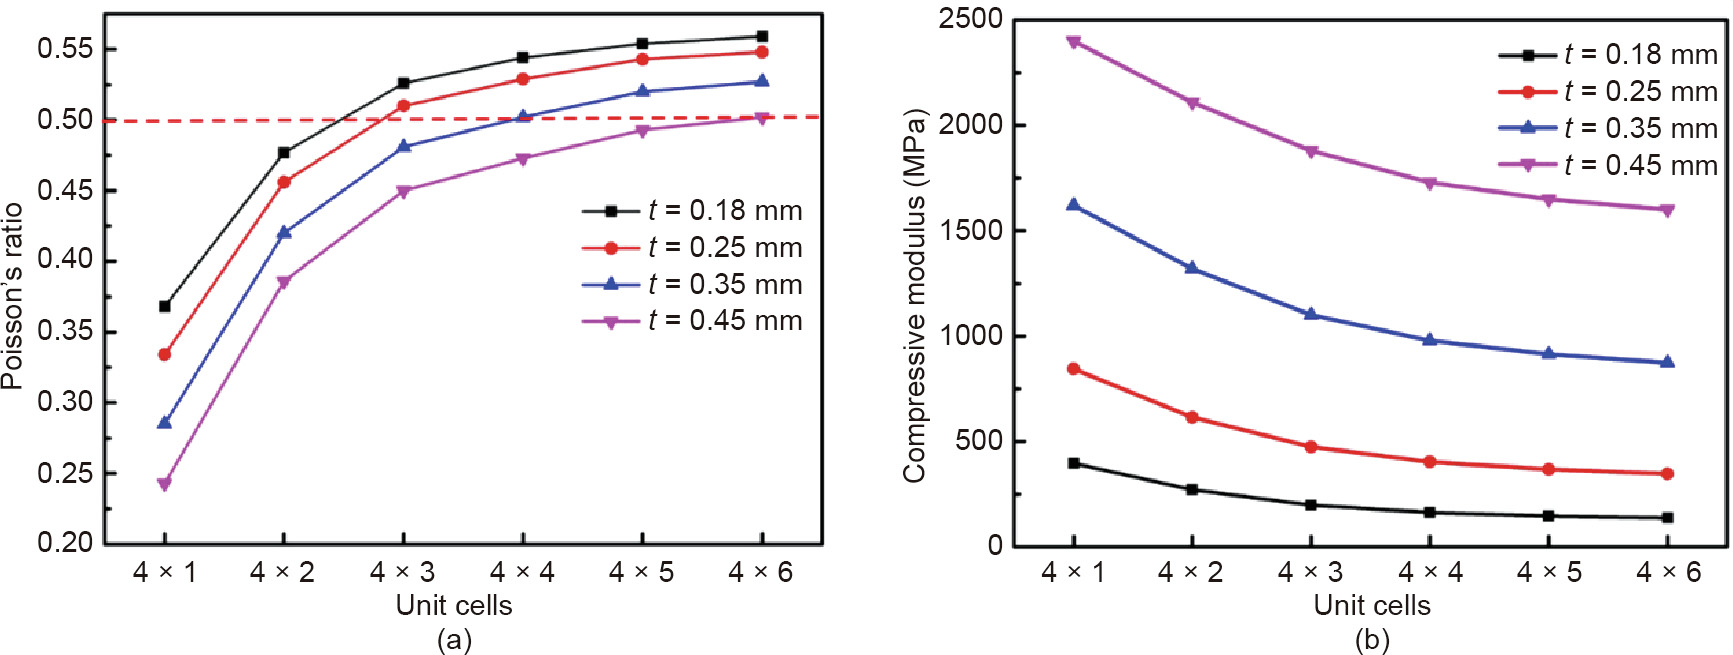
Fig. 6. Effect of layer number on (a) Poisson’s ratio and (b) compressive modulus for different thin wall thicknesses.
Fig. 6(b) plots the layer number versus the compressive modulus curves obtained from the FE results. The curves have a downward trend as the layer number increases. In other words, an increase in the layer number of the PM structure will sacrifice the integral structural strength to some extent. This is because, for finite unit cells, the interlayers are the main component parts to resist external forces, aside from the constrained boundaries. Furthermore, as the layer number increases, the freedom of the interlayered thin walls and weights decreases by degrees, resulting in a decrease in the compressive modulus.
Further investigations of two sets of parameters are needed. Fig. 7 shows the computed deformation maps of the PM structures with the above parameters. In order to compare the strength of resistance to deformation between different structures, the normalized deformation is defined and compared by dividing the maximum deformation by the number of cells. It can be calculated that the normalized deformation peak of 4 × 3–0.25, at 5.1 × 104 mm·cell-1 and 3.2 × 104 mm·cell-1 , is more than double that of 4 × 4–0.35, at 2.2 × 10⁻⁴ mm·cell-1 and 1.0 × 104 mm·cell-1 . The deformation contours have the same tendency to vary the displacement level within the PM structure. Therefore, the latter has a higher capacity to resist deformation than the former. Considering the compressive strength related to the thin wall thicknesses, in Fig. 6(b), the compressive modulus of 4 × 4–0.35 is higher than that of 4 × 3–0.25. Thus, it can be determined that the PM structure with four layers and a thin wall thickness of 0.35 mm theoretically possesses both a Poisson’s ratio
of 0.5 and a higher load-bearing capacity.
《Fig. 7》

Fig. 7. Comparison of displacement contours for (a) a layer number of three and a thin wall thickness of 0.25 mm, and (b) a layer number of four and a thin wall thickness of 0.35 mm.
《4.3. Stress distribution》
4.3. Stress distribution
In the mechanical simulations, we monitored the change in the stress distribution in the PM structures. The CAD simulation models were as follows: two layers and thin wall thicknesses of 0.18 mm, three layers and thin wall thicknesses of 0.25 mm, and four layers and thin wall thicknesses of 0.35 mm, named P-1, P-2, and P-3, respectively.
Fig. 8 depicts the Von Mises stress distribution in the thin wall zone of the PM structures with the P-1, P-2, and P-3 models under a compressive load. It shows that, overall, the thin walls are the main load-bearing element, while the stress at the weights is nearly zero. For the stress distribution of the thin wall zone, the stress distribution of the thin walls is approximately axisymmetric, and the symmetry axis is perpendicular to the thin walls. The maximum stress of the PM unit cell is concentrated at the junctions of the weights and the diagonal thin walls. Thus, the fracture mechanism of the PM structures in an engineering context could be a buckling failure occurring primarily at the diagonal thin walls, caused by a large plastic deformation that would give rise to buckling. This phenomenon was also observed in the gyroid lattices studied by Yang et al. [41] using the FE analysis. Those scholars proposed that reinforcement could be used in the area with the highest stress. Furthermore, for the same area, the local stress of P-3 is lowest in comparison with the others.
《Fig. 8》

Fig. 8. Stress distribution under a compressive load. (a) P-1 structure with two layers and thin wall thicknesses of 0.18 mm; (b) P-2 structure with three layers and thin wall thicknesses of 0.25 mm; (c) P-3 structure with four layers and thin wall thicknesses of 0.35 mm.
To thoroughly understand the stress distribution in the PM structures, the quantitative results of the Von Mises stress at different zones are reported in Table 1 for P-1, P-2, and P-3. The average stress is the arithmetic mean value of the Von Mises stress in the same zone; that is, the weight average stress is the arithmetic mean value of the stress of all weights in the PM structure, which was extracted from the FE analysis. For all structures, the average stress at the thin walls is much higher than that at the weights; the latter remains approximately constant in different PM structures. The average stresses of the first layer and diagonal thin walls are superior to those of the layers below and the vertical thin walls. For example, the first layer average stress of the P-1 structure, 20.77 MPa, is 19.85% higher than the second layer average stress, 17.33 MPa. The average stress of the diagonal thin walls for the P-1 structure, 26.96 MPa, is approximately three times that of the vertical thin walls, 9.02 MPa. It can be concluded that the diagonal thin walls located in the first layer are more likely to break in the PM structures when subjected to a compressive load. The variation of stress in different PM structures is mainly caused by different layer numbers and thin wall thicknesses.
《Table 1》
Table 1 Numerical results of average Von Mises stress for different zones in PM structures.

《5. Experimental results and discussion》
5. Experimental results and discussion
The purpose of the experiments was to verify the results obtained from the FE analysis. Instead of using the experiments as a primary means of studying the mechanical properties of the PM structures, the experiments were performed to validate the primary factors—especially the effect of the thin walls on the static mechanical properties.
We fabricated 4 × 4 PM unit cells (Fig. 9) with different thin wall thicknesses using SLM in order to study the mechanical properties. The thin wall thicknesses in the PM structures were 0.18, 0.25, 0.35, and 0.45 mm, respectively, which can be consistent with our previous work on dynamic mechanical properties [28]; for each PM structure, two specimens were fabricated and tested to verify the repeatability of the performed experimental results. The embedded OM images at the bottom of Fig. 9 show that the as-built PM specimens corresponded well with the intended designs, without apparent defects or broken cells. Four points marked in white in the PM samples were used to determine the transverse strain and longitudinal strain by AVE (Fig. 10(a)). The distance between two horizontal markers was 17.32 mm, while the distance between two vertical markers was 25 mm. The specific setup of the compression tests is shown in Fig. 10(b).
《Fig. 9》

Fig. 9. SLM-built samples; the embedded figures are OM images corresponding to the different PM samples.
《Fig. 10》
Fig. 10. (a) SLM-built sample. (Four points marked in white were used to determine the transverse strain and longitudinal strain.) (b) Experimental setup of quasi-static uniaxial compression tests.
The stress–strain curves of the PM samples with different thin wall thicknesses are depicted in Fig. 11(a). However, there is an initial nonlinear strain stage, which is ascribed to the rough surface of the top. Then, the linear strain stage is achieved. The compressive modulus is defined as the slope of the linear part of the stress– strain curve. As shown in Fig. 11(b), the compressive modulus of the experiments ranges from 163.63 to 1556.07 MPa, and the simulated compressive modulus ranges from 98.2 to 1340 MPa. It can be observed that the compressive modulus of the PM structures has a monotonically increasing trend with thin wall thicknesses ranging from 0.18 to 0.45 mm under uniaxial compression tests. The experimental compressive moduli are slightly higher than those of the simulations. In Fig. 11(c), it is clearly seen that the Poisson’s ratio of the experiments, which ranges from 0.42 to 0.35, is slightly lower than that of the simulations, which ranges from 0.54 to 0.47.
《Fig. 11》

Fig. 11. (a) Stress–strain curves of the PM samples; (b) experimental compressive moduli compared with those of the simulations (the error bar is the standard deviation); (c) comparison of the Poisson’s ratio of the FE analysis and the experiments; (d) comparison of the mechanical performance of various PM structures and lattice structures [27]. E *: the elastic modulus of the PM structure; ρ*: equivalent density of the PM structure; ρs: density of fully dense solid material; DH: the diameter of high-energy density; DL: the diameter of low-energy density; FGPS: functionally graded porous scaffold.
The variation of the relative elastic modulus of the PM structures with relative density is shown in Fig. 11(d). In view of the good agreement between the SLM-built samples and the CAD model, when calculating the relative density, we only calculated the theoretical value of the CAD model’s relative density. The calculation equation is shown as follows:
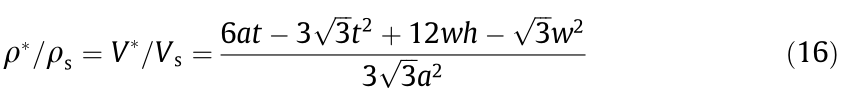
where V * and Vs are the volume of the as-designed PM lattice structure and the volume of the square area occupied by the PM structure, respectively; ρ* and ρs are equivalent density of the PM structure and density of fully dense solid material, respectively.
Taking the values of w, h, t, and l into the equation, the theoretical relative density for the PM structures with thin wall thicknesses of 0.18, 0.25, 0.35, and 0.45 mm are 0.2222, 0.2296, 0.2399, and 0.2581, respectively. In general, the relative elastic modulus is defined by the ratio of the elastic modulus (E *) of the PM structure to the elastic modulus (Es) of the parent material. Ref. [27] noted that diamond PM structures decouple the relative elastic modulus with relative density. Similarly, the 2D PM honeycomb structures with different thin wall thicknesses show approximately the same relative density; however, the relative elastic modulus of the PM structures increases gradually with increasing thin wall thickness. In addition, the relative elastic moduli of the 2D PM structures are approximately two orders of magnitude higher than those of 3D PM structures [27], and are equal to those of traditional lattice structures, such as the structures by the Schwartz diamond [42] and the Gyroid unit cell [43], which are basically in accordance with the Gibson–Ashby model [44].
The compressive moduli and Poisson’s ratios from the FE analysis were slightly lower and higher, respectively, than those from the experiments, which can be attributed to the adhered powder particles on the thin walls. The simulations did not capture microscopic defects and dimensional errors, such as adhesive powder particles, which can increase the thin wall thickness and can be observed in the SEM images of the PM structures (Figs. 12(a–d)). The thin wall thicknesses of the as-built SLM samples were slightly higher than the designed value, with deviations of approximately 30 μm. The increased thickness of the thin wall could enhance the load-bearing capacity, which is also positively correlated with the compressive modulus of the PM structure. The compressive stiffness of the experiments would then be higher, resulting in smaller deformation in the loading direction. Thus, the experimental Poisson’s ratio would be lower than that of the FE analysis. More accurate prediction models can be obtained through equivalent wall thickness or reconstruction of the as-built model. The former has been partly proved in another our work [28], while the latter is rarely used due to the huge computational cost.
《Fig. 12》

Fig. 12. SEM micrographs of PM structures with different thin wall thicknesses: (a) t = 0.18 mm; (b) t = 0.25 mm; (c) t = 0.35 mm; and (d) t = 0.45 mm. (e) Comparison of designed thin wall thickness with the thin wall thicknesses of the as-built model.
The SLM processing conditions at the thin wall parts are significantly different from those of the bulk components. First, the specific surface area (the ratio of surface area to whole volume) of the PM structures is lower than that of the bulk components under the same whole volume. In the SLM process, the laser interacts with the metal powder to form a molten pool, which is surrounded by the heat-affected zone (HAZ). The higher the specific surface area of the model is, the more adhered particles there are [45]. PM structures with through-holes easily form sticky powder. Second, under the same SLM process parameters, the thin wall parts have a higher laser energy input compared with the bulk components, which is ascribed to the fact that the thermal conductivity of the powder is lower than that of the bulk component of the same material. The PM structures with thin walls have more heat accumulated in the molten pool, resulting in better fusion and a larger temperature gradient [41]. Thus, the modulus of solid material in the thin wall zones is likely to be larger than the assumed values (in the simulation, we assumed that the elastic modulus of Ti–6Al–4V was 120 GPa).
In summary, the influence of the geometric characteristics of PM structures on the mechanical properties can be utilized to design PM structures with customized mechanical properties by adjusting the thin wall thickness and layer number. Morphological observations were used to unravel the differences between the experiments and simulations of the mechanical properties. This study will pave the way for the AM of PM structures with simultaneous pentamodal properties and load-bearing capacity via SLM.
《6. Conclusions》
6. Conclusions
In this work, a honeycomb unit cell was used to rationally design pentamode lattice structures. Ti–6Al–4V PM structures with different thin wall thicknesses were manufactured by SLM. The mechanical properties of the Ti–6Al–4V PM structures with different thin wall thicknesses and layer numbers were studied by the FE analysis and by using partial quasi-static compression tests.
(1) A calculated analysis was used to examine the relationship between the geometric size and the compressive modulus, which indicated that the thin wall thickness was the key dimension affecting the mechanical properties. The effect of thin wall thickness and layer number of PM structures on the mechanical properties obtained by FE analysis showed that the compressive modulus and Poisson’s ratio of the PM structures increases and decreases, respectively, with thin wall thicknesses ranging from 0.15 to 0.45 mm.
(2) The stress distribution obtained from the FE results showed that each unit cell has almost the same distribution. The Von Mises stress level was lowest at the weights and highest at the junction of the weights and thin walls, indicating that the junction of the weights and thin walls has a tendency to form stress concentration; thus, reinforcement should be used here. Moreover, the maximum stress differed for different thin wall thicknesses and layer numbers of the PM structures.
(3) From the stress–strain curves of the PM samples under quasi-static compression tests, the obtained compressive modulus values were slightly higher than those of the FE results, and the experimental Poisson’s ratio values were slightly lower than the results of the simulations. This can be attributed to the presence of adhered powder particles, resulting in an increase in the mechanical properties. Despite the deviations, it was demonstrated that 2D PM honeycomb structures decouple the relative elastic modulus with relative density and have a load-bearing capacity approximately two orders of magnitude higher than that of diamond PM structures.
《Acknowledgements》
Acknowledgements
This work was sponsored by the National Natural Science Foundation of China (51775208), the Hubei Science Fund for Distinguished Young Scholars (0216110085), the National Key Research and Development Program (2016YFB1100101), the Wuhan Morning Light Plan of Youth Science and Technology (0216110066), and the academic frontier youth team (2017QYTD06 and 2018QYTD04) at Huazhong University of Science and Technology (HUST). The authors thank the Analytical and Testing Center of HUST for SEM examination and the State Key Laboratory of Materials Processing and Die & Mould Technology for compression tests.
《Compliance with ethics guidelines》
Compliance with ethics guidelines
Lei Zhang, Bo Song, Ruijie Liu, Aiguo Zhao, Jinliang Zhang, Linrong Zhuo, Guiping Tang, and Yusheng Shi declare that they have no conflicts of interest or financial conflicts to disclose.


 京公网安备 11010502051620号


