

《1. Introduction》
1. Introduction
Soil and water are essential natural resources for agricultural practices. In highly urbanized areas, pollution from anthropogenic activities has compromised the integrity of agricultural lands and the water streams, leading to decreased soil functionality and food safety concerns. Regions such as North Africa and South Asia have used more than 90% of the available land [1]. In China, the use of polluted water for soil irrigation has resulted in soil pollution [2]. Soil bioremediation can help to restore land for reutilization and crop production. Bioremediation uses microbial metabolisms for the removal of contaminants from the environment [3,4]. Polycyclic aromatic hydrocarbons (PAHs) are a typical class of contaminants from anthropogenic activities [2]. Dibenzothiophene (DBT) is a major sulfur-containing PAH [5] and is often used as a model chemical to assess PAH soil contamination [5]. DBT is a hydrophobic compound with a water solubility of 7.9 μmol·L-1 and an octanol–water coefficient of 4.44 [6]. The lipophilic nature of DBT allows it to concentrate in the environment and bioaccumulate through the food chain, giving it both a food safety and ecotoxicological risk [7]. Dose-dependent exposure of DBT to zebrafish embryos was found to disrupt cardiac function, with higher doses being associated with morphological abnormalities and mortality [6]. One study showed that DBT and its metabolites act as estrogenic compounds in T47D human breast adenocarcinoma cells [8]. The high detection frequency of DBT in sediments and urbanized areas, the potential for human exposure, and the health threat make it a chemical of concern; thus, DBT needs to be environmentally managed [5,8].
Bioremediation of hydrophobic pollutants such as DBT is frequently limited by the low abundance of microorganisms and by poor chemical bioavailability, resulting in low biodegradation kinetics [9]. In addition to catabolic enzymes [10–12], the intentional augmentation of contaminated soil with microorganisms adept at producing biosurfactants [13,14] is a method to improve chemical solubilization and bioavailability [15,16]. The production of both biosurfactants and catabolic enzymes in bacteria [17–20] suggests an evolutionary adaptation by microorganisms to overcome low substrate availability.
Burkholderia sp. C3 is a PAH-degrading bacterium isolated from a PAH-polluted site [21]. It contains dioxygenase genes responsible for degrading PAHs such as phenanthrene [22,23]. This study was designed to investigate glycerol as a co-substrate to stimulate the strain C3 to degrade DBT. Our preliminary studies indicated that glycerol can enhance the biodegradation of DBT, unlike other substrates tested (e.g., glucose). Apparent DBT solubilization, foam formation, and earlier DBT degradation by C3 were observed during the cultivation process when glycerol was supplemented. This was not observed in cultures supplemented with DBT alone. Such a difference suggested the secretion of a surfactant agent. Glycerol readily enters into the lipid metabolic pathway of b-oxidation and de novo fatty acid synthesis (FAS II), affecting the production of rhamnolipid (RL) biosurfactants and polyhydroxyalkanoic acids (PHAs) [24,25]. There have been few reports on RLs produced by Burkholderia sp. To our knowledge, this is the first report on a direct association between RL biosynthesis and DBT biodegradation induced by glycerol. Our studies indicated that biostimulation with glycerol can lead to the effective degradation of DBT in the environment by increasing the bioavailability of hydrophobic contaminants. The technology investigated in the present study may therefore be applicable to the bioremediation of hydrophobic contaminants such as pesticides.
《2. Materials and methods》
2. Materials and methods
《2.1. C3 cultivation and DBT biodegradation》
2.1. C3 cultivation and DBT biodegradation
Test tubes were baked at 450 °C for 3 h. DBT dissolved in acetone was placed in a test tube, followed by complete evaporation of acetone under nitrogen (N2) gas. Next, 5 mL of minimal medium (MM) [26] and an appropriate volume of 50% aqueous glycerol solution were added. The final concentration of DBT was 0.54 mmol·L-1 (100 ppm (1 ppm = 10-6 )), while the final concentration of glycerol was 0, 0.05, 0.5, 5, 50, 200, or 500 mmol·L-1 . C3 cells grown overnight in Luria–Bertani (LB) rich medium at 30 °C were washed three times with MM and adjusted to an optical density at 600 nm (OD600) of 0.5 in MM, of which 0.5 mL were inoculated to each of the tubes at a concentration of approximately 0.05 OD600. Cultures with glycerol but without DBT were also prepared. In the RL biosynthesis inhibition experiments, the final concentration of each 2-bromohexanoic acid (HEX) and 2-bromooctanoic acid (OC) was 2 mmol·L-1 . Cultures were incubated in a rotary shaker at 30 °C at 200 revolutions per minute. Autoclaved C3 cells were used as controls.
《2.2. Extraction and analysis of DBT》
2.2. Extraction and analysis of DBT
DBT was extracted and analyzed according to Ref. [27]. To summarize, after the culture was acidified to approximately pH 2–3 with HCl, DBT was extracted with ethyl acetate three times. The DBT was then analyzed on an Agilent 1100 series highperformance liquid chromatograph (HPLC) equipped with an Aqua C18 column (150 mm × 4.60 mm, 5 lm particle size; Phenomenex, Inc., USA) and detected at 245 nm. The mobile phase was 60% aqueous acetonitrile (ACN).
《2.3. Data calculation》
2.3. Data calculation
Time course points were drawn with standard errors of the mean bars representing variations among three or six biological replicates. Degradation curves were fitted with a first-order kinetic equation, C = C0 × e-kt , where k is the DBT biodegradation rate constant and C is the concentration measured at time t , and C0 is the initial concentration (Table 1). The DBT half-life (t1/2) was calculated using (t1/2 = (ln 2)/k . Statistical tests were done with IBM SPSS Statistics 19. The tests performed were Tukey’s honestly significant difference (HSD), least significant difference (LSD), and Bonferroni.
《Table 1》
Table 1 Enhancement of biodegradation rate constant and half-life of DBT is dependent upon glycerol concentrations.

Exponential decay equation, C =C0 × e-kt was used for fitting “N ” data points where k is rate constant and t is time in day; R2 is the coefficient of determination.
a Relative to rate constant of 0.5 mmol·L-1 DBT.
b Biostimulation at these glycerol concentrations was statistically significant (Tukey HSD; LSD; Bonferroni; P < 0.001).
《2.4. Protein extraction》
2.4. Protein extraction
C3 cells were collected from cultures at day 2 and washed three times with filtered and sterilized distilled water followed by protein extraction, according to the reported method [28] with slight modifications. A lysis buffer was prepared by mixing 9 mL of a 9 mol·L-1 urea solution with 1 mL of 10× protease inhibitor solution. Protease inhibitor solution was prepared from Sigma fast protease inhibitor tablets (Sigma-Aldrich, USA). After complete removal of the medium by centrifugation at 5850g (g = 9.8 m·s-2 ), cell pellets were re-suspended in 700 μL of lysis buffer. This cell suspension was added to 300 μL of lysis buffer solution in a screw-cap vial that was 2:3 prefilled with 0.5 mm (diameter) glass beads (BioSpec Products, USA). Cell membranes were disrupted by six cycles of bead-beating at maximum speed for 60 s on a minibeadbeater (BioSpec Products, USA) and on ice for 60 s. After cell debris removal by centrifugation at 20 820g for 15 min, the supernatant was run through an Amicon Ultra-0.5 mL centrifugal filter (3 K cutoff; Millipore, USA) to concentrate proteins on the filter. The filter was then washed with 500 μL of Milli-Q (mQ) water.
《2.5. Protein sample preparation for liquid chromatography mass spectrometry analysis》
2.5. Protein sample preparation for liquid chromatography mass spectrometry analysis
A protein amount of 36 μg was loaded onto a 12% sodium dodecyl sulfate-polyacrylamide gel electrophoresis (SDS-PAGE). The gels were stained with Coomassie blue to visualize the protein bands. Each gel lane was fractionated (approximately 1 mm3 ) and washed with 25 mmol·L-1 ammonium bicarbonate (NH4- HCO3)/50% ACN until the pieces became clear. Gel pieces were dehydrated with 100% ACN prior to dithiothreitol reduction at 56 °C for 30 min and iodoacetamide alkylation at ambient temperature for 20 min. In-gel protein digestion was done with Trypsin/ Lys-C Mix (Mass-Spec Grade, Promega, USA) at 37 °C for 16– 18 h. Protein digests were desalted and concentrated with Pierce C18 tips (Thermo Scientific, USA), and then analyzed on a Bruker nanoLC-amaZon speed ion trap mass spectrometer (MS) system. The peptides were separated on a C18 analytical column (0.1 mm × 150 mm, 3 μm, 200 Å, Bruker, USA) with a gradient elution from 5% to 65% ACN in 0.1% formic acid for 80 min after a 2 min running delay. After 90 min of elution, the mobile phase was changed to 95% ACN containing 0.1% formic acid and remained as such for 10 min, followed by column equilibration with 5% ACN containing 0.1% formic acid for 20 min for the next run. The flow rate was 800 nL·min-1 . The MS parameters were set at a capillary voltage of 1600 and a capillary temperature of 149.5 °C. A survey scan from mass-to-charge ratio (m/z) 400 to 3000 was followed by datadependent tandem mass spectrometry (MS/MS) of the 10 most abundant ions and 0.5 Da instrument error. Dynamic exclusion was set to repeat the same precursor ion twice, followed by excluding it for 0.8 min.
《2.6. Protein database and database search》
2.6. Protein database and database search
Raw files (file type BAF) were converted to mascot generic format (.mgf) with DataAnalysis software (Bruker, USA). The peak picking algorithm was Apex. The absolute intensity threshold was set to 100.
The canonical and isoform protein sequence (492 entries) database was in FASTA format and was downloaded from the UniProt Knowledgebase (4 April 2016 at 9:35 a.m.). The database was constructed by using Burkholderia (UniProt taxonomy: 32008) as the fixed search term and the different protein names as the variable terms. The database search was performed with the MyriMatch search engine [29]. The configuration was as follows: instrument type as ion trap, precursor mass as auto, enzyme as trypsin/P (allowing identification of Trypsin/Lys-C Mix digests), average precursor tolerance 1.5 m/z, fragment tolerance at 0.5 m/z, and mono precursor tolerance at 10 ppm. The modifications were as follows: carbamidomethyl (fixed) and methionine oxidation (variable).
《2.7. Data normalization》
2.7. Data normalization
Spectral counts of the proteins identified in each treatment were obtained with IdPicker software. The treatments were as follows: (A) 0.54 mmol·L-1 DBT; (B) 50 mmol·L-1 glycerol; (C) 50 mmol·L-1 glycerol and 0.54 mmol·L-1 DBT; and (D) 50 mmol·L-1 glycerol, 0.54 mmol·L-1 DBT, and 2 mmol·L-1 OC. The filters to match the peptide to its MS/MS spectra were as follows: a maximum false discovery rate (FDR) of 1% and a minimum of one spectrum per peptide and per match. In order to match peptides to proteins, a minimum of two distinct peptides and spectra and two minimum additional peptides were allowed [30,31]. Data were normalized according to the assumption in Ref. [32]—namely, that MS/MS intensities are equal to 1 and without considering the peptide length. A log(normalized count + 1) was applied and the normalized data was compared with the raw data. An analysis of variance (ANOVA, p-value < 0.05) was done to search for protein abundance changes with statistical significance using DEseq [33]. The p-value and log Fold change (FC) of the glycerol × DBT interaction term were calculated and are shown for each protein in Table 2. The log FC represents the effect size of the glycerol × DBT interaction term. When the log FC was upregulated, it indicated that the glycerol × DBT interaction had a positive effect on the protein abundance of the treatments that contained this interaction (i.e., treatments (C) and (D)).
《Table 2》
Table 2 Proteins identified mediating RL biosynthesis in Burkholderia sp. C3 at day 2 of incubation.
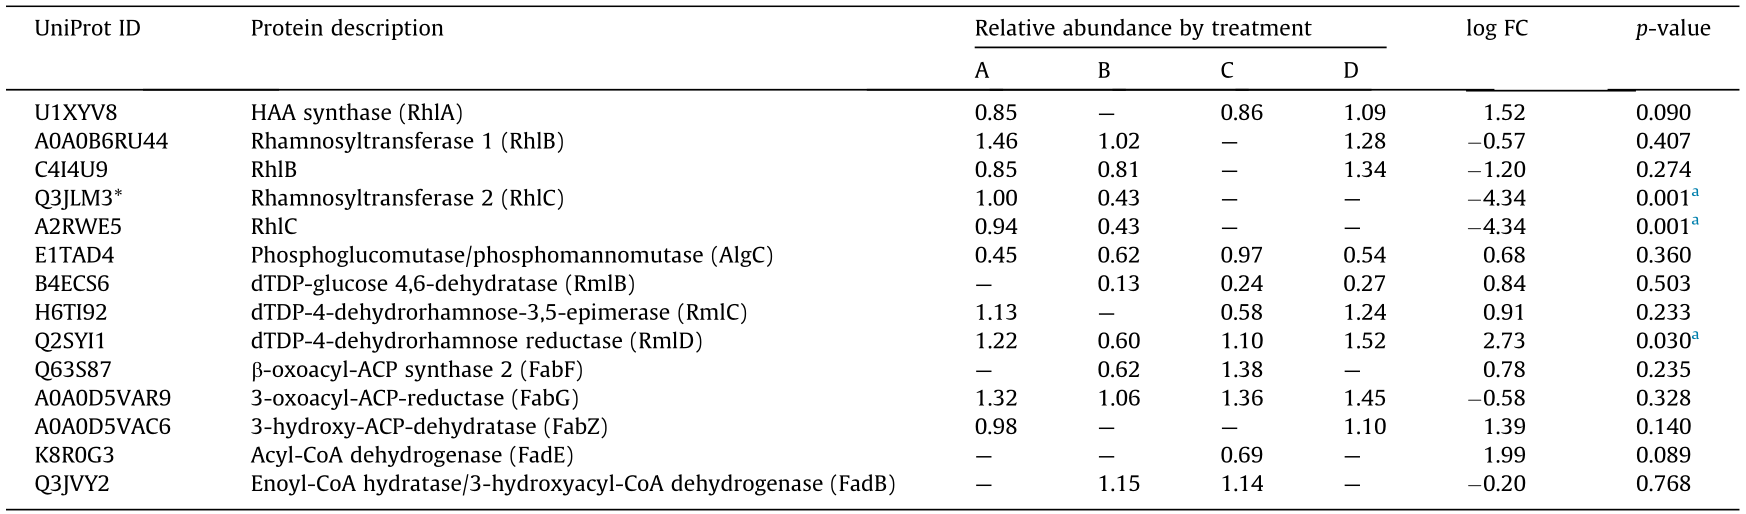
Treatments were A: 0.5 mmol·L-1 DBT; B: 50 mmol·L-1 glycerol; C: 50 mmol·L-1 glycerol and 0.5 mmol·L-1 DBT; D: 50 mmol·L-1 glycerol, 0.5 mmol·L-1 DBT, and 2 mmol·L-1 OC. Three biological replicates were analyzed in each treatment. The mean normalized value was shown in each treatment. The log FC represented the glycerol × DBT interaction term. ACP: acyl carrier protein; CoA: coenzyme A; HAA: 3-hydroxy alkanoic acid.
a The changes in relative abundance among treatments showed significant differences (p < 0.05).
《2.8. RL extraction and quantification》
2.8. RL extraction and quantification
RLs were extracted according to Ref. [34]. To summarize, cells were removed at day 2 by centrifugation at 5850g for 10 min and filtration with a 0.2 μm pore size. The medium was extracted with ethyl acetate three times. The extracts were combined and dried under a gentle stream of N2 gas, followed by re-suspending the residues in 0.5 mL of methanol. The same procedure was applied to an RL standard (50 μg·mL-1 ) dissolved with 5 or 50 mmol·L-1 glycerol in MM. RLs were quantified with an orcinol assay [35] (0.19% orcinol (w/v) in 53% sulfuric acid (v/v). A 250 μL aliquot of the sample was collected, dried, and resuspended in 250 μL of water. To 100 μL of RL extract, or to varying concentrations of a RL standard, a 900 μL aliquot of the orcinol solution was added. Mixtures were incubated for 30 min at 80 °C. Absorbance was read at 421 nm. An RL standard curve was prepared in a range from 0 to 500 μg·mL-1 . The remaining 250 μL re-suspended in methanol was used for HPLC fractionation on an Agilent 1100 series HPLC (Agilent Technologies, USA) equipped with an Aqua C18 column (150 mm × 4.60 mm, 5 μm particle size; Phenomenex, Inc., USA) according to Ref. [34]. Two RL fractions were collected at 4–5 min (F1) and 5–6 min (F2) and dried to completion at 45 °C. Fractions were re-suspended in 10 μL of 10% ACN/water and desalted with Pierce C18 tips (Thermo Scientific, USA). The manufacturer protocol was modified as follows: Trifluoroacetic acid was not used. F1 and F2 samples were bound to the C18 tip ten times, washed five times with 5% ACN, and eluted with 10 μL of 70% ACN. Samples were fully dried at 45 °C and re-suspended in 2 μL of 50% ACN containing 40 mg·mL-1 of 2,5-dihydroxybenzoic acid (DHB) matrix. A total of 1 μL of matrix was spotted on the target plate and air dried, and then 1 μL of sample/matrix mixture was spotted.
《2.9. RL identification》
2.9. RL identification
RL congeners were identified on a matrix-assisted laser desorption ionization time-of-flight (MALDI/TOF) ultraflexIII mass spectrometer (Bruker, USA) operated in positive, reflectron mode following the published procedures [36]. The instrument was calibrated with the degree of polymerization (DP) series: maltotriose hydrate (DP3, MW: 504.44 g·mol-1 ), maltotetraose (DP4, MW: 666.57 g·mol-1 ), maltopentaose (DP5, MW: 828.71 g·mol-1 ), and maltohexaose (DP6, MW: 990.85 g·mol-1 ) [37]. A 500 μmol·L-1 aliquot of each DP series was dissolved in mQ water. A total of 5 μL of each DP series was mixed with 20 μL of DHB matrix to a final concentration of 62.5 μmol·L-1 .A 2 μL aliquot of this mixture was spotted on a MALDI target plate and allowed to air dry. The instrument m/z range was 300–1200 with 50 pulsations per laser shot and 38%–50% laser intensity. Ions were suppressed below 300 Da. Flexi Analysis and Compass Isotope Pattern software (Bruker, USA) were used for mass spectral analysis. RL peaks were assigned using an in silico database created according to the RLs reported [38], with a 0.5 Da error mass.
An Agilent 6520A liquid chromatograph-quadrupole time-offlight mass spectrometer (LC-Q-TOF-MS) system (Agilent Technologies, Canada) was used for the MS/MS analysis of samples. The RL sample (20 μL) was separated on a Luna C18 column (100 mm × 2.0 mm, 3 μm particle size) (Phenomenex, Inc., USA) in gradient starting at 5% ACN in 5 mmol·L-1 aqueous ammonium formate buffer (pH 3.3) to 95% ACN in 15 min, and then held for 15 min. The mobile phase flow rate was 0.3 mL·min-1 . The column was equilibrated for 10 min between runs. The electrospray ionization interface was set at the negative mode. The capillary voltage was 4000 V. The fragmentor and skimmer voltages were 180 and 80 V, respectively. When the system was in the MS/MS mode, the drying and nebulizing gas was nitrogen, while helium was the collision gas. The gas temperature was 350 °C. The dry gas flow rate was 10 L·min-1 . The nebulizer pressure was 25 psi (1 psi = 6.895 kPa). Full-scan data were acquired via scanning from m/z 50–1700. The collision energy in the MS/MS mode was 20 eV.
《3. Results and discussion》
3. Results and discussion
《3.1. Biostimulation with glycerol enhances DBT biodegradation and Burkholderia sp. C3 growth》
3.1. Biostimulation with glycerol enhances DBT biodegradation and Burkholderia sp. C3 growth
This study was designed to follow a biostimulation strategy to investigate the influence of glycerol on the DBT biodegradation ability of Burkholderia sp. C3. Co-substrate experiments with DBT and glycerol exhibited neither a carbon catabolite repression phenomenon nor an antagonistic effect, which has been reported for other co-substrate mixtures [16,39,40]. The results indicate that biostimulation with glycerol supports C3 cell growth while enhancing DBT biodegradation, as shown in Fig. 1. The experiments show that the enhancement of DBT biodegradation was dependent upon the molar ratios of glycerol to DBT used and on the incubation time. Significant differences were observed when the culture was stimulated with 0.5, 5, 50, and 200 mmol·L-1 of glycerol (Tukey HSD; LSD; Bonferroni; p < 0.001). At these concentrations, glycerol enhanced the DBT biodegradation by 25%–30% after one day of incubation. In cultures at a glycerol (50 mmol·L-1 )- to-DBT molar ratio of 92.6:1, the strain C3 degraded 100% of 0.54 mmol·L-1 (100 ppm) DBT after seven days of incubation. This optimal glycerol concentration was used for the proteomics and mass spectrometry experiments. At this concentration, the DBT half-life decreased to the lowest—from 27.5 to 1.5 days—and the DBT degradation rate constant showed an 18-fold increase (Table 1). Negligible degradation was observed in the control cultures with autoclaved bacteria, as shown by the negative fold change in Table 1. Similar to the DBT biodegradation kinetics at 50 mmol·L-1 glycerol supplementation, C3 degraded 92% of 0.54 mmol·L-1 DBT at day 10 in cultures containing 0.5 mmol·L-1 glycerol. However, at this glycerol concentration, the C3 growth remained at 0.05 OD600, which indicated that the increase in biomass was not the only cause for the enhanced DBT biodegradation, and that additional molecular mechanisms were involved. Statistical analysis showed no significant difference in DBT biodegradation between days 7 and 10 (Tukey HSD; LSD; Bonferroni; p < 0.05). Therefore, seven days would be recommended for biodegradation under the conditions tested.
DBT as a sole carbon source did not support strain C3 cell growth. The OD600 remained at 0.05 after a 10-day incubation period, which was equal to the initial inoculum (Fig. 1). PAH biodegradation in liquid cultures with a single carbon source depends on the bacterial strain, PAH structures, and PAH concentrations. For example, the strain C3 at day 7 degraded 94% of 40 ppm DBT [22]. Our results indicate that C3 degraded 11%–12% of 100 ppm DBT at day 7. At this concentration, DBT had no apparent benefit to the bacteria, and even a decrease in biodegradation efficiency was observed. This finding was supported by the fact that C3 cell growth in glycerol-DBT mixtures was inhibited in comparison with growth in glycerol alone. For example, mixtures of 0.54 mmol·L-1 DBT with glycerol ranging from 50 to 500 mmol·L-1 exhibited reduced growth, up to 0.3 OD600 relative to glycerol alone, and started after one day of cultivation. DBT did not inhibit growth at lower concentrations of glycerol (0.05–5 mmol·L-1 ). Growth inhibition with 50 to 500 mmol·L-1 of glycerol may be associated with the toxicity of DBT, DBT metabolites, or both. It was reported that PAHs’ hydrophobicity and carcinogenicity influence their toxicity [16,41,42].
《Fig. 1》

Fig. 1. DBT biodegradation kinetics by Burkholderia sp. C3 and its growth over a 10-day cultivation period with 0.54 mmol·L-1 DBT and different glycerol supplementation (0, 0.05, 0.5, 5, 50, 200, and 500 mmol·L-1 ).
《3.2. The RL biosynthetic pathway is activated in Burkholderia sp. C3》
3.2. The RL biosynthetic pathway is activated in Burkholderia sp. C3
Glycerol is a good carbon source for RL production in Pseudomonas species [38]. It can be metabolically assimilated into the lipid pathways affecting PHA granule formation and RL production [24,38,43,44]. Table 2 lists the relative abundance of the enzymes detected in four treatments—namely (A) 0.54 mmol·L-1 DBT; (B) 50 mmol·L-1 glycerol; (C) 50 mmol·L-1 glycerol and 0.54 mmol·L-1 DBT; and (D) 50 mmol·L-1 glycerol, 0.54 mmol·L-1 DBT, and 2 mmol·L-1 OC—along with the log FC and p-value. These enzymes are responsible for RL biosynthesis, as shown in Fig. 2. Biosynthesis of RLs requires an R-3-hydroxydecanoyl-ACP or -CoA lipid precursor produced from the FAS II [45,46] and/or β-oxidation [24] pathways, respectively, and a dTDP-L-rhamnose sugar precursor [43]. Once the lipid and sugar precursors are produced, RhlABC mediates the formation of mono- or di-RLs. The anabolic enzymes AlgC and RmlBCD involved in dTDP-L-rhamnose biosynthesis were detected in the four treatments (Fig. 2, Table 2). RmlD catalyzes the final step from dTDP-4-keto-6-deoxy-L-mannose to dTDP-rhamnose. The changes in the relative protein abundance of RmlD in the different treatments were significant (p < 0.05), and the log FC was upregulated. The log FC represents the effect of the glycerol × DBT interaction term. Its upregulation indicates that this interaction had a positive effect on the treatments containing this term. The enzyme RmlC that catalyzes the previous step in the pathway was also upregulated. The relative abundance of both RmlD and RmlC suggests that the synthesis of RL sugar precursors is not inhibited by the RL biosynthesis inhibitor OC.
《Fig. 2》

Fig. 2. Identification of proteins involved on RL biosynthesis in Burkholderia sp. C3. Bolded proteins showed upregulation in the glycerol×DBT interaction term (log FC). FadB: enoyl-CoA hydratase/3-hydroxyacyl-CoA dehydrogenase; FadE: acyl-CoA dehydrogenase; FabF: β-oxoacyl-ACP synthase 2; ACP: acyl carrier protein; FabG: 3- oxoacyl-ACP-reductase; RhlA: HAA synthase; HAA: 3-hydroxy alkanoic acid; RhlB: rhamnosyltransferase 1; RhlC: rhamnosyltransferase 2; AlgC: phosphoglucomutase/ phosphomannomutase; RmlB: dTDP-glucose 4,6-dehydratase; RmlC: dTDP-4- dehydrorhamnose-3,5-epimerase; RmlD: dTDP-4-dehydrorhamnose reductase.
Enzymes from the FAS II and/or β-oxidation pathways were detected in the four treatments (Fig. 2, Table 2). FabG is the enzyme catalyzing the final step in R-3-hydroxydecanoyl-ACP synthesis via the FAS II pathway [46]. The relative abundance of FabG was > 1 in all treatments, indicating that this protein was detected. However, the p-value was above 0.05, meaning that their relative abundances did not show significant differences (Table 2). The preceding step catalyzed by FabF was upregulated in treatment (C). The β-oxidation enzymes FadB and FadE were abundant in treatment (C) (Table 2). The results indicate that the later stages in the FAS II and b-oxidation pathways are active in C3 at day 2 of cultivation.
RhlA produces 3-hydroxy alkanoic acid (HAA), which is then utilized by RhlB for mono-rhamnolipid biosynthesis [47]. RhlA was identified and the log FC showed upregulation. Rhamnosyltransferases RhlB and RhlC were also identified (Table 2). RhlB and RhlC are involved in the direct formation of monorhamnolipids [48,49] and di-RLs [50], respectively. The proteins identified in Table 2 suggest that glycerol induces lipid precursors for the biosynthesis of RL biosurfactants in C3 cells. The data suggest the involvement of both the FAS II and β-oxidation pathways in the synthesis of the lipid precursor. However, it is uncertain which pathway dominates, as these pathways have additional roles in the cells, such as cell proliferation.
《3.3. Enhanced DBT biodegradation in Burkholderia sp. C3 is affected by RL biosynthesis and its inhibition》
3.3. Enhanced DBT biodegradation in Burkholderia sp. C3 is affected by RL biosynthesis and its inhibition
DBT is hydrophobic [6] and its bioavailability is the first requirement for biodegradation [15]. DBT solubilization and foam formation were observed in the cultures when glycerol was supplemented. Such observations suggest the secretion of a surfactant agent. Our proteomics results indicate that the RL biosurfactant biosynthesis pathway is active in C3. Thus, the relevance of RLs to the enhanced DBT biodegradation induced by glycerol was investigated with an orcinol assay [51].
Gutierrez et al. [25] showed that inhibition of RhlA by bromoalkanoic acids suppresses the production of RLs and PHA in Pseudomonas species, and that this inhibition is dependent on the bromoalkanoic acid used. Inhibition of RLs and PHA has also been described in the literature [24]. 2-Bromoalkanoic acids (HEX or OC) were therefore used to probe the roles of RLs in DBT biodegradation by the strain C3. If RLs play a role in DBT biodegradation, HEX and OC should decrease DBT biodegradation via RL biosynthesis inhibition. An increase in RL secretion was quantified when the strain C3 was cultivated in the glycerol/DBT mixture relative to cultivation in DBT alone. RL biosynthesis and secretion, induced by varying concentrations of glycerol (Fig. 3(a)), were strongly associated with the amount of DBT degraded (Fig. 3(b)), as was RL biosynthesis inhibition by HEX and OC. The results agreed with the proteomics findings; RL biosynthesis occurs in C3 and is strongly associated with its biodegradation ability.
《Fig. 3》

Fig. 3. Association between (a) the amount of RL secreted at day 2 and (b) the amount of DBT degraded at day 1 by Burkholderia sp. C3 cultivated without inhibitor, with 2 mmol·L-1 of HEX or 2 mmol·L-1 of OC and different glycerol concentrations (0, 0.05, 0.5, 5, 50, and 200 mmol·L-1 ).
《3.4. RL congeners are secreted by Burkholderia sp. C3》
3.4. RL congeners are secreted by Burkholderia sp. C3
An RL standard containing a mixture of Rha-Rha-C10-C10 and Rha-C10-C10 congeners was used to identify RLs in experimental samples. RL congeners were eluted between 4 and 6 min (Fig. 4). The HPLC chromatograms of the experimental samples matched well with those of the RL standards (data not shown). Two fractions named F1 and F2 were collected from the experimental samples with 0.5 mmol·L-1 DBT and either 50 or 0 mmol·L-1 glycerol. Fractions from the cultures treated with 2 mmol·L-1 of HEX or OC inhibitors were also collected. The peak intensity on the HPLC chromatogram of the extract from the 50 mmol·L-1 glycerolsupplemented culture was approximately 10-fold higher than that on the 0 mmol·L-1 glycerol HPLC chromatogram. Glycerol induced an increase in RL production. It is noteworthy that multiple peaks occurred at the OC chromatograms (Figs. 4(c) and (f)).
《Fig. 4》

Fig. 4. HPLC chromatograms of RLs secreted by Burkholderia sp. C3 cultivated with (a) 0.54 mmol·L-1 DBT and 50 mmol·L-1 glycerol, with (b) 2 mmol·L-1 of HEX, or (c) 2 mmol·L-1 of OC, and cultivated with (d) 0.54 mmol·L-1 DBT, with (e) 2 mmol·L-1 of HEX, or (f) 2 mmol·L-1 of OC. (g) MALDI-TOF-MS of 4 RL congeners (M1, M2, M3, and M4) identified from HPLC chromatogram a, fraction 2 (F2), and (h) LC-Q-TOF-MS2 of Rha-C10-C10 (M1).
The most intense peaks were assigned to RL congeners. In the 50 mmol·L-1 glycerol samples, C3 secreted the congeners RhaC10-C10 (M1 + Na+ ), Rha-Rha-C10-C10 (M2 + Na+ ), Rha-Rha-C10- C12—which were identified in sodium (M3 + Na+ ) or potassium (M3 + K+ ) adduct ion forms—and Rha-Rha-C12-C12 (M4 + Na+ ). The mono-rhamnolipid congener Rha-C12-C12 was identified in the 0 mmol·L-1 glycerol samples and in the samples with HEX or OC inhibitors (either in 50 or 0 mmol·L-1 glycerol) (data not shown). The peaks M1 and M2 were confirmed with MS/MS. The mass spectrum of Rha-C10-C10 is shown in Fig. 4(h). Loss of C10 acyl chain and rhamnose sugar fragments (Rha) were observed. It is concluded that glycerol supports C3 cell growth and enhances the biodegradation of DBT via an RL-mediated mechanism.
Our findings suggest that the utilization of glycerol could lead to the effective biodegradation of persistent organic pollutants— including organochlorine pesticides and PAHs—in contaminated soil and could thus be used in the restoration of land functionality, making it available for agricultural purposes. This biostimulation strategy could be applied in combination with the bioaugmentation of a suitable microbial consortium. Our findings suggest that glycerol may trigger a superior response in a bacterial population with a mixture of PAH degraders and RL producers. An initial analysis of the bacterial population and cellular respiration, along with PAH biodegradation monitoring over time, would be required for a proper assessment of the bioremediation site.
《4. Conclusions》
4. Conclusions
The amphipathic properties of RLs suggest multiple functions for RL producers and PAH degraders. Some of the functions are related to hydrophobic chemical solubilization, chemical uptake, and biological assimilation. Our studies indicated a 30% increase in DBT biodegradation with glycerol biostimulation after one day of incubation. This enhancement was associated with increased di-RL biosynthesis by Burkholderia sp. C3 and bacterial growth. In addition, we report the use of 2-bromoalkanoic acid for RL biosynthesis inhibition in a Burkholderia species. To our knowledge, this is the first report correlating glycerol supplementation to DBT biodegradation and RL biosynthesis. The results suggest a potential practicality of the biostimulation strategy described here to improve bioremediation efficiencies and facilitate such processes.
《Acknowledgements》
Acknowledgements
This work was supported in part by Grant N00014-12-1-0496 from the Office of Naval Research and a subcontract with the Western Center for Agricultural Health and Safety (NIOSH grant 2U54OH007550). The authors thank Dr. Margaret R. Baker for her assistance with MALDI/TOF.
《Compliance with ethics guidelines》
Compliance with ethics guidelines
Camila A. Ortega Ramirez, Abraham Kwan, and Qing X. Li declare that they have no conflict of interest or financial conflicts to disclose.
《Nomenclature》
Nomenclature
ACN acetonitrile
CoA coenzyme A
FabZ 3-hydroxy-ACP-dehydratase
FDR false discovery rate
HEX 2-bromohexanoic acid
HPLC high-performance liquid chromatograph
HSD honestly significant difference
LSD least significant difference
DHB dihydroxybenzoic acid
DP degree of polymerization
OC 2-bromooctanoic acid
DBT dibenzothiophene
FAS II de novo fatty acid synthesis
FadB enoyl-CoA hydratase/3-hydroxyacyl-CoA dehydrogenase
FadE acyl-CoA dehydrogenase
FabF β-oxoacyl-ACP synthase 2
ACP acyl carrier protein
FabG 3-oxoacyl-ACP-reductase
RhlA HAA synthase
HAA 3-hydroxy alkanoic acid
RhlB rhamnosyltransferase 1
RhlC rhamnosyltransferase 2
AlgC phosphoglucomutase/phosphomannomutase
RmlB dTDP-glucose 4,6-dehydratase
RmlC dTDP-4-dehydrorhamnose-3,5-epimerase
RmlD dTDP-4-dehydrorhamnose reductase
MALDI/TOF matrix-assisted laser desorption ionization time-offlight
LC-Q-TOF-MS liquid chromatograph-quadrupole time-of-flight mass spectrometer
MM minimal medium
MS mass spectrometry
PAH polycyclic aromatic hydrocarbon
PHA polyhydroxyalkanoic acid
RL rhamnolipid


 京公网安备 11010502051620号


