

《1. Introduction》
1. Introduction
High penetration of distributed energy resources (DERs) and deferrable loads, such as electric vehicles (EVs), is introducing new challenges to the modern grid, due substantially to the uncertainties that are inherent in their intermittency [1,2]. This is expected to greatly influence the operation and control of the power system [2]. The indeterminacy of load profile and supply from DERs calls for a more flexible approach on the customer side. Demand response (DR), traditionally used by utilities with their larger customers, may now—with advances in two-way communication—be brought to the residential level [3]. The fundamentals of DR are noted in Ref. [4], and comprehensively discussed in Ref. [5]. For a discussion of DR in the context of demand-side management, see Nadel [6]. For an extensive survey of the DR literature, please see Vardakas et al. [7]. DR addresses consumption modification through particular methodologies. DR approaches range from those without dispatch capability, such as time-of-use (TOU) [8,9], critical peak pricing (CPP) [4,10,11], and real-time pricing (RTP) [12], to those with dispatch capability, such as available demand-side resource capacity control (ADSRCC) [13,14] and available demand-side reserve management (ADSRM) [15–17].
Existing approaches to DR can be categorized as either centralized or decentralized/hierarchical [18]. In the centralized approach, an optimum solution is sought using extended data across the grid, with the aim of maximizing DR outcomes. Desired grid states are then pursued using direct control strategies in which, based on agreements between the distribution system operator (DSO) and customers, remote regulation of customer assets by the operator is permitted [19]. By contrast, hierarchical/ decentralized DR is an indirect control strategy, where controllers are local agents with some degree of intelligence and decisionmaking autonomy. Hierarchical DR schemes can be implemented through a master–slave approach, where a local controller is responsible for balancing local generation and consumption [20].
Control strategies that enable utilities to engage customer DER can take a number of approaches [21]. Among these, the transactive framework takes an agent-based approach to motivate and manage system behavior [22–24]. Similar to conventional DR programs, transactive platforms may use incentives to secure the necessary resources. Behboodi et al. [25] proposed a transactive control paradigm that enabled thermostatically controlled loads to participate in real-time retail electricity markets. A transactive approach was recently used in commercial building heating, ventilation, and air-conditioning (HVAC) systems for DR [26]. Daneshvar et al. [27] proposed transactive energy integration for different rural areas, partially equipped with DERs, to reduce total community energy cost. The transactive approach commonly addresses DER management through some price signal, which could be the market clearing price provided by the independent system operator. Barriers to practical implementation still remain: most prominently, a lack of customer participation in the incentive approaches, and the lack of uniform standards for DR in the electricity market.
Practical DR implementation is not straightforward. Significant challenges must be addressed before its full potential can be realized within a grid edge context, where DER and nontraditional loads are expected to proliferate. Existing centralized and decentralized approaches assume that necessary customer data are available, which may jeopardize customer privacy [28]. Moreover, there are two significant hurdles to practical implementation: how to address dynamic system state regulation, and how to ensure scalability. Most approaches are therefore deficient in one or more of the following factors: ① accurate control with low latency across a range of time scales; ② flexibility in response while maintaining interoperability; ③ control law sufficiency while adhering to privacy requirements; ④ communication reliability while keeping marginal costs low; and ⑤ cyber-security. A clustering method was proposed in Refs. [29,30] to address the resiliency of customer lifestyle and responses. Employing distributing controllers in the grid with transactive approaches helps to reduce latency and increase flexibility and scalability, but addressing all needed factors in one platform is still an ongoing research activity.
We address the above challenges within a transactive energy (TE) framework that exploits interoperability as a reference architecture to realize our DR scheme. The TE framework provides an approach to addressing smart grid operational objectives from the joint perspectives of economics and control systems, using value as a key operational parameter [31]. It is characterized by attributes that describe the characteristics of the particular approach. Chen and Liu [22] reviewed the state of the art of research and industry practice on DR and the new methodology of TE, noting the outstanding barriers that remain to be overcome to advance performance, particularly regarding technology, scalability, system management, and consumer behavior. Nunna and Srinivasan [32] proposed an agent-based TE framework for an inter-microgrid auction-based electricity market that incorporates DR within its energy management strategy. Good et al. [33] recently addressed the TE modeling and assessment framework for DR business cases. Zia et al. [34] very recently presented a multilayer TE architecture along with the distributed ledger approaches needed for the validation of economic transactions.
Interoperability is the critical TE attribute [35], so in contrast to the top-down approaches noted above, and to address the observed deficiencies, we implement our transactive demand response (TDR) scheme using the Institute of Electrical and Electronics Engineers (IEEE) 2030.5 standard for smart energy profile (SEP) application protocol [36] as central to our reference architecture. This standard uses an Hypertext Transfer Protocol (HTTP) request/response model over Transmission Control Protocol (TCP)/Internet Protocol (IP), and adopts extensible mark-up language (XML) as the data-exchange format. Transport layer security (TLS) 1.2 provides confidential message exchange, to ensure authenticity of the different parties communicating and to ensure message integrity. The information (semantic) and cyber–physical (syntactic) interoperability expressed in our TDR design realization ensure that the pragmatics of economic and business objectives can be met in a secure and scalable fashion if we can functionally demonstrate, through lab-based emulation with real load data on actual hardware, that aggregate customer DR compliance can be driven by price signals through transaction.
We use an event-driven autonomous distributed architecture with real-time communication between a transactive agent (TA) and multiple home energy management system (HEMS) agents [37,38] compliant with the IEEE 2030.5 standard. Residential customers possess both generation and storage assets, in addition to diverse loads, that are subject to HEMS control. Our TDR scheme takes a multi-agent systems approach [37] to the neighborhood coordination of these agents. Transaction is hierarchical, between an aggregating TA and each HEMS agent. That is, the HEMS agents do not directly interact; they cooperate with the TA, but not with each other. This approach promotes privacy by design, while engaging the cognitive intelligence of the HEMS in finding the best voluntary accommodation of the DR request in coordination with all other homes in the TA neighborhood. The TA seeks to maximize the DR request across this network by negotiation with each HEMS agent, subject to the constraint set by each homeowner regarding the degree to which they may be willing to cooperate with such requests. Enhanced cooperation will be fiscally motivated by the TA through an evolving price signal communicated to each homeowner/customer as a reward for positive participation in the transactive negotiation.
The paper is structured as follows. In Section 2, we describe the system architecture and its communication hierarchy; we relegate a brief overview of IEEE 2030.5 requirements, and a summary of the function sets and essential elements necessary for TDR, to the Appendix A. In Section 3, HEMS agent operation is presented. Section 4 quantifies customer behavior in both past and present, the former through a description of customer consumption for predictive use, and the later via a reward function that is used to mediate transactive negotiation. In Section 5, our TDR algorithm is presented, and the optimization approach to negotiation is detailed. Emulation results are shown in Section 6 for various scenarios, and concluding remarks are presented in Section 7.
《2. System architecture and SEP 2.0 messaging》
2. System architecture and SEP 2.0 messaging
Here, we describe our TE framework that exploits interoperability as a reference architecture to realize our DR scheme. We use an event-driven autonomous distributed architecture with real-time communication between agents. It exploits the IEEE 2030.5 SEP 2.0 standard [36] for interoperability. With SEP 2.0 as the data model, which is based on an International Electrotechnical Commission (IEC) 61968 common information model [39], our application programming interface (API) engages the grid edge resources in a “RESTful” (where REST stands for representational state transfer) [40] manner. A public key infrastructure (PKI) [41] is used to provide protection against non-repudiation attacks.
The structural configuration of the TDR system, shown in Fig. 1(a), consists of a TA and an aggregation of HEMS agents as the primary grid edge agents. The TA is physically co-located with the neighborhood distribution transformer. TA communication with the utility provides centralized grid condition monitoring and control. TA communication with HEMS agents coordinates all DR requests and returns, and monitors the local microgrid on the low-voltage side of the transformer. As illustrated in Fig. 1(a), the TA takes an optimization approach to apportioning the DR request by transactive negotiation with each customer, as further described below.
《Fig. 1》
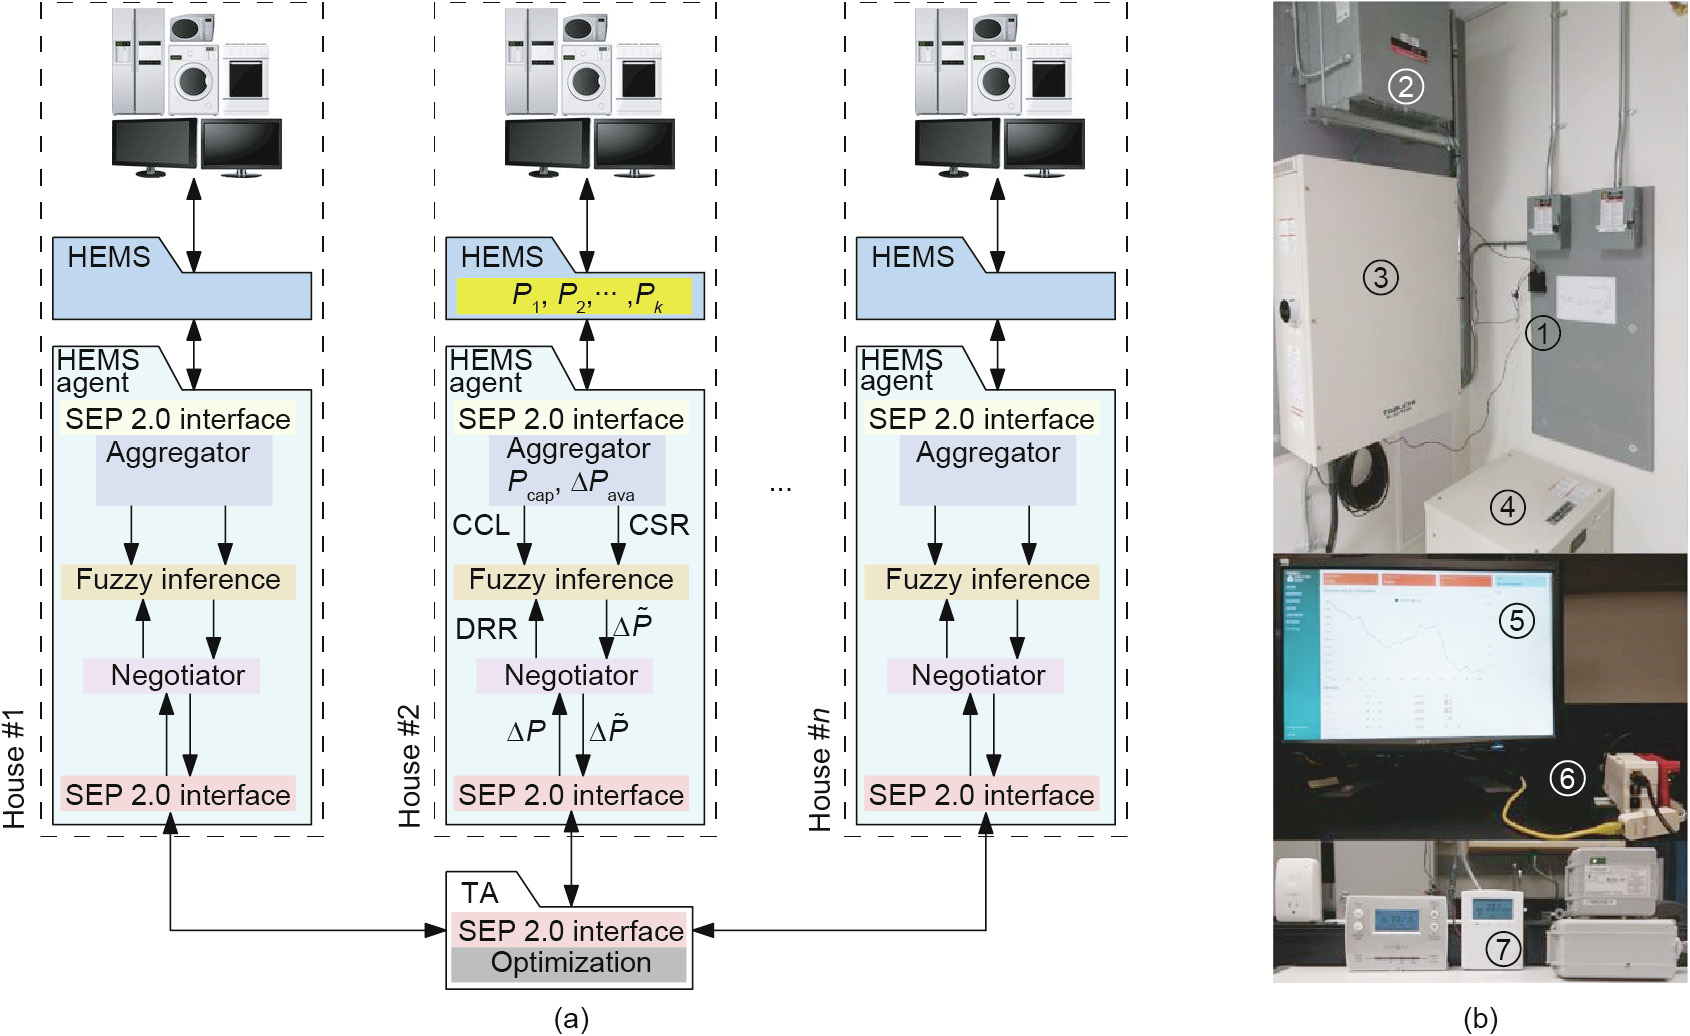
Fig. 1. (a) The TDR structural architecture. (b) Physical implementation of the TDR system in a laboratory test configuration. The top panel shows ① the TA, ② the transformer, ③ the photovoltaic (PV) inverter, and ④ the battery; the bottom panel shows ⑤ the user interface and ⑥ the HEMS agent; and ⑦ the HEMS, smart thermostat, and switches. CCL: customer cooperation level; CSR: customer scheduled return; DRR: dynamic DR request; Pcap : the residential capacity;  Pava: load shed availability; P: potential load reduction;
  : requested load reduction during TDR negotiation; Pk : here, the power consumption of load k for this customer (formally,
  , where the sum over all loads gives the current power consumption for customer i, denoted Pi in the text.
The HEMS agent is a residential unit responsible for the control and scheduling of customer assets (here, “loads” for simplicity). It operates within a SEP 2.0 framework to address TA requests, based on customer choices of consumption mode, comfort level, and load priorities, as further described in Section 3. The HEMS agent translates data from such services to a SEP 2.0-recommended XML file for TDR purposes (see the cyan box in Fig. 1(a)), including local power measurements so that DR action can be verified. It maintains customer privacy by design, acting as a customer agent to firewall any knowledge of load-specific activities and customer behavior from the TA. HEMS agents negotiate with the TA to determine their best response to the DR request, using a fuzzy inference engine to accommodate customer preferences and comfort levels in response to rewards offered by the TA (it may also be directed to comply with a mandatory DR event). This behavior will be more fully described in the next section.
Fig. 1(b) shows a physical implementation of the TDR system in a laboratory test configuration. In the left panel, DC power is brought down from the photovoltaic (PV) panels on the roof to a transformer, and thence to a Tabuchi Electric Eco Intelligent Battery System [42] (inverter and battery). The TA is mounted onto the electrical panel. The bottom panel shows the HEMS agent, with which the TA communicates, and the HEMS agent interacts with Energate [43] Ho¯lHo¯m smart thermostats and load controllers (the HEMS); also shown is the user interface.
Fig. 2 describes the SEP 2.0 messaging sequence via GET commands for XML files. High-level DR events are initiated by the utility server and are communicated to the TA. Low-level DR events are initiated by the TA in response to local asset monitoring, such as transformer health. The TA communicates with individual HEMS agents, sending XML function sets with their corresponding elements in the sequence shown. HEMS agents send similar messages to the TA as part of the transactive negotiation and monitoring process, and the TA likewise sends messages to the DSO. In our architecture, HEMS agent is a client while the TA is either client or server, as required by the downstream devices. Since the TA is firewalled from engaging customer assets directly, we take a distributed intelligence [44] approach to agent-based energy management [45]. In the following sections, we explain how the information retrieved through SEP is used by HEMS and the fuzzy logic controller (FLC) as a HEMS agent to perform negotiations. The SEP 2.0 function sets used to implement the required TDR activities are described in the Appendix A. Having implemented a complete SEP server, we stress that all agents are fully compliant with the IEEE 2030.5 smart grid interoperability standard, although the present TDR scheme uses but a fraction of its capabilities.
《Fig. 2》

Fig. 2. Communication hierarchy using SEP 2.0 between the DSO, TA, and HEMS agent for TDR.
《3. HEMS agent operation》
3. HEMS agent operation
The HEMS agent is responsible for transactive negotiation with the TA. This agent is implemented using an FLC. It communicates with a HEMS to determine aggregate load and load shed availability, and to pass on the DR request for implementation. Below, we describe how the cognitive intelligence of the FLC is engaged by the TA to find the best voluntary accommodation of the DR request in coordination with all other HEMS agents in the neighborhood. Once the DR negotiation with the HEMS agent is done, it sends this information to the HEMS, which is responsible for accommodating the loads in response. We have used a commercial off-the-shelf HEMS from Energate [43] to do so, ensuring IEEE 2030.5 compatibility with this proprietary HEMS through a separate application programming interface. Given a residential capacity Pcap (i.e., the aggregate nameplate powers of all controllable loads), it does this based on data provided by the HEMS for the load shed availability, Pava (i.e., the aggregate consumption of all controllable loads presently in use, which is the maximum DR availability), for the scheduling interval. The HEMS agent determines the most efficacious way to achieve this reduction, whether it be through direct curtailment, the change of load set points and duty cycles, or local DER dispatching (treated here as a negative load).
The IEEE 2030.5 standard describes the process by which smart grid functionalities may be realized, but it does not define the manner by which they are to be realized. This distinction lies at the heart of the interoperability framework. Our implementation of the standard is within a transactive profile, using the normalized quantities described below to better reveal how the HEMS agent demonstrates cognitive intelligence during the transactive process. Customer constraints are implemented heuristically through a customer cooperation level (CCL) [46] to indicate the degree of willingness to comply with TDR requests. Without loss of generality, it is sufficient to define only two modes: ① good, used when customers will accommodate some behavior modification to comply with TDR requests; and ② poor, used when customers want minimal impact on their usage behavior during TDR events. That is, the CCL is a HEMS agent operation mode, set by the customer, that defines how the FLC will respond to DR requests.
During transactive negotiation, we need to identify the load reduction Pi that the HEMS agent for customer i is willing to accommodate, which is less than or equal to the load shed availability Pava. We normalize Pi by the residential capacity (i.e., the sum of the nameplate powers of all controllable loads), Pcap, to define the customer scheduled return (CSR) as

In a complementary fashion, the dynamic DR request (DRR) is defined as the ratio of a potential demand reduction during negotiation, P, to the residential capacity as

where P is described more fully in Section 5 and is initiated by the TA from individual customer histories (see Section 4).
We use a multi-input multi-output (MIMO) fuzzy control approach [47] to extract, for each home and specified CCL, the requested demand reduction during TDR negotiation,  as
as
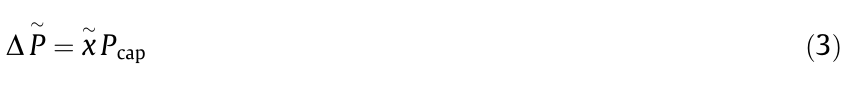
where  is the normalized output of the FLC. A three-step process is followed to determine this output: fuzzification, fuzzy inference, and defuzzification, with Eqs. (1) and (2) providing the universe of discourse.
Fuzzification operates on the crisp data of the FLC input, converting these data into linguistic variables, chosen here to be Low–Low (LL), Low (L), Medium (M), High (H), and High–High (HH). Each variable is associated with a membership function defined by a triangular wave function,  , where
  is a membership value between zero and one that describes a point in the input space (CSR or DRR). Fig. 3 gives the membership functions for the input (as well as the output) that define how each point in the universe of discourse is mapped to a membership value (or degree of membership) between zero and one.
《Fig. 3》
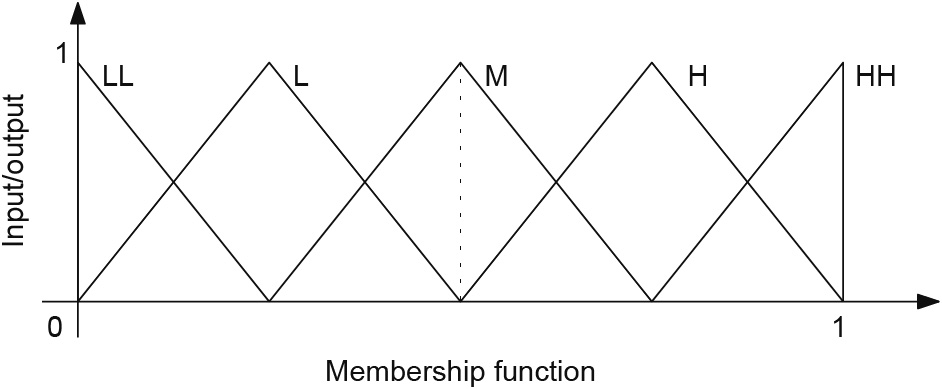
Fig. 3. Membership functions (vertical axis) for the input (DRR, CSR) or output (, the defuzzified value) membership values (horizontal axis). Also shown are the linguistic variables, LL, L, M, H, and HH, associated with each membership function.
The fuzzy inference process combines the membership functions with control rules to present fuzzy outputs in a lookup table, which describes the functional mapping between input and output using the linguistic variables. Using a rule-based FLC allows us to best capture the knowledge variety about the problem, as well as the interactions and relationships between its variables, and best accommodates uncertainties in the system [48]. Tables 1 and 2 give the rule bases for the poor and good CCL modes, respectively.
《Table 1》
Table 1 Fuzzy rule base for poor compliance with TDR requests, where inputs are DRR and CSR, with the resulting output shown in the gray area.

《Table 2》
Table 2 Fuzzy rule base for good compliance with TDR requests, where inputs are DRR and CSR, with the resulting output shown in the gray area.

Defuzzification is used to convert fuzzy outputs into crisp values. Given the symmetry of the membership functions, the centroid of area (COA) approach is used to determine from the evaluated membership functions. The negotiated load reduction is then determined via Eq. (3), and the information is sent to the TA using LoadShedAvailability, DrResponse, and the DER function sets, as explained in Appendix A.
《4. Quantifying customer behavior》
4. Quantifying customer behavior
We use real-world data to model customer consumption behavior. Smart meter data within Hydro Ottawa’s [49] service area was collected for ten anonymized residential customers at 1 min intervals over 45 d. The customers were then classified using k-means clustering. This information is used by the TA to initiate the transactive negotiation process with each HEMS agent—see Eq. (7) in Section 5.
The k-means method partitions data into clusters, where cluster membership is determined by minimizing an objective function defined by the sum of the squared distances between all N data points and cluster centers for each time t [50]; hence
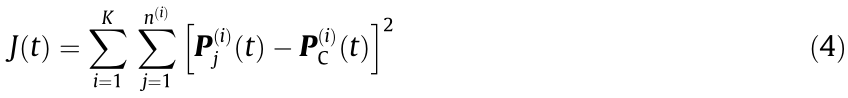
where at each time t,  is a K element vector of cluster centers,
  is an
is an  element vector of consumption data, and N =
 . The results of the cluster analysis for N = 470 and K = 3 are shown in Fig. 4. Individual cluster sizes n are 3, 2, and 5.
《Fig. 4》

Fig. 4. Customer consumption behavior clustered in three groups.
To further quantify customer behavior, and to enable efficient negotiation, our TDR algorithm (described in detail in Section 5) incorporates a flexible reward function to accommodate diversity in both power consumption and TDR compliance. It may also be used to monetize participation in TDR requests, and may be adjusted to accommodate market signals. For each negotiation time interval, we define for each customer i a reward function

where r0 is the base reward for TDR participation, Pi is the customer’s current power consumption,  is the average power consumption for all participants over the previous 24 h, PT is the total current power consumption for all participants, di is the customer’s DR compliance at any stage of the negotiation process,
  is the average compliance for all participants, and dT is the total compliance for all participants. Relative power consumption and compliance are scaled by positive coefficients c1 and c2, respectively, where c1 + c2 = 1. This permits dynamic weighting in the TDR negotiation toward either power reduction or increased compliance, as may be necessary to improve the negotiation process; here, we default to equal static weighting. Finally, to address cluster membership, c0 is chosen as an overall weighting factor that introduces a slight bias toward a history of reduced consumption; we take a range of [1.0, 1.3], with c0 inversely dependent on customer consumption. This promotes inter-cluster competition.
The reward function is continuously updated during negotiation (through r0) to encourage a trend toward increased DR compliance. It is also incorporated within the MirrorUsagePoint function set in Appendix A to update and record the power usage metrics, and to calculate the present consumption and reward for each residence. We will use these data to make the DR request via an optimization approach.
《5. The TDR algorithm》
5. The TDR algorithm
We now describe how our TDR scheme is implemented algorithmically, using a flowchart representation in which the negotiation between the TA and the HEMS agent is operationally accomplished via the TCP/IP exchange of the IEEE 2030.5 SEP 2.0 function sets. DR requests may originate from either the utility side or at the transformer level, and are addressed using EndDeviceControl in Appendix A. We denote the target DRR value by the TA as for a particular deployment time t across a time horizon th, which is a SEP 2.0-defined time interval.
A simplified TDR algorithm is given in Fig. 5. On the TA side, if a new DRR value is received, the TA will initiate the TDR negotiation with the HEMS agents. As the HEMS agents confirm compliance, negotiation continues with the remaining HEMS agents, as further detailed below. On the HEMS agent side, if a HEMS agent GETs a DRR value with drProgramMandatory = FALSE, it determines load reduction availability and POSTs it to the TA. Negotiation continues with noncompliant HEMS agents until the evolving DRR value is confirmed (or the iteration limit is reached) and negotiation is terminated. The final DRR value is then allocated to each HEMS agent by setting drProgramMandatory = TRUE, and the HEMS agents then implement their requests. The TDR algorithm optimizes the target DR reduction for each HEMS agent at each stage of the negotiation. Optimization is based on model predictive control (MPC) using a linear programming approach [51]. This event-based DR optimization is a good approach for systems such as ours with complex dynamics and constraints [52].
《Fig. 5》

Fig. 5. Flowchart representation of the TDR algorithm, showing the HEMS agent on the left, and the TA flow on the right. The central block indicates the communication process. PARSE refers to decoding the XML files using the SEP2.0 protocol implemented by the IEEE 2030.5-compliant TDR platform. GET and POST are HTTP methods corresponding to read and create operations, respectively.
For each negotiation j (1 ≤ j ≤ 10), the individual potential load reductions DPi (the control variable) are determined via

where k is the number of available customers in the transactive network; 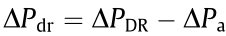 is the evolving DRR value, with
  as the aggregate demand reduction for those customers who have agreed to comply with their individual requests; and
  is the mean DR availability of the customers remaining for that negotiation. For successful TDR operation, note that
  should tend to zero as j increases. An indicator function
  has been introduced to show whether customers are still in negotiation ( = 1 for still negotiating, = 0 for reduction confirmed). The first constraint asserts that the sum of the individually requested load reductions meets the target DR request, while the second moderates individual requests to within an interval governed by the mean DR availability. The latter constraint maintains request fairness while accommodating the CCL mode chosen by the customer, thus permitting early "lock-in” during the negotiation process by customers who exceed their request by more than 20%.
Allocation is determined by an iterative process that incorporates the reward function of Eq. (5) to drive HEMS agent operation in order to determine the set of optimal possible load reductions for each j > 1 as per Eq. (3). The process is initiated for j = 1 by load prediction using the k-means clustering data (see Fig. 4) at the endpoints of the DR time interval, and then advanced via negotiation to determine each customer’s DR availability; whence

Note that, as per Eq. (3),  is the load reduction at time t confirmed by the HEMS agent for customer i during negotiation j using the output of the FLC. Negotiations continue until the target DR request has been met, or until no further progress toward improving individual demand reduction can be made, at which point the control variable is applied to each household by setting drProgramMandatory = TRUE. Note that this does not force the DR request to be obeyed. This is a purely voluntary transaction, although failure to follow through may incur a penalty (see EndDeviceControl in Appendix A). We also define a compliance metric,
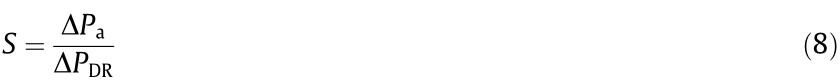
to quantify the efficacy of the transactive process in achieving the target DR request.
For our 10 customers in three clusters (as described in Section 4), negotiations are initiated as per Eq. (7), with each load prediction determined from the cluster consumption behavior (see Fig. 4) across the given time horizon. Reward diversity in the negotiation process is ensured by differences in the customers’ current power consumption and by their TDR compliance. Realistic values of the latter are generated by running multiple different demand cases, initiated with fixed reward r0, to construct a nominal set of compliance histories. Negotiations proceed via Eq. (6) by engaging each HEMS FLC, which defuzzifies for the given CCL mode the fuzzy outputs generated from the CSR ratio (i.e.,  Pi ) and the evolving DRR ratio (i.e., P). This introduces the necessary "give and take” in the dialogue between the TA and the HEMS agent, with ongoing negotiation providing input variation for a quasideterministic response.
《6. Emulation results》
6. Emulation results
Having developed our TDR scheme and physically realized it using the equipment shown in Fig. 1, we now perform a full operational validation, including negotiation and communication with all agents and loads. We demonstrate the efficacy of our TDR platform by system emulation using real residential energyuse data, as described earlier. These data are used to define the load shed availability (ordinarily provided to the HEMS agent by the HEMS), as further described below. Emulations are performed across a transactive network of 10 customers, with aggregate capacity fixed at 20 kW and aggregate DR availability at 12 kW. All participants are assumed to have the same individual capacities Pcap. As stringent tests of our transactive approach, two specific DR scenarios are investigated across the afternoon/evening demand peak from 5 pm to 8 pm (see Fig. 4): ① target DR reductions equal to aggregate DR availability (i.e., 12 kW), and ② target DR reductions of about 90% of the aggregate DR availability (i.e., 11 kW). We consider three different CCL mode scenarios: good—all customers; poor—all customers; and mixed—a random distribution of good and poor CCL mode customers (i.e., the average of 10 such scenarios, evenly distributed about an equal balance of good and poor modes). Ten different load profiles are derived for each customer by applying a random perturbation to the hourly consumption of the source profile while leaving the daily energy unchanged. This creates a dataset of statistically independent but nominally equivalent profiles for each customer that mimics day-to-day variation in consumption. The mean compliance ratio,  —see Eq. (8)—is found by averaging the ten different load assignment simulations.
Fig. 6 shows the evolution of negotiation for the 11 kW target DR request within a CCL mixed mode network, where triangle symbols denote the increasing aggregate demand reduction  for all households at each negotiation step, and squares denote the evolving target DR request DPdr. Note that after the first negotiation, many customers have already confirmed their requested reduction, for an aggregate reduction of 5 kW. The algorithm then addresses a reduced DR request of 6 kW to the remaining participants, and negotiation continues. After the fifth negotiation, no further progress is seen, so the algorithm reduces the request by 10% and negotiation continues. This results in an immediate marked increase in compliance, but ongoing negotiations affect no further change. Negotiations are terminated after ten iterations, and the final network compliance is determined to be 98%.
《Fig. 6》
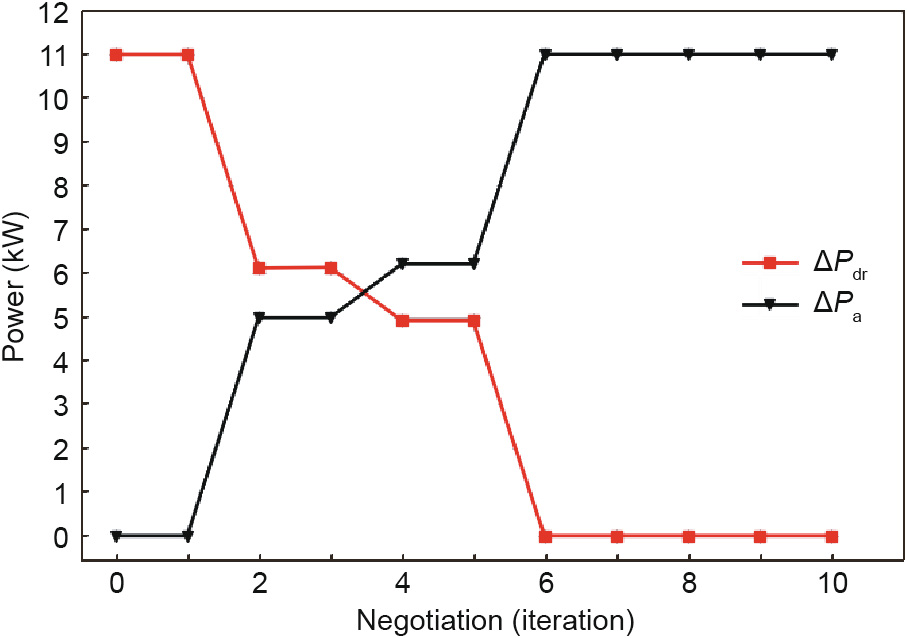
Fig. 6. Evolution of negotiation for a target DR request of 11 kW in CCL mixed mode, with specific load demands that differ across the network.
Behavior similar to that of the CCL mixed mode is seen in Fig. 7, where the negotiation responses for all residences with CCL good modes and all residences with CCL poor modes are compared. Overall, the responses are similar—they are nearly equal for the initial negotiations—but significant divergence is seen by the fourth negotiation. The subsequent reduction in the DR request after the fifth negotiation moderates, but does not fully eliminate, this divergence. As with all of our negotiations, after the sixth iteration, no significant compliance improvement is found. The end result is a 95% compliance for the network responding with only CCL poor modes, and perfect compliance for the network responding with only CCL good modes.
《Fig. 7》

Fig. 7. Comparison of the evolution of negotiation between CCL good and poor modes for a target DR request of 11 kW, with specific load demands that differ across the network.
Repeating the above for different load demand distributions across the ten home network creates an ensemble of statistically equivalent results, whose average reflects the probability that the target DR request can be accommodated. Evolution of the negotiations for all individual circumstances are found to be similar. The mean compliance ratio, , are summarized in Table 3 for all the scenarios introduced above. For even the most stringent of requests, where the DR target equals the network availability, the compliance exceeds 90% regardless of the compliance mode. For target requests of about 90% of aggregate DR availability, compliance exceeds 95% in even the worst case, and is perfect in the best case. CCL mixed mode results are uniformly found to fall midway between good and poor modes, suggesting that there may be a linear relationship between the degree to which customers agree to cooperate and the degree to which the target DR request is filled. All this suggests that our approach may be able to accommodate customers with even less capacity to comply.
《Table 3》
Table 3 Efficacy of transactive energy target DR requests for a 20 kW aggregate capacity and 12 kW aggregate DR availability, assessed over an ensemble of load demand distributions across the ten home networks.

Having seen the DR response in aggregate, let us now consider more generally the individual compliance with ongoing DR requests. For our network of ten customers, the aim is to gain insight into the range of responses under nominally independent DR events, but with an evolving reward function. Specifically, we wish to know, under operationally realistic conditions, how a customer’s historical compliance influences both negotiation and compliance, as well as the reward implications. To that end, for each DR event, we again randomly adapt the measured load profile for each customer to create datasets of statistically independent but nominally equivalent profiles that mimic day-to-day variation in consumption. We then repeat the above analysis for an 11 kW target DR request in CCL mixed mode (i.e., averaging over ten different combinations of CCL poor and CCL good) for 30 successive DR events, updating the reward function after each DR event.
Fig. 8 shows, for each customer, the incremental compliance with ongoing negotiation. Fig. 8(a) gives the results for the first DR event, and Fig. 8(b) for the 30th. Customer DR compliance is indicated in Watts by the color bar. Note first that negotiation begins with differing requests to each customer, as a consequence of their differing consumption rates and histories—see Eq. (6). Second, note that many customers typically lock-in their compliance early in the negotiation process, which is indicated in the plots by the varying horizontal color bar lengths. Third, we see that there is some variation in customer response during the negotiation processes (both increasing and decreasing responses, and seen in the color changes), as a consequence of the second constraint in Eq. (6). This variation promotes more optimal network response. Finally, comparison between Figs. 8(a) and (b) (DR events #1 and #30, respectively) reveals changes in individual compliances, both in magnitude and in the number of negotiations required. Customers 2, 3, and 10 engaged in one or two more rounds of negotiation, yielding modest increases (about 10%) in their DR response, while other customers were effectively unchanged. Let us consider more specifically how individual behaviors drive—and are driven by—reward evolution.
《Fig. 8》
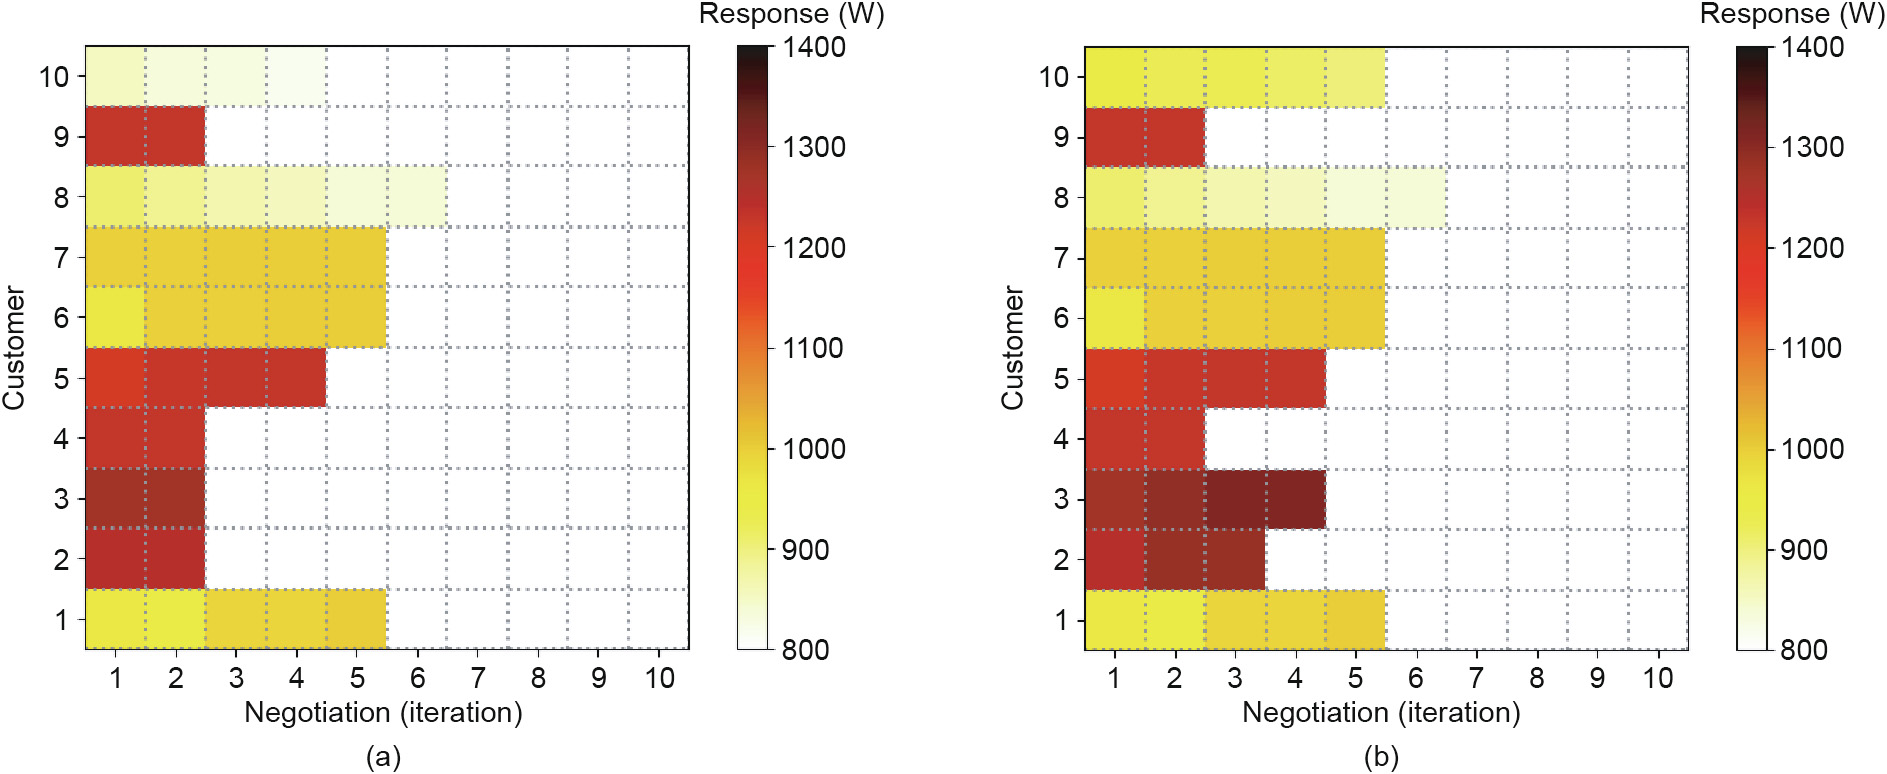
Fig. 8. Evolution of customer compliance with ongoing negotiation in CCL mixed mode for (a) the first DR event, and (b) the last DR event (#30).
We consider three representative customers: 3, 7, and 10. Fig. 9 shows how their rewards (black lines) evolve with ongoing DR requests (i.e., events): Figs. 9(a), (c), and (e) show this as a function of their consumption (red lines), while Figs. 9(b), (d), and (f) show this as a function of their compliance (red lines). Also shown are consumption and compliance averages (green lines) for comparison. Note that fluctuations in the consumption between events (and hence compliance variation) arise from the random perturbation of the load profile used to produce the datasets for each DR request; hence, it is only the overall trends that are meaningful. Customer 3 (Figs. 9(a) and (b)) is both high-consumption and high-compliance, with trends well above their means. Its reward is effectively unchanging, fluctuating close to the base reward of r0 = 1000. Customer 7 (Figs. 9(c) and (d)) has slightly higher consumption (by about 5%), but its compliance is indistinguishable from the mean. Its reward sees a near-factor-of-two decrease. Customer 10 (Figs. 9(e) and (f)) is low-consumption but with initially low compliance that trends toward the mean. Consequently, its reward trends modestly upward. These observations demonstrate the reward bias toward low-consumption customers who maintain meaningful participation, and against high-consumption customers whose participation is proportionally similar (i.e., average). High-consumption users must participate at better-than-average rates to even maintain reward parity; otherwise, they incur a substantial penalty over time. By contrast, low-consumption users are not negatively impacted, and will preferentially benefit as their compliance increases. These reward trends, which have influenced the negotiation process, are controlled through the consumption and compliance coefficients, c1 and c2, respectively, of Eq. (5). We have chosen an equal weighting to demonstrate what may be described as a fair allocation process, without explicit bias toward either consumption or compliance. These coefficients may be adjusted, with the effect that both slope and direction of the reward curves may be altered to promote or penalize specific behaviors.
《Fig. 9》

Fig. 9. Evolution of reward ri (black curve) with successive DR requests, shown against consumption (left column) and compliance (right column) behavior (red curves); also shown are their average behaviors (green curves). (a,b) Customers 3 and (c,d) 7 belong to class III (high-consuming), while (e,f) customer 10 belongs to class I (lowconsuming).
Network consumption diversity drives the optimization process by interaction with individual customer constraints (i.e., CCL, CSR, and DRR). This interaction is with the FLCs as the local agents that implement the demand reductions. Bounded outputs are ensured by the inherent input bounds on capacity and availability, as incorporated within the functional constraints of Eq. (6). A transparent illustration of algorithm robustness for the bounded response may be obtained by considering the subpopulation statistics (i.e., the sampling of the load distribution dataset) of Table 3 data, and verifying that the uncertainties decrease with increasing size of the transactive network (10 and 50). We consider, for CCL mixed mode (again averaging over ten different combinations of CCL poor and CCL good), target DR reductions equal to aggregate DR availability. We determine the mean compliance ratio, S, for three cases, each with its distinct load distribution. The results, presented in Table 4, confirm the behavior expected for bounded outputs. The mean is largely insensitive to the number of participants, but the uncertainties (i.e., the standard deviations) decrease for increasing network size while remaining nominally unchanged across the three cases (with the possible exception of one outlier).
《Table 4》
Table 4 Dependence of customer compliance statistics (CCL mixed mode) on network size and load distribution sampling.
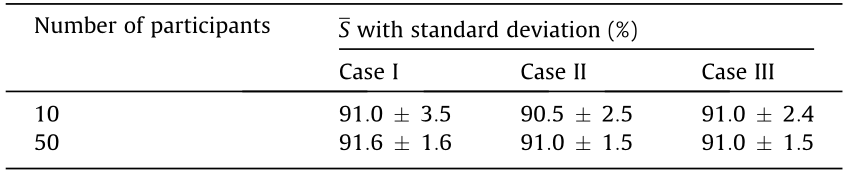
Fig. 10 shows the impact of transactive negotiation on the total demand trend before and after applying the 11 kW DR request to the ten-home-network in CCL mixed mode across the afternoon/ evening demand peak. A peak reduction of 22% (from 45 to 35 kW) is observed, with the demand shifted to later in the evening. This demand shift, enabled by the individual HEMS agents, was accomplished by rescheduling an equal weighting of typical residential interruptible and non-interruptible loads. Fig. 11 provides a complementary view of the impact of the DR event across the network using the peak-to-average ratio (PAR) [53]. The PAR is shown for each customer, without and with the DR request, and for the aggregate network. All customers are seen to contribute to the demand reduction, with the heaviest users seeing the greatest impact. Across the network (all customers), PAR is reduced by 14% (from 3.42 to 2.92). Note that PAR, because it is in reference to the average demand, is a metric that is less sensitive to the immediacy of the DR event, and therefore somewhat undervalues its impact.
《Fig. 10》
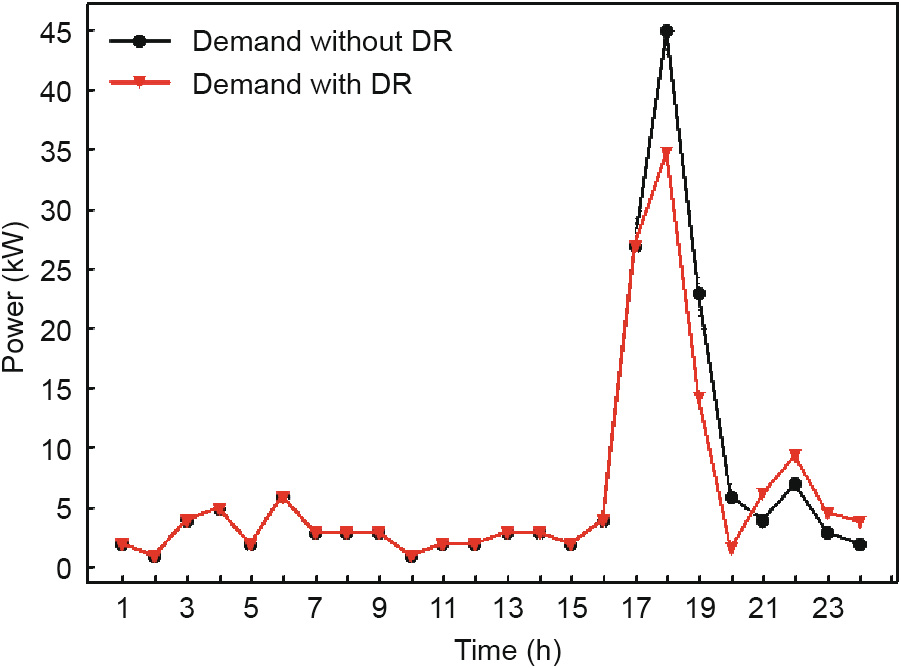
Fig. 10. The total demand trend before and after applying the 11 kW DR request for the CCL mixed mode response.
《Fig. 11》
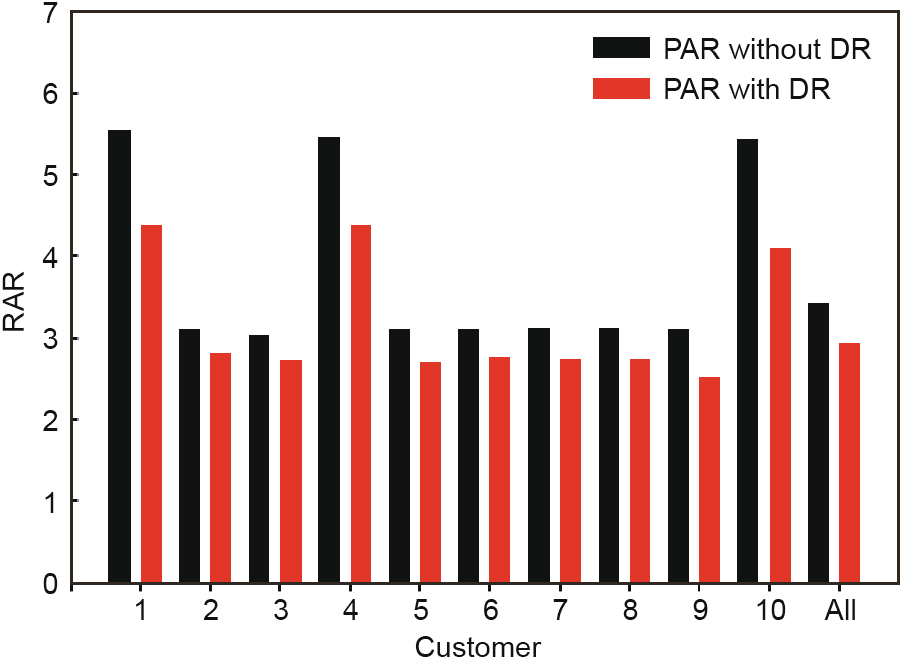
Fig. 11. The peak-to-average ratio (PAR) for all participants before and after the DR event.
《7. Conclusion》
7. Conclusion
We presented a DR scheme that employed transactive negotiation across a residential network at the transformer level. We took a multi-agent approach that emphasized customer comfort and privacy. A TA negotiated DR requests with customer agents (their HEMS agent), using an event-based optimization technique and a flexible reward mechanism. The agents responded to the DR requests by reducing their consumption based on compliance levels associated with their comfort expectations (expressed via fuzzy rule bases). We showed that our transactive DR scheme was able to reduce the peak demand by 22%, which is equivalent to a 14% PAR reduction. The results were based on anonymized smart meter data from real customers. Notably, our scheme used the IEEE 2030.5 SEP interoperability standard to transfer data between the agents, and thus constitutes the first known TDR use case for this standard. Although we have only used a portion of IEEE 2030.5 functionality within this TDR scheme, a complete SEP server was developed to ensure full agent compliance with the standard. The demonstrated efficacy within this restricted context strongly suggests that its full capabilities—including aggregation for distributed energy resource management systems and virtual power plant control, with market access and all necessary monetization requirements—are within imminent reach of all vendors and solution providers that choose to follow this scalable approach to achieving the smart grid vision.
《Acknowledgements》
Acknowledgements
This work is supported in part by Natural Sciences and Engineering Council of Canada (CRDPJ 477238-14) and Hydro Ottawa. The Hydro Ottawa led "GREAT-DR” project is gratefully funded in part by the Ontario Ministry of Energy’s Smart Grid Fund and the LDC Tomorrow Fund, and generously supported by the University of Ottawa, Carleton University, CIMA Canada Inc., Panasonic Eco-Solutions Canada Inc. (with Tabuchi Electric Company of America Limited), Quadra Power Inc., Energate Inc., Thorium Technologies Inc., and the IEEE Standards Association. The authors wish to acknowledge the vision and encouragement provided by Raed Abdullah (Hydro Ottawa Limited), The "GREAT-DR” project’s initiator and leader.
《Compliance with ethics guidelines》
Compliance with ethics guidelines
Javad Fattahi, Mikhak Samadi, Melike Erol-Kantarci, and Henry Schriemer declare that they have no conflict of interest or financial conflicts to disclose.
《Appendix A. Supplementary data》
Appendix A. Supplementary data
Supplementary data to this article can be found online at https://doi.org/10.1016/j.eng.2020.06.005.


 京公网安备 11010502051620号


