
《1. Introduction》
1. Introduction
Primary hepatocytes (PHCs) are considered to be ideal for the evaluation of drug-metabolism interactions [1], the modeling of hepatotropic infectious diseases [2], and the transplantation of hepatocytes [3]. Compared with other models, such as hepatic cell lines and stem cell-derived hepatocyte-like cells that are not metabolically competent, PHCs perform much better [4]. Depending on precise spatiotemporal regulation from microenvironmental signals, terminally differentiated PHCs are functionally stable in vivo, while isolated PHCs suffer from dedifferentiation or epithelial-to-mesenchymal transition (EMT) in vitro over a short period of time, characterized by changes in morphology, dramatic disturbance in gene expression, selective variation in proteins, and a decline in hepatic functions [5–7]. To a large extent, the dedifferentiation process limits the long-term utility of PHCs.
Recently, dedifferentiation-related mechanisms have been partially elucidated, including the participation of protein kinase B (Akt), extracellular regulated protein kinases 1/2 (ERK1/2) [6], mitogen-activated protein kinase (MAPK), and nuclear factor kappa-B (NF-κb) [8] signaling pathways; the downregulation of hepatocyte nuclear factors (HNFs) such as HNF4α and HNF1; the induction of Snail [9]; and the disturbance of the noncoding transcriptome [10]. Various strategies have been employed to try to maintain hepatic characteristics in vitro culture, either by changing the expression of intracellular genes, or by changing compounds from the external surrounding environment. Overexpression of HNF4a, coculture with hepatic nonparenchymal cells, and application of a three-dimensional (3D) and dynamic perfusion system have been used previously [11–15]. Recently, Xiang et al. [16] demonstrated that the combination of forskolin (FSK); a specific inhibitor of transforming growth factor β (TGF-β) superfamily type I receptors activin receptor-like kinase 4 (ALK4), ALK5, and ALK7 (SB43); N-[N-(3,5-difluorophenacetyl)-L-alanyl]-S-phenylglycine t-butyl ester (DAPT); inhibitor of Wnt production 2 (IWP2); and bone morphogenetic protein (BMP) inhibitor LDN193189; could help to maintain some hepatic functions for several weeks by blocking TGF-β pathways. However, the exact mechanisms are unclear, and stable maintenance of global hepatic characteristics in vitro still remain challenging.
It is notable that the limited insights provided by the transcriptome are insufficient because of the low correlation between messenger ribonucleic acid (mRNA) and protein expression [17]. Furthermore, considering the large amount of high-abundance proteins in the liver, it is difficult to find a few key proteins with low abundance using traditional whole cell proteome (WCP) analysis. Thus, we speculate that posttranslational modification (PTM) might provide more valuable information.
Ubiquitin, a protein with 76 amino acids, can be conjugated to substrates under the cooperation of three enzymes: the ubiquitin-activating enzyme (E1), the ubiquitin-transferring enzyme (E2), and the ubiquitin ligase (E3). Ubiquitination is reversible through deubiquitylating enzymes (DUBs) by removing the ubiquitin modification from substrates [18]. Ubiquitin can code for several distinct signals, including a single site (monoubiquitination), multiple sites (multiple mono-ubiquitination), and a ubiquitin chain (polyubiquitylation). Each of the seven internal lysine (K) residues of ubiquitin, including K6, K11, K27, K29, K33, K48, and K63, as well as N-terminal methionine (M1), can act as an acceptor site for chain extension. As a dynamic multifaceted PTM, chain architecture is a critical determinant of chain function. K48 and K11 linkages are generally associated with protein degradation at the 26S proteasome, while K63- and K27- linked chains are associated with nondegradative functions [19].
More than one study has revealed the important role of ubiquitination during differentiation or dedifferentiation processes in cells, with the exception of PHCs. Through ubiquitin–proteasome system (UPS)-targeted RNA interference (RNAi) screens, Buckley et al. [20] and Choi and Baek [21] revealed the important role of FBXW7 (E3) in embryonic stem cell (ESC) differentiation by targeting c-Myc for degradation. In addition, the differentiation of human CD4+ T cells into T helper cells requires ubiquitin modification [22]. The UPS regulator, UBA1, is obviously upregulated after differentiation to motor neurons from induced pluripotent stem cells (iPSCs) [23]. Functional analysis of the transcriptome by Lauschke et al. [10] indicated enrichment of the ubiquitination pathway during hepatocyte dedifferentiation. Thus, these findings provide a rationale for hypothesizing the important role of ubiquitination in hepatocyte dedifferentiation. As for the pervasive coregulation between PTMs [24], ubiquitination also communicates with phosphorylation to fulfill various cellular activities [19,25].
In this study, the temporal ubiquitinome and phosphoproteome of dedifferentiated PHCs at five time points were systematically analyzed using a liquid chromatography–tandem mass spectrometry (LC–MS/MS) approach, which extends the findings from previous studies and offers a fundamental platform for future studies to create novel strategies to better maintain hepatic characteristics in vitro.
《2. Material and methods》
2. Material and methods
《2.1. Experimental design and statistical rationale》
2.1. Experimental design and statistical rationale
The WCP, ubiquitinome, and phosphoproteome of the soluble proteins derived from dedifferentiated rat PHCs and four cell lines were analyzed using HF-X mass spectrometry (MS). Four biological replicates of PHCs at each indicated point were analyzed in each experiment in order to validate the biological reliability of the measurements.
We applied a standard paired t-test to determine whether a statistically significant difference existed between dedifferentiation (6, 12, 24, 48 h) and 0 h.
《2.2. Primary rat hepatocytes isolation and cell culture》
2.2. Primary rat hepatocytes isolation and cell culture
Male Sprague Dawley rats (250–300 g) were obtained from the Zhejiang Laboratory Animal Center. The animals were housed in stainless steel cages under a 12 h dark/light cycle. PHCs were isolated by a two-step enzyme perfusion method with some improvement [26]. To be specific, the rats were anesthetized by 4% (w/v) chloral hydrate (0.7 mL per 100 g) intraperitoneally. The liver was perfused in situ through the portal vein using Ca2+-free medium containing 1 μmol·L-1 ethylenediaminetetraacetic acid (Sigma-Aldrich, USA) until the blood was flushed completely. Then, perfusion liquid containing 0.08% (w/v) dispase (Gibco, USA) at 37 °C was added to the perfusion apparatus, followed by perfusion medium with 0.05% (w/v) collagenase IV (Sigma-Aldrich, USA). Two types of perfusion liquid were alternatively infused until tiny cracks appeared on the surface of the rat liver. The liver was then moved to a beaker containing cool wash buffer and gently minced with clean scissors. The digested cells were purified by Percoll gradient centrifugation (GE Healthcare, Sweden). Only hepatocytes with high viability (> 90%) were used in the following experiments. PHCs were re-suspended in Williams E medium (Sigma-Aldrich, USA) and plated onto collagen-I-coated plates (BD Dickinson, USA) at a density of 1 × 10⁷ cells per 10 cm dish. Williams E medium was supplemented with 10% fetal bovine serum (FBS) (Gibco, USA), 1× insulin-transferrin-selenium (Life Technologies, USA), 0.1 mmol·L-1 dexamethasone (Life Technologies, USA), 1× L-glutamine (Life Technologies, USA), and 1× penicillin (100 units·mL1 )/streptomycin (100 μg·mL-1 ) (Sigma-Aldrich, USA). After 3 h, the medium was replaced with FBS-free medium.
《2.3. Super-SILAC sample preparation》
2.3. Super-SILAC sample preparation
MAC-RH-777, RH-35, HSC-T6, and CRHR-7919 cells were cultured in stable isotope labeling by amino acids in cell culture (SILAC) Dulbecco’s modified eagle medium (DMEM) supplemented with 10% dialyzed FBS, 13C615N4-arginine (Arg10) (50 μg per 500 mL), and 13C615N2-lysine (Lys8 ) (50 μg per 500 mL) (SigmaAldrich, USA). The cells were cultured for at least six passages until they were fully labeled [27]. Equal amounts of the heavy labeled lysates (1:1:1:1) were mixed to generate the super-SILAC mix.
《2.4. Protein extraction and digestion》
2.4. Protein extraction and digestion
PHCs at 0 h were referred to as freshly isolated hepatocytes before plating. PHCs at indicated time points and four cell lines were washed twice using cold 1× phosphate buffer saline (PBS) before adding lysis buffer (1× protease inhibitor, 1× phosphorylase inhibitors, 1× PR-619 in 8 mol·L-1 urea). Lysate was then centrifuged at 11 304 r·min-1 at 4 °C for 10 min to separate the insoluble fragments. The supernatant in the centrifuge tube was collected, and the protein concentration was assayed using a BCA protein assay kit (Invitrogen, USA). At each of the indicated time points, 10 mg of protein was mixed with 1 mg of super-SILAC.
The mixed proteins were reduced with 5 mmol·L-1 dithiothreitol (DTT) for 30 min at 30 °C, and then carbamidomethylated with 15 mmol·L-1 iodoacetamide (IAA) for 30 min at room temperature (RT) in the dark. Next, 8 mol·L-1 urea in the lysate was replaced by 50 mmol·L-1 ammonium bicarbonate (ABC) with the help of Zeba spin desalting columns (Thermo Fisher Scientific, USA). All the samples were digested overnight at 37 °C with a trypsin-to-substrate ratio of 1:40 (w/w). After digestion, the peptides were acidified with trifluoroacetic acid (TFA), with a final concentration of 1% (pH ≤ 3). The acidified peptides were centrifuged at 1696 r·min-1 for 15 min, and the supernatant was desalted using preconditioned C18 Sep-Pak SPE cartridges (Waters, USA) [28]. The desalted peptides were lyophilized over 48 h in a vacuum lyophilizer (LABCONCO, USA).
《2.5. Chemical cross-linking of anti-K-ε-GG antibody》
2.5. Chemical cross-linking of anti-K-ε-GG antibody
We used the PTMScan® ubiquitin remnant motif (K-ε-GG) kit (CST, USA) and PTMScan® phospho-Ser/Thr motif [pS/T] kit (CST, USA) in our experiment. All beads were re-suspended in 20 mmol·L-1 dimethyl pimelimidate (DMP) (Sigma, USA) and incubated at RT for 30 min with gentle end-over-end rotation. To stop the cross-linking reaction, the beads were incubated in 200 mmol·L-1 ethanolamine (pH 8.0) for 2 h at 4 °C. After linking, the beads were washed three times with 1 mL cold 1× PBS.
《2.6. Enrichment of ubiquitinated and phosphorylated peptides》
2.6. Enrichment of ubiquitinated and phosphorylated peptides
Dried peptides were re-suspended in 1× IAP buffer (CST, USA) and centrifuged at 9420 r·min-1 for 10 min at 4 °C to remove insoluble material. The supernatant was incubated with washed crosslinked beads in tubes for 2 h. The tubes were centrifuged at 94 r·min-1 for 30 s to collect the beads. The beads were washed three times with 1 mL of cold 1× IAP buffer, and the ubiquitinated peptides were eluted by adding 50 μL of 0.15% TFA. The elution was dried completely by vacuum centrifugation and then used in the following steps. Similarly, the enrichment of phosphorylated peptides based on PTMScan® Phospho-Enrichment IMAC Fe-NTA Magnetic Beads (CST, USA) was performed according to the instructions.
《2.7. Tandem mass tags labeling》
2.7. Tandem mass tags labeling
After enrichment, the modified peptides were labeled using tandem mass tags (TMT) kit (TMT10plex). PHCs from five time points of replicate 1 were labeled as 126, 127N, 127C, 128N, and 128C; PHCs from five time points of replicate 2 were labeled as 129N, 129C, 130N, 130C, and 131. Replicate 3 and replicate 4 were labeled using another TMT10plex kit. The peptides were dissolved in 100 mmol·L-1 tetraethylammonium bromide (TEAB) (pH = 8.0) and mixed with 8 μL TMT label reagent. After 1 h of reaction at RT, 5% hydroxylamine was added and the reaction mixture was incubated for 15 min to quench the reaction. All samples were combined together in a new tube and a brief centrifugation was used to remove the insoluble materials. The supernatant was desalted via homemade C18 stage tips and then dried completely.
《2.8. Strong cation exchange chromatography》
2.8. Strong cation exchange chromatography
Labeled peptides were re-suspended in 80 μL of a 15% acetonitrile (ACN) and 0.1% TFA solution and fractionated by handmade strong cation exchange (SCX) tips. The SCX tips were preconditioned with 80 μL ACN; 80 μL 80% ACN and 0.1% TFA; 80 μL 15% ACN, 500 mmol·L-1 NH4C2H3O2, and 0.1% TFA; and 80 μL 15% ACN and 0.1% TFA. Five fractions were generated through a series of elutions from 30 to 250 mmol·L-1 NH4C2H3O2 in 15% ACN. After fractionation, the labeled peptides were desalted and lyophilized completely.
《2.9. LC–MS/MS analysis》
2.9. LC–MS/MS analysis
Lyophilized peptides were dissolved in 0.1% formic acid (FA) and 2% ACN. The peptides were analyzed via the UltiMate 3000 RSLCnano system (Thermo Fisher Scientific, USA) attached to Q Exactive HF-X (Thermo Fisher Scientific, USA). We utilized a constant flow rate of 400 nL·min-1 with a 120 min linear gradient from 3% to 80% of the solvent buffer of 0.1% FA for the initial response. The MS spectra of the WCP, ubiquitinome, and phosphoproteome were acquired using 120 000 resolution with a mass range of 300–1500 m·z-1 and an automatic gain control (AGC) target of 3E6. We applied 30 000 resolution and higher energy collisioninduced dissociation (HCD) fragmentation with a collision energy of around 27% during MS2 spectra acquisition. In addition, we used a data-dependent method for the top 20 on MS2 with an AGC target of 2E5. The isolation window was 1.0 m/z. Charge exclusion was set to below 2 and above 7. Dynamic exclusion was set to 30 s.
《2.10. Database search》
2.10. Database search
Peptides were identified and quantified by searching against the UniProtKB rat database (released April 2019) using MaxQuant software (v.1.6.3.4) [26]. Carbamidomethyl (C) was the fixed modification in all search process. When searching for ubiquitinated sites, oxidation (M), acetyl (protein N-term), and GlyGly(K)_10plex_TMT were set as variable modifications. Similarly, GlyGly(K)_10plex_TMT was replaced with "Phospho” (STY) during the search for phosphorylated peptides. Trypsin was set as the specificity of digestion, and the max missed cleavage sites was 2. We used 20 parts per million (ppm) in the first search of ion tolerance and 4.5 ppm in the main search of ion tolerance. Both peptide identification and protein identification were filtered at a false discovery rate (FDR) < 1%. Both ubiquitinated and phosphorylated sites were identified with a localization probability > 0.9. Except for the aforementioned parameters, the default parameters of MaxQuant were applied.
The MS proteomics data have been deposited to the ProteomeXchange Consortium via the iProX partner repository [29] with the dataset identifier PXD015897.
《2.11. Bioinformatics analysis》
2.11. Bioinformatics analysis
Significance differences (P value) were determined by a paired t-test. Significantly different proteins or sites were defined as fold change (FC) > 1.5 and P < 0.05 versus 0 h. A protein or site with an obvious difference was defined as FC > 1.5 without a limitation of the P value.
Gene ontology (GO) and Kyoto Encyclopedia of Genes and Genomes (KEGG) pathway analysis were conducted on WebGestalt based on over-representation analysis (ORA) [4]. A value of P < 0.05 was considered to be significantly enriched.
Amino acid motif enrichment was analyzed using WebLogo3 [30]. A protein–protein interaction (PPI) network was constructed using the STRING database [31]. Functional protein interaction networks were visualized using Cytoscape [32]. Hub proteins were identified by cytoHubba for ranking nodes [33]. Temporal clustering analysis was performed with Perseus [34].
《2.12. Western blotting》
2.12. Western blotting
A total of 20 μg of protein was separated using 12% polyacrylamide gels, and then transferred to nitrocellulose filter membranes (Bio-Rad, USA). 1× blocking buffer (Beyotime, China) was used to block the membrane for 30 min at RT. The membrane was then incubated with antibodies against HNF1α (Cat#: 89670S; 1:2000; CST, USA), E-cadherin (Cat#: 76055; 1:1000; Abcam, USA), N-cadherin (Cat#: 98952; 1:1000; Abcam, USA), or vimentin (Cat#: 92547; 1:1000; Abcam, USA) at 4 °C overnight. The membrane was washed three times using 1× washing buffer before incubation with a corresponding secondary antibody.
《2.13. Flow cytometry》
2.13. Flow cytometry
After Percoll purification, 5 × 10⁶ PHCs were washed twice by 1× PBS and then fixed with 4% paraformaldehyde for 15 min at RT. Triton-100 was used to aid in permeabilization. According to the manufacturer’s protocol, the albumin (ALB) antibody (Cat#: ab207327; Abcam, USA) was used at a concentration of 1:500 (w/w).
《2.14. Immunofluorescence》
2.14. Immunofluorescence
PHCs cultured on coverslips were washed twice with 1× PBS and fixed in 4% paraformaldehyde for 15 min at RT. The hepatocytes were then permeabilized with 0.5% Triton X-100 for 10 min at RT and blocked in 5% bovine serum albumin (BSA) for 20 min. The cells were incubated with antibody against E-cadherin (Cat#: 76055; 1:500; Abcam, USA), N-cadherin (Cat#: 98952; 1:500; Abcam, USA), or vimentin (Cat#: 92547; 1:500; Abcam, USA) at 4 °C overnight and then treated with the corresponding secondary antibody at RT for 1 h. Nuclei were dyed with 40 ,6-diamidino-2- phenylindole (DAPI) (Abcam, USA) for 4 min at RT before observation.
《2.15. Real-time quantitative polymerase chain reaction (qPCR) analysis》
2.15. Real-time quantitative polymerase chain reaction (qPCR) analysis
Total RNA was isolated using Trizol (Sigma-Aldrich, USA) and reverse-transcribed using a cDNA first strand synthesis kit (Roche Applied Science, Germany). Polymerase chain reaction (PCR) was performed using SYBR Green PCR master mix (Roche Applied Science, Germany) with a QuantStudio5 PCR system (Thermo Fisher Scientific, USA). The primers are listed in Table S1 in Appendix A.
《2.16. Microarray analysis》
2.16. Microarray analysis
We conducted three replicates at each time point. The samples were conducted by Shanghai OE Biotech Co., Ltd., using Agilent rat microarray lncRNA V3 (8 × 60 K, Design ID: 084409). Genes that were not only detected among all five time points, but also significantly different between adjacent time points (P < 0.05, FC > 1.5) were included in the following analysis.
《3. Results》
3. Results
《3.1. Dedifferentiation-related markers were consistently increased during in vitro culture of PHCs》
3.1. Dedifferentiation-related markers were consistently increased during in vitro culture of PHCs
After isolation and purification, PHCs were confirmed by high expression of ALB (Fig. 1(a) and Fig. S1 in Appendix A) and relatively low expression of a marker of liver sinusoidal endothelial cells (vWF), a marker of Kupffer cells (CD163), and markers of hepatic stellate cells (desmin, CK-43, a-SMA) (Fig. S2 in Appendix A). The obvious loss of E-cadherin expression after 6 h and the dramatic induction of mesenchymal protein markers, including N-cadherin and vimentin, after 24 h of in vitro monolayer culture were observed, similar to previous reports (Figs. 1(b)–(g)) [7]. The corresponding mRNAs demonstrated the same trend, as shown in Fig. S3 in Appendix A. Furthermore, the PHCs lost their hepatic architecture, which was replaced with a fibroblast-like shape after 72 h, indicating that cellular structural remodeling came later (Fig. S4 in Appendix A).
Collectively, we demonstrated that rat PHCs at the indicated time points are good models to study PHC dedifferentiationrelated mechanisms.
《Fig. 1》

Fig. 1. PHCs undergo dedifferentiation in vitro. (a) Identification of the proportion of albumin secreting cells into PHCs by flow cytometry. FL1 refers to the fluorescence of control group (left) and positive group (right) incubated with fluorescein isothiocyanate (FITC)-conjugated secondary antibody from the first channel. Compared to PHCs in positive group incubated with anti-ALB antibody, PHCs in control group are incubated with PBS instead. FL1 lg(-99.1) represents 99.1% PHCs in the control group are nonALB-expressing. FL1 lg(+0.93) represents 0.93% PHCs in the control group are ALB-expressing, which stands for the false positive rate. FL1 lg(–0.095) represents 0.095% PHCs in the positive group are non-ALB-expressing. FL1 lg(+99.9) represents 99.9% PHCs in the positive group are ALB-expressing. (b) Immunofluorescence shows the change in EMT markers, including E-cadherin, N-cadherin, and vimentin at the indicated time points. 0 h represents hepatocytes immediately isolated from the liver before plating on the monolayer (scale bar, 100 μm). (c) Immunoblot analysis of the protein level of HNF1α and three EMT markers. Glyceraldehyde-3-phosphate dehydrogenase (GAPDH) is shown as the loading control. (d–g) Blots represent three independent experiments with densitometry showing the mean ± standard deviation. *, **, and *** represent P < 0.05, 0.01, and 0.001 versus 0 h, respectively; error bars represent mean ± standard deviation.
《3.2. Combined application of TMT and super-SILAC in omics》
3.2. Combined application of TMT and super-SILAC in omics
Thus far, studies related to ubiquitinome need to use a large amount of protein—at least 10 mg—due to the low stoichiometry of ubiquitinated proteins. Given that only about 5 mg of protein from isolated PHCs could be acquired per rat, it was difficult to obtain enough cells at each indicated time point. Thus, we decided to perform a pooling strategy in order to obtain sufficient materials for the following study. We isolated hepatocytes from a total of 40 healthy Sprague Dawley rats, and then randomly divided the cells into four biological replicates. We then collected 1 mg of protein from each rat at each indicated time point and combined the proteins belonging to the same replicate at the same time point into one tube (Fig. 2). This strategy finally provided enough protein and ample replicates for further research.
Considering that different efficiencies at the peptide level during immunoprecipitation (IP) might induce technical variation, we used super-SILAC to achieve accurate quantification. Four representative cell lines, including RH-35, CHRH-7799, HSC-T7, and MAD-25, were fully labeled with heavy stable isotope, until were then mixed at the ratio of 1:1:1:1 (w/w) as an internal spike—in standard, called super-SILAC [27].
In the previous literature, equal amounts of super-SILAC and samples have always been used, but this was very difficult to realize in the ubiquitinome because of such a substantial requirement [27]. Therefore, we explored a new method to minimize the consumption of super-SILAC. Our rationale was that with the help of TMT labeling, we could detect up to 10 samples at a time. This cumulative effect might make the low-abundant sites detectable by accumulating the number of ubiquitinated sites in each sample. Thus, two panels of TMT10plex were used as grouping tools to distinguish the sample from four replicates and five time points. We used a super-SILAC-to-sample ratio of 1:10. Theoretically, quantification at the protein level would be more precise than at the peptide level, if subsequent enrichment processing was required (Fig. 2). Finally, 63 ubiquitinated sites and 270 phosphorylated sites were quantified in all four super-SILAC replicates. An obvious drawback of this method should be noted: The reduced amount of super-SILAC was accompanied by reduced sample coverage. To address this problem, we corrected our MS data at the overall level, instead of relying on individual protein quantified in both the sample and super-SILAC, or establishing a normal distribution of lowabundant proteins [27,35]. To be specific, we defined the average intensity of super-SILAC at 0 h from panels 1 and 2 as a reference, according to the formula shown below:
《Fig. 2》
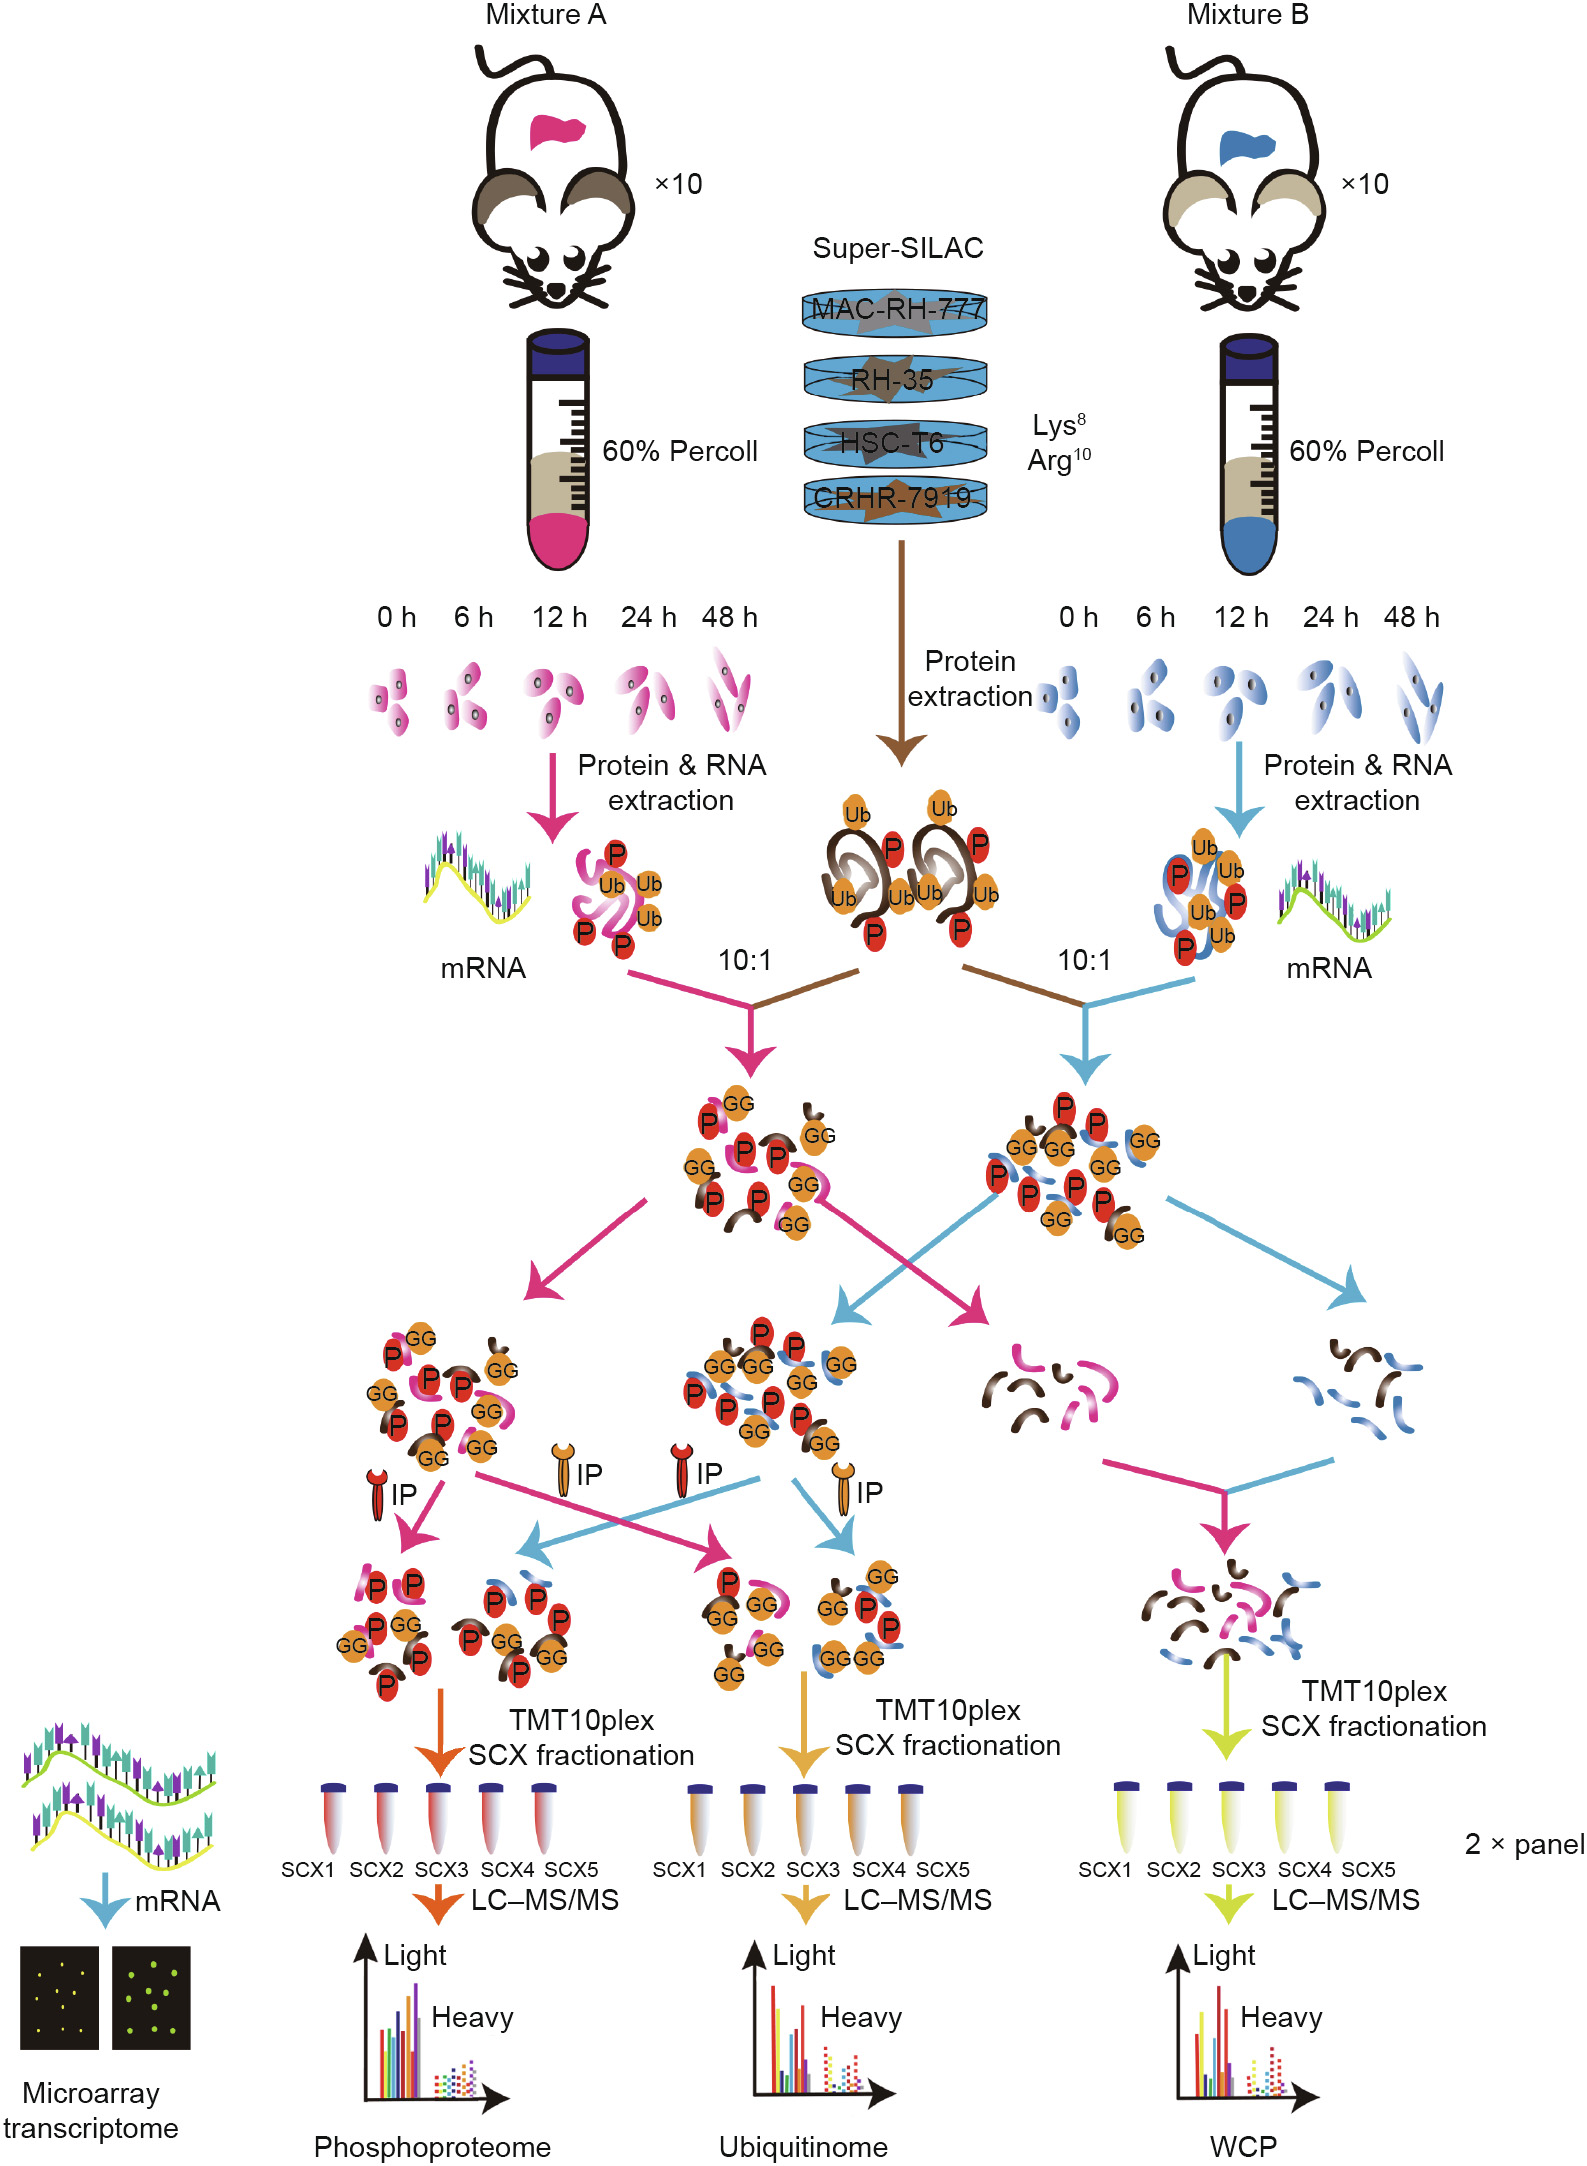
Fig. 2. Experimental workflow of the proteomic analytical steps for protein purification, trypsinization, antibody-based enrichment, and bioinformatic analysis. Ub: ubiquitination; GG: di-glycine peptide; P: phosphorylated modification; IP: immunoprecipitation.
Panel 1 corrected coefficient = average intensity of super-SILAC from replicate 1 (or 2) at 6 h (or 12, 24, 48 h) / average intensity of super-SILAC from replicate 1 at 0 h.
Panel 2 corrected coefficient = average intensity of super-SILAC from replicate 3 (or 4) at 6 h (or 12, 24, 48 h) / average intensity of super-SILAC from replicate 3 at 0 h.
To make the datasets comparable and the subsequent integrative analysis reliable, we first conducted WCP analysis, and then enriched the ubiquitinated remnants and phosphorylated residues. The above correction standard was applied to the three omics.
Thus, we combined TMT and super-SILAC for the WCP, ubiquitinome, and phosphoproteome analysis for the first time.
《3.3. The dedifferentiation-related WCP》
3.3. The dedifferentiation-related WCP
Many reports targeting hepatocyte dedifferentiation have been based on genetic levels, such as the genome and microRNA, or proteins; however, studies have seldom focused on PTMs [36–38]. In order to make our work more reliable and accurate, we decided to conduct an in-depth WCP analysis first, for several reasons: ① Abundance changes in the modified sites might result from changes in protein content, instead of the real changes in the PTMs. ② The differences in sample collection and workflow between previous studies and our work might render previous proteomics data and our PTM data non-comparable. ③ With the development of algorithms and MS, we could detect more proteins (sites), which could provide a more comprehensive understanding of this process.
In total, we identified 2196 proteins, 2188 of which were quantified in at least two replicates, and 1928 of which were quantified in all replicates (Fig. 3(a)). Compared with the proteomics data from Cliff Rowe in 2010 [38], 1929 proteins were newly quantified in our WCP (Fig. 3(b)). Vimentin, a marker of EMT [7], was significantly upregulated at 48 h from our WCP data in all experiments, which was consistent with the Western blot and immunofluorescence results (Fig. 3(c)). After correction by super-SILAC, the correlation coefficients ranged between 0.87 and 0.99 for the pair-wise comparisons of protein abundances at different time points (Fig. 3(d)). In general, we performed reproducible WCP analysis and quantified relative protein abundances during hepatocyte dedifferentiation. In the subsequent experiments, we corrected the PTM changes using changes in protein abundance if possible; otherwise, the uncorrected PTM datasets were used for further analysis.
《Fig. 3》
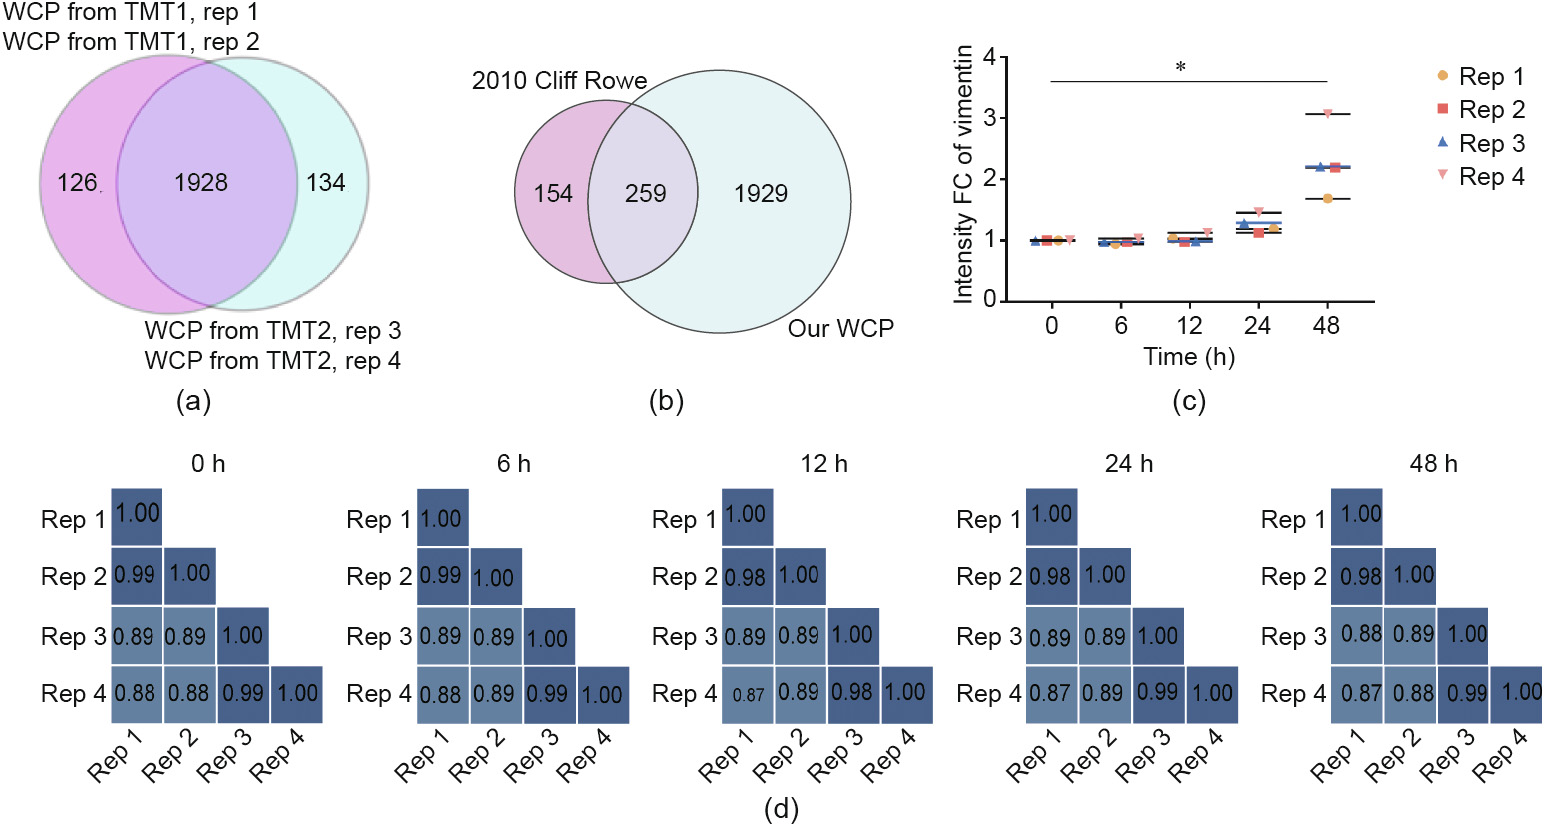
Fig. 3. Dedifferentiation-related WCP. (a) The Venn diagram indicates the number of proteins quantified in each replicate and the overlap among them. (b) Comparison between our data and an external dataset. (c) Vimentin was significantly increased in our WCP data (* represents P < 0.05). (d) Pearson correlation coefficients among four replicates at the indicated time points. Rep: replicate.
To identify the changes in protein abundance during hepatocyte dedifferentiation, we compared protein abundances at 6, 12, 24, and 48 h (defined as dedifferentiated stages) with those at 0 h (defined as the un-dedifferentiated stage). We found that with in vitro culture time, the number of significantly different proteins (threshold FC > 1.5 and P < 0.05) became larger, from 35 proteins at 6 h to 110 proteins at 48 h (Fig. S5(a) and Table S2 in Appendix A). GO analysis indicated that significantly different proteins were mainly located in the mitochondria before 24 h and in the cytoskeleton at 48 h, and biological process (BP) terms indicated enrichment in oxidation–reduction. KEGG analysis illustrated the downregulation of hepatic metabolic functions, such as fatty acid degradation, fatty acid metabolism, and carbon metabolism (Fig. S5(b)).
Thus, our WCP data effectively captured dedifferentiationinduced protein changes.
《3.4. Poor correlation between transcripts and corresponding protein abundance during hepatocyte dedifferentiation》
3.4. Poor correlation between transcripts and corresponding protein abundance during hepatocyte dedifferentiation
It is well known that protein abundance is the comprehensive outcome of its production and degradation. To determine whether decreased (or increased) protein resulted from less (or more) mRNA translation or more (or less) protein degradation, we conducted transcriptome analysis (GSE138071) corresponding to the indicated time points of the WCP. The Pearson correlation coefficients among three replicates at the indicated time points ranged over 0.9, suggesting good reproducibility (Fig. 4(a)). Through unsupervised principal component analysis (PCA) of the transcriptome, hepatocytes belonging to the same time point were grouped together, and samples at 24 and 48 h were close to each other but far away from 0 h (Fig. 4(b)). This result was encouraging, because many factors, including individual differences and the length of digestion time, were not the same from the first rat to the last, although they were important factors in affecting the state and the final mRNA expression of PHCs. Thus, it demonstrated that dedifferentiation-specific factors dominated the transcriptome rather than other factors. The transcriptome data covered 1803 (85.5%) of the proteins quantified in WCP (Fig. 4(c)). Furthermore, we found a poor correlation between the transcriptome and corresponding protein abundance during dedifferentiation (Pearson correlation coefficient between 0.02 and 0.23, Fig. 4(d)). Compared with the significantly regulated mRNA, over 93% of the corresponding proteins at each time point remained unchanged, and several proteins changed in the opposite direction to their associated mRNA (Fig. S6 in Appendix A). Four proteins, including ac1873, fibrinogen β chain, tyrosine aminotransferase, and apolipoprotein C-I, were significantly increased at 24 h, while their mRNA levels were dramatically decreased. The same trend was observed in apolipoprotein C-I, myosin light chain 1/3, skeletal muscle isoform, and apolipoprotein E at 48 h. Another protein, the activator of Hsp90 ATPase activity 1, demonstrated upregulated mRNA and downregulated protein abundance at 24 h.
Thus, we suggest that the PTMs induced the discordance between the transcriptome and the WCP of the dedifferentiation.
《Fig. 4》

Fig. 4. Poor correlation between the WCP and transcriptome during PHC dedifferentiation. (a) Pearson correlation of the transcriptome among the replicates at each indicated time point demonstrates great reproducibility. (b) PCA analysis of the transcriptome from three replicates at each indicated time point. (c) Venn diagram shows overlap between the WCP and transcriptome. (d) Correlation coefficients between the WCP and transcriptome.
《3.5. The first ubiquitinome during PHC dedifferentiation》
3.5. The first ubiquitinome during PHC dedifferentiation
To acquire a stringent quantification of the ubiquitinome, we first used super-SILAC as a reference, as mentioned earlier. We identified 2056 di-glycine sites, 1952 of which were quantified with high-confidence (localization probability > 0.9) mapping to 1028 unique proteins during dedifferentiation (Fig. S7(a) in Appendix A). Of the 1028 ubiquitin modified proteins, 437 were only identified by their di-glycine residue, whereas the remaining 591 were also identified by WCP, suggesting that the enrichment of di-glycine residues efficiently revealed a particular subset of proteins that might otherwise remain undetected in the WCP analysis (Fig. S7(b)).
Ubiquitinated proteins with single di-glycine modification were 61% (6.31 × 10⁴ ), while 39% (3.96 × 10⁴ ) contained multiple diglycine sites (Fig. S7(c)). The maximum number of di-glycine sites per protein was 31 for ribosome-binding protein 1. Other proteins containing ten or more di-glycine remnants were heat shock cognate 71 kDa (1 kDa = 1000 g·mol–1) protein, cytochrome P450 2E1, aldo-keto reductase family 1 member D1, transitional endoplasmic reticulum ATPase, keratin, and type II cytoskeletal 8,4- hydroxyphenylpyruvate dioxygenase. After motif sequence analysis of ubiquitinated peptides, we found no conserved motifs around the K residue (Fig. S8 in Appendix A). The correlation coefficients of four independent replicates at each time point ranged between 0.61 and 0.96 at the peptide level, demonstrating a reproducible ubiquitinome workflow (Fig. S7(d)).
Compared with those at 0 h, 105 (58), 139 (40), 143 (38), and 184 (49) peptides were significantly upregulated (downregulated) at 6, 12, 24, and 48 h, respectively (FC > 1.5, P < 0.05), indicating that the longer the in vitro culture, the greater the number of changed ubiquitinated sites (Fig. S7(e). KEGG pathway analysis of significantly upregulated ubiquitinated proteins was enriched in the glycolysis/gluconeogenesis and metabolism of xenobiotics by cytochrome P450 before 24 h. At 48 h, significantly downregulated ubiquitinated proteins were enriched in ferroptosis (Fig. S9 in Appendix A). The gene ontology (GO)-cellular component (CC) term indicated that significantly decreased ubiquitinated proteins were mainly located at the cellular membrane.
If a protein was only modified with a single unique ubiquitinated site that was significantly regulated, the single ratio represented the modified protein. For multiple ubiquitination modification sites per protein, we calculated a "protein level” diglycine remnant ratio, defined as the average ratio for each unique di-glycine site that was significantly changed. According to this, we divided the significantly changed ubiquitinated proteins into three clusters according to their relative expression based on Euclidean distance (Fig. 5(a) and Table S3 in Appendix A). Cluster 1 contained 138 di-glycine proteins, which were instantly upregulated from 6 to 48 h. GO-CC term analysis indicated that the ubiquitinated proteins from cluster 1 were mainly located at the cytosolic ribosome, peroxisome, and mitochondria, respectively. For GO-molecular function (MF) terms, cluster 2 was enriched in oxidoreductase activity, while cluster 3 was related to various transporter activities. KEGG pathway analysis of cluster 3 found that these proteins were enriched for the metabolism of xenobiotics by cytochrome P450 (CYP450) (Fig. S10 in Appendix A). CYP450, accounting for approximately 75% of endobiotic and xenobiotic metabolism, acted as a vital target for various E3 ligases, especially during oxidative stress (Fig. S10) [37,39]. In total, we quantified 81 ubiquitinated sites mapping to 23 CYP450s during dedifferentiation, of which 55 sites mapping to 19 CYP450s were changed, when compared to 0 h (Fig. S11 in Appendix A), and 16 (69.6%) of which were polyubiquitinated (Fig. S12 in Appendix A). CYP2e1 ranked first, with up to 10 changed ubiquitinated sites at K159, K194, K237, K243, K249, K275, K324, K420, K428, and K94 (Fig. S11). The Lys324 residue of CYP2e1 has been detected, but appreciable effects on protein turnover have been infrequently observed [40,41]; thus, the real function of this modification requires further study.
Next, we compared the expression level between ubiquitinated sites and corresponding protein abundance to search for the underlying regulatory mechanism. In total, 591 proteins were quantified in both our WCP and the ubiquitinome (Fig. S7(b)). With time, most of the proteins from 591 WPC remained unchanged within the threshold of FC > 1.5 (Fig. 5(b)). However, most of the ubiquitinated proteins from the 591 WCP were significantly upregulated or downregulated (Fig. 5(c)), suggesting that the real changes occurred on the abundance of the ubiquitinated sites instead of in the protein content. In addition, as no inverse relationship was observed between the ubiquitinome profile and the corresponding protein, we inferred that proteasome degradation might not be the main fate of ubiquitin modification, and that nondegradative ubiquitination might play an important role in dedifferentiation transformation. To validate our hypothesis, we analyzed the dynamic changes on the ubiquitin chain itself during this process. Except for K33, the other five typical ubiquitin chains, including K6, K11, K29, K48, and K63 were all quantified in our dataset. K27, which is mainly induced in the nondegradative pathway [42], was the only significantly upregulated one during dedifferentiation, which is consistent with our hypothesis (Fig. 5(d) and Fig. S13 in Appendix A).
《Fig. 5》

Fig. 5. Dynamics of the dedifferentiation-regulated ubiquitinome. (a) Time series clustering analysis of significantly regulated ubiquitinated proteins. (b) Number of significantly regulated proteins within 591 proteins. (c) Gap between regulated ubiquitinated proteins and corresponding protein abundance from the intersection of Fig. S7(b). (d) Significant increase of K27 during dedifferentiation. *, **, and *** represent P < 0.05, 0.01, and 0.001 versus 0 h, respectively; error bars represent mean ± standard deviation.
In conclusion, we assessed the comprehensive dynamic changes in the ubiquitination profile during dedifferentiation, and illustrated the predominant role of non-degradation for the first time.
《3.6. Generation of a large dedifferentiation-regulated quantitative phosphorylation repertoire》
3.6. Generation of a large dedifferentiation-regulated quantitative phosphorylation repertoire
Considering that the combination of phosphorylation and ubiquitination was a common determinant of functional outcomes, we further analyzed the dynamic changes in the phosphorylation profile during PHC dedifferentiation, based on an Fe-nitrilotriacetic acid (Fe-NTA) enrichment strategy [43,44].
In total, we identified 4932 phosphorylated sites, 4496 of which were quantified in at least two replicates with high confidence (localization probability > 0.9), which mapped to 2295 phosphoproteins (Fig. S14(a) in Appendix A). Compared with the WCP data, 705 (30.7%) proteins were also quantified in our phosphoproteomics analysis, and 1590 proteins with low abundance were only detected after the phosphate group enrichment strategy (Fig. S14(b)). Furthermore, we observed that mono-phosphorylation was the main modification type (over 50%) (Fig. S14(c)). The Pearson correlation coefficients of the phosphorylated peptides were over 0.5 among four replicates at each indicated time point after super-SILAC correction, indicating an acceptable reproducibility (Fig. S14(d)). The largest number of phosphorylated sites per protein was 40 from the Ser/Arg repetitive matrix 2, while none were significantly regulated at the indicated time points during PHC dedifferentiation (Table S4 in Appendix A). We observed that most phosphorylated sites (4319 or 87.57%) were on Ser residues, while phosphorylation of Thr and Tyr sites only comprised 555 (11.25%) and 58 (1.18%), respectively (Fig. S14(e)). Except for Tyr phosphorylation, we observed highly enriched motifs around the quantified phosphorylation residues, including those for Ser (xxSPxx), and Thy (xxTPxx) (Fig. S14(f)). Compared with those at 0 h, 29 phosphorylated sites were significantly regulated at 6 h and increased to 31, 45, and 58 sites at 12, 24 and 48 h, respectively (Fig. S14(g) and Table S5 in Appendix A), suggesting an increasing unstable phosphorylation state during hepatocyte dedifferentiation.
Out of all of the significantly different phosphorylated sites, only S422 of myelin expression factor 2 and T19 of myosin regulatory light chain (RLC)-A 1 were simultaneously identified among all the indicated time points, indicating that different time points had unique phosphorylation profiles (Fig. 6(a)). An interesting observation was that two proteins contained both upregulated and downregulated phosphorylation sites simultaneously, including the T2133 (up, log2FC = 1.00) and S2111 (down, log2FC = 1.02) sites of the spectrin beta chain at 24 h, and the T905 (up, log2FC = 0.76) and T958 (down, log2FC = 0.80) sites of tight junction protein 2 at 24 h (Fig. 6(b). After time series hierarchical clustering analysis was conducted on 99 significantly regulated phosphoproteins according to Euclidean distance, three distinct profiles were clustered based on their temporal behavior (Fig. 6 (c) and Table S6 in Appendix A). Sixty phosphoproteins from cluster 1 remained unchanged within the first 24 h, and then increased from 24 to 48 h, suggesting that they play vital roles in maintaining the dedifferentiated state in the later period. Many phosphoproteins from this cluster were located at the cytoskeleton according to the GO-CC term, and were related to the tight junction and focal adhesion from the KEGG analysis (Fig. S15 in Appendix A). Expression abundance of the phosphoproteins from cluster 2 was unchanged in the first 12 h, decreased sharply in the subsequent 12 h, and then remained stable. GO-BP term enrichment analysis showed that the production of TGF-β2—a well-known factor that promotes EMT—was enriched in this cluster [40] (Fig. 6(d)). In contrast, the phosphoproteins in cluster 3 increased rapidly in the first 24 h and were mainly located in mitochondria, according to GO-CC analysis (Fig. S15). Wanet et al. [45] have consistently documented the indispensable role of mitochondrial remodeling in the human hepatic dedifferentiation process. KEGG analysis revealed that many metabolic pathways, including fatty acid biosynthesis, nitrogen metabolism, and Arg biosynthesis, were enriched in cluster 3 (Fig. S15). Ferroptosis, a newly discovered type of cell death, was also enriched in cluster 3 and will be discussed later (Fig. S15).
《Fig. 6》
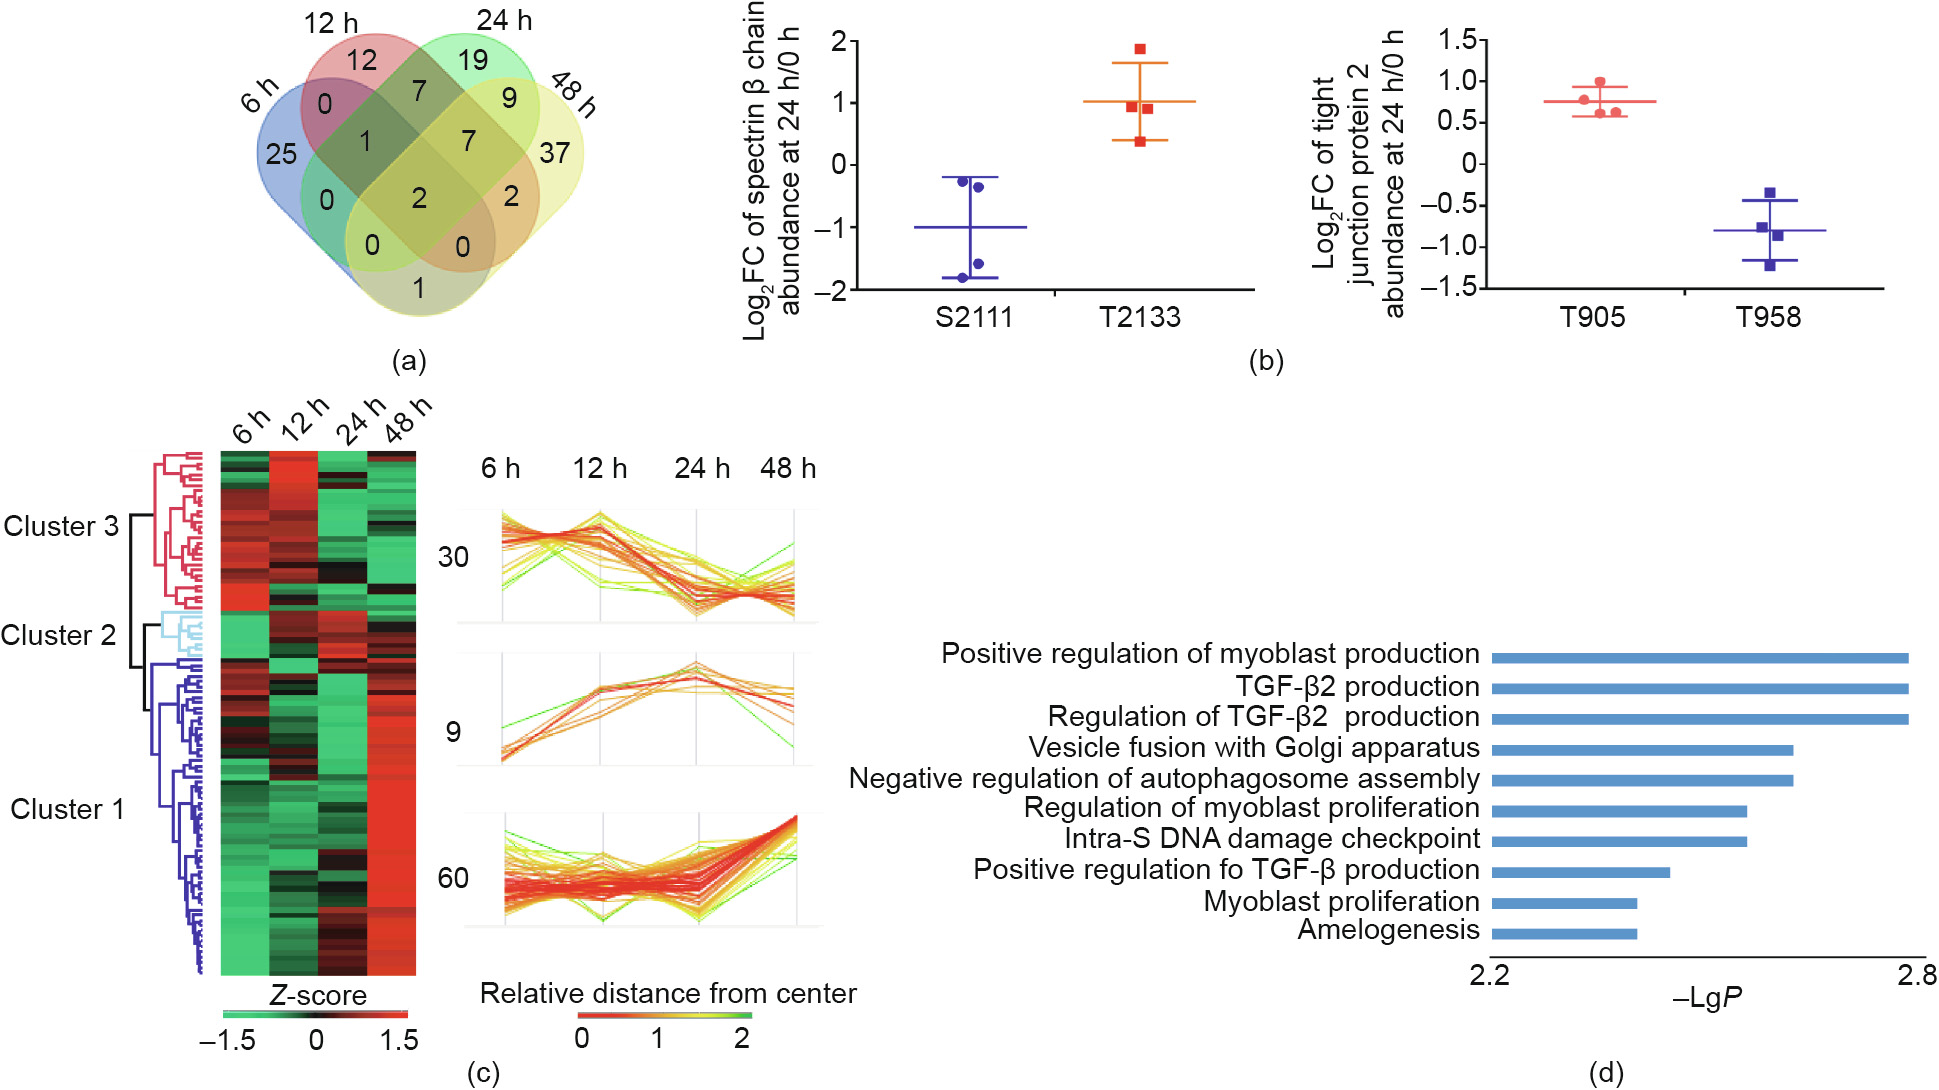
Fig. 6. Dynamic profile of the phosphoproteome during PHC dedifferentiation. (a) Venn diagram showing the overlap of significantly regulated phosphorylated sites at each indicated time point. (b) Two unique proteins with simultaneously upregulated and downregulated phosphorylated sites. (c) Time series clustering analysis of significantly regulated phosphorylated peptides. (d) GO-BP analysis of significantly regulated phosphoproteins from cluster 2.
《3.7. Coregulation of ubiquitination and phosphorylation during hepatocyte dedifferentiation》
3.7. Coregulation of ubiquitination and phosphorylation during hepatocyte dedifferentiation
In total, we quantified 404 proteins with both ubiquitination and phosphorylation, and found that 71% of them were either multi-ubiquitylated or multi-phosphorylated (Figs. 7(a) and (b)). Proteins with obviously simultaneously changed ubiquitinated and phosphorylated sites were defined as coregulation proteins (FC > 1.5). In addition, 32 coregulated proteins were identified among all the time points (Fig. 7(c)). To reveal the key proteins from the 32 candidates during dedifferentiation, we conducted PPI network analysis and then explored the intersection of the hub proteins through five distinct ranking methods in cytoHybba [33,46] (Table 1). Finally, four hub genes, including Ptbp1, Hnrpd, Hnrnpu, and Srrm2, were identified (Fig. 7(d)). Intriguingly, their protein levels were unchangeable, but their ubiquitinated sites were significantly upregulated, combined with increasing phosphorylated sites, suggesting that PTMs play more important roles than protein content (Figs. 7(e) and (f) and Fig. S16 in Appendix A). Consistent with our study, Hnrpd has been involved in hepatocyte dedifferentiation in UniProt.
《Fig. 7》

Fig. 7. Coregulated proteins during PHC dedifferentiation. (a) Venn diagram showing the overlap between the ubiquitinome and phosphoproteome. (b) Number of proteins with mono- or multi-ubiquitinated and/or phosphorylated sites (ub: ubiquitinated; ph: phosphorylated). (c) Venn diagram showing the overlap of proteins with simultaneous ubiquitination and phosphorylation at each indicated time point. (d) Overlap of hub genes from five distinct ranking methods during PHC dedifferentiation. (e) Regulation of the ubiquitinated sites, phosphorylated sites, and protein level from coregulated Hnrnpu. (f) Regulation of the ubiquitinated sites, phosphorylated sites, and protein level from coregulated Hnrpd. *, **, ***, and **** represent P < 0.05, 0.01, 0.001, and 0.0001 versus 0 h, respectively; error bars represent mean ± standard deviation. MCC: maximal clique centrality; EPC: edge percolated component.
《Table 1》
Table 1 Hub proteins identified from coregulated proteins.
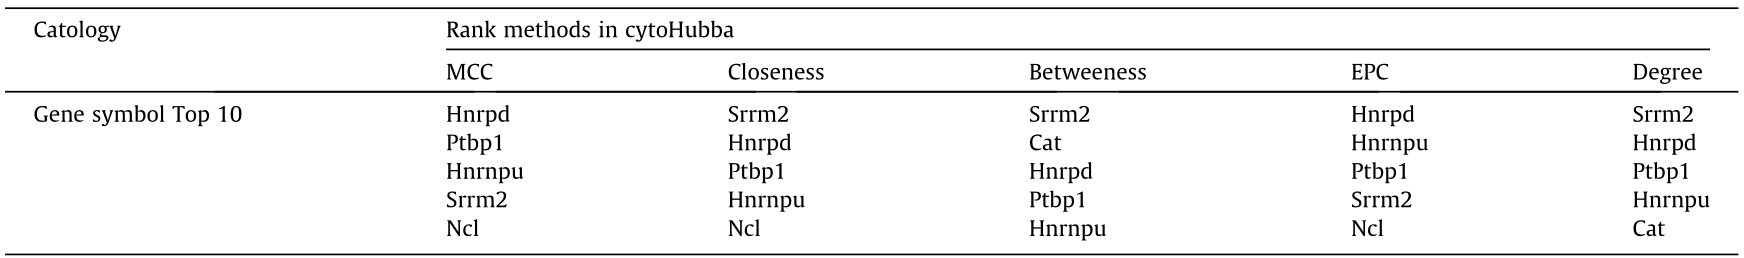
MCC: maximal clique centrality; EPC: edge percolated component;
Degree: node connect degree. Closeness and Betweeness are topological algorithms based on shortest paths.
《4. Discussion and conclusions》
4. Discussion and conclusions
A number of studies have conducted transcriptome and WCP analyses during the dedifferentiation process of hepatocytes from human or other animals, but only a few studies have focused on PTMs, with the exception of the glycosylated proteome [2,4,10,37,47]. These studies provide valuable insights into the underlying mechanisms of hepatocyte dedifferentiation. In this study, we extended the existing understanding of hepatocyte dedifferentiation through a multilayer omics strategy including the transcriptome, WCP, ubiquitinome, and phosphoproteome. It should be noted that, although the direct application of human primary hepatocytes seemed much more valuable for this research, especially because of the lack of a ubiquitinome dataset from humans during hepatocyte dedifferentiation to date, there is more than one reason to use rat hepatocytes instead of human hepatocytes: ① There must be enough protein (at least 10 mg) to meet the minimum for MS detection, because normally only an extremely low abundance of ubiquitinated sites is distributed in cells. ② In order to improve the detection of ubiquitinated peptides, MG132, an inhibitor of the proteasome, is widely used to improve the level of about 50% of the proteasomal degradative ubiquitylated sites [48,49]. However, MG132 has negative effects on protein translation by affecting pathways related to cell cycle and cell stress [50,51]; thus, it destroys the original state of the cells and likely provides results that diverge from the actual state. Ultimately, we decided to collect hepatocytes cultured in a medium that was free of MG132 to avoid this possible disturbance, which increased the difficulty of detecting ubiquitinated sites. ③ The spontaneous apoptosis and non-proliferative properties of PHCs in vitro made it rather difficult to meet the requirement of enough protein [8]. Given these factors, it was almost impossible to obtain enough PHCs from human donors to analyze the ubiquitinome; thus, PHCs from rats were a better choice.
Considering the low stoichiometry of ubiquitination in cells, we took advantage of the cumulative effect of TMT labeling. To accurately quantify modified proteins (sites) with lower super-SILAC abundance, we successfully reduced the ratio of super-SILAC to samples from 1:1 to 1:10, and corrected the protein (site) abundance from the whole level [52,53]. In general, our study provides the first global view of dynamic ubiquitination and phosphorylation during hepatocyte dedifferentiation. Through parallel quantification of protein abundance and mRNA, we revealed the poor correlation between them. The same phenomenon has been observed in many other studies, such as during CD4+ T cell activation and forebrain synapses organization, suggesting that the disjunction between mRNA and protein expression is a common phenomenon and that PTMs may play important roles in biological processes [54–56]. As the final executors of biological function, proteins and their modifications should be thoroughly investigated. It should be noted that, without interfering with proteasomal inhibition, our ubiquitinome dataset might only represent the most abundant ubiquitinated sites and might neglect those with a very low abundance. Another problem is that we were unable to identify the specific type of conjugated ubiquitin chain with corresponding ubiquitinated substrates, as they were separated by enzyme digestion. It still remains to be explored how to maintain the integrity of covalent links between ubiquitin chains and substrates with good enrichment efficiency. After integrating the ubiquitinome with the WCP, we found an increase in nondegradative ubiquitination of K27 during dedifferentiation. It should be noted that di-glycine remnants also result from ubiquitin-like proteins, including NEDD8 and ISG15 [57], and the contribution of NEDDylated or ISGylated remnants in our ubiquitinated proteomics still requires assessment.
After GO analysis of the phosphoproteome, ferroptosis was found to participate in dedifferentiation. To verify the involvement of ferroptosis during dedifferentiation, the accumulation of reactive oxygen species (ROS), an intact cell membrane devoid of blebbing, a normal-sized nucleus free of chromatin condensation, and dense miniature mitochondria with vestigial cristae specific morphological characteristics should be tested further [58,59]. Thus, ferroptosis might be the next potential target to inhibit dedifferentiation.
Crosstalk between PTMs adds specificity and complexity to signal processing, and still requires a large-scale study. At present, there are three main types of PTM crosstalk:
(1) More than two PTMs occur on a single peptide, which is difficult to detect because of the relatively short amino acid sequences after digestion [25].
(2) Two or more PTMs subsequently or simultaneously occur on one protein after perturbation or during the course of a timedependent process. However, the real sequential order of PTMs and how they coordinate with each other remains unclear [25].
(3) Modifications occur on different proteins that are close in space rather than in sequence.
In our dataset, we did not detect any proteins that aligned with type (1). Type (3) proteins can be analyzed with the help of correlated evolution [60].
In general, these valuable datasets shed light on the dynamic ubiquitylation and phosphorylation landscape of hepatocyte dedifferentiation. Our work provides a vital stepping stone for further research to explore potential targets in order to better maintain hepatic function in vitro.
《Acknowledgements》
Acknowledgements
This work was supported by the National Key Research and Development Program of China (2016YFC1101304/3); the National Natural Science Foundation of China (81400589, 81790630, and 81790633); and Research Unit of Infectious Diseases and Microecology, Chinese Academy of Medical Sciences (2019RU021).
《Compliance with ethics guidelines》
Compliance with ethics guidelines
Zhengyi Jiang, Zeyu Sun, Xiaoxi Ouyang, Yalei Zhao, Menghao Zhou, Baohong Wang, Qirui Li, Linxiao Fan, Sainan Zhang, and Lanjuan Li declare that they have no conflicts of interest or financial conflicts to disclose.
《Appendix A. Supplementary data》
Appendix A. Supplementary data
Supplementary data to this article can be found online at https://doi.org/10.1016/j.eng.2020.02.011.


 京公网安备 11010502051620号


