

《1. Introduction》
1. Introduction
River floodplains have attracted increasing attention in recent years. This interest reflects the ecological significance of floodplains and river corridors in the landscape, their importance as a buffer between rivers and the surrounding land, and their role in providing storage capacity for flood control. There is also growing awareness of the importance of their potential to absorb river sediments and the associated nutrients and contaminants. Due to its dynamic nature, sediment stored in river floodplains can be reworked in the future and may pose a problem for future river management [1]. Given this background, there is a clear need for an increased understanding of the evolution of flood geomorphology and its role in sediment dynamics.
Many artificial lakes have been created in Republic of Korea in recent decades due to the construction of dams. One such lake is Soyang Lake, which was created in 1973 behind the Soyang River Dam. Soyang Lake (Fig. 1) is the largest lake in Republic of Korea, bordering Chuncheon, Yanggu, and Inje in Gangwon Province. Its basin area is 2703 km2 and the total reservoir size is 2.9 × 10⁹ t, making it an inland sea. Soyang Lake is widely used as an environmental resource for hydropower, flood control, and water supply. The lake drains to the Han River and North River, and is used as the main water source for metropolitan areas, including Seoul. Soyang Dam has a flood control capacity of 5 × 10⁶ m3 , which has prevented flood damage in the metropolitan area and helped drive its economic growth. However, the Soyang Lake reservoir may have adverse effects on metropolitan areas located downstream. The cumulative rainfall in 2015 was 780.4 mm, which is 62% of the normal value of 1241.5 mm. As a result, the reservoirs of national multipurpose dams, including those along the Han River system, have been drastically reduced, and maintaining water supplies to metropolitan areas has been difficult. Shin et al. [2] studied the severity of drought in the Soyang watershed using vegetation information obtained from Terra moderate resolution imaging spectroradiometer (MODIS) satellite images captured from 2010 to 2015 in order to effectively manage water in Soyang Lake and prepare for drought damage. Lee et al. [3] used Landsat satellite imagery to explore changes in the surface area of Soyang Lake.
《Fig. 1》

Fig. 1. (a) The location of the study area on a satellite image; (b) a digital aerial photograph taken using drone imaging techniques with global positioning system (GPS) plotting sampling points.
Remote-sensing techniques, which can acquire data in a periodic manner, provide a cost-effective means to monitor seasonal changes and hydrological patterns of floodplains on a large scale. Landsat and MODIS time-series images have been used to map land cover and monitor the temporal variation of inundation areas for large lakes and wetlands [4–6]. However, satellite data have low resolution, and thus cannot be used for research in small areas. For this reason, remote-sensing approaches using unmanned aerial vehicles (UAVs) have been employed in various research and operational fields. Thanks to the miniaturization of sensors and onboard electronics for data logging and control systems, an increasing variety of sensors (e.g., optical cameras, light imaging, detection, and ranging (LIDAR), and hyperspectral cameras) can be operated from UAVs, allowing full utilization of the electromagnetic spectrum for remote-sensing purposes [7]. Photogrammetric surveys conducted using UAVs are useful for environmental monitoring in mountains [8], agricultural areas [9], rivers, and coastal areas [10]. Drones can provide surveys at a higher temporal frequency than air photogrammetry or LIDAR air topography systems. Because they are not subject to the same rules as other aircraft, drones can fly at low altitudes, which is essential for improving the resolution and accuracy of data.
In addition to monitoring by means of remote-sensing techniques, field data is necessary for sample analysis. The samples collected in the present research were analyzed to determine the grain fineness number and moisture content, which were measured vertically and horizontally to facilitate the prediction of breach movement. Previous research has analyzed breach movement affecting discharge, which in turn affects water quality, and has used this information to determine the best approach to conservation [11–14]. In this study, we aimed to survey sedimentation using field measurement data supported by data from sediment fineness analysis and moisture content analysis. The sampling point was marked using global positioning system (GPS), and the imagery of this location was captured using drone. From the drone images, we obtained digital elevation model (DEM) data. Field measurements combined with GPS and DEM data will allow more accurate analysis and monitoring of the sedimentation rate in the Soyang River.
《2. Material and methods》
2. Material and methods
《2.1. GPS and field data measurement》
2.1. GPS and field data measurement
The GPS is a radio navigation system that tracks time and position, with a wide range of applications in environmental studies, natural resource management, geographic information systems (GISs) data collection, geodetic global surveys, and other measurements. GPS works by tracking electromagnetic waves sent continuously to the world from satellites, from which the system can determine the position of the antenna (longitude, latitude, and altitude, or X, Y, and Z coordinates). Ref. [15] is recommended as a brief and clear introduction to GPS.
The data used in this study were taken from field surveys. We collected aerial photographs using drone in field surveys to obtain more accurate data. The drone took pictures using a photographic scanner produced by Agisoft Photoscan (Agisoft LLC, Russia). A DEM can be created from three-dimensional (3D) image data obtained from a drone that has been processed to determine sediment height. According to Sona et al. [16], the Agisoft Photoscan is more reliable than other software of the same type. This software operates on Windows systems to build professional 3D content from still images such as JPEG, TIFF, or PNG [17]. Agisoft Photoscan is widely used to produce digital surface models (DSMs) [18] and has been applied in both terrestrial and aerial photogrammetry [19].
It takes four steps to generate a DEM: First, collect aerial photos using an UAV. Second, process the images using Agisoft Photoscan software, which has three levels of accuracy and quality to be set. The levels of accuracy were the built-in parameters that automatically generated by the software. Third, analyze the DEM data to determine the most suitable accuracy for the DEM [20–23]. Fourth, the 3D image is extracted and the GPS data are substituted at the positions where they were taken. We compared corrected and non-corrected GPS data with image data taken using a drone to determine the locations of the five sampling points (Fig. 1(b)).
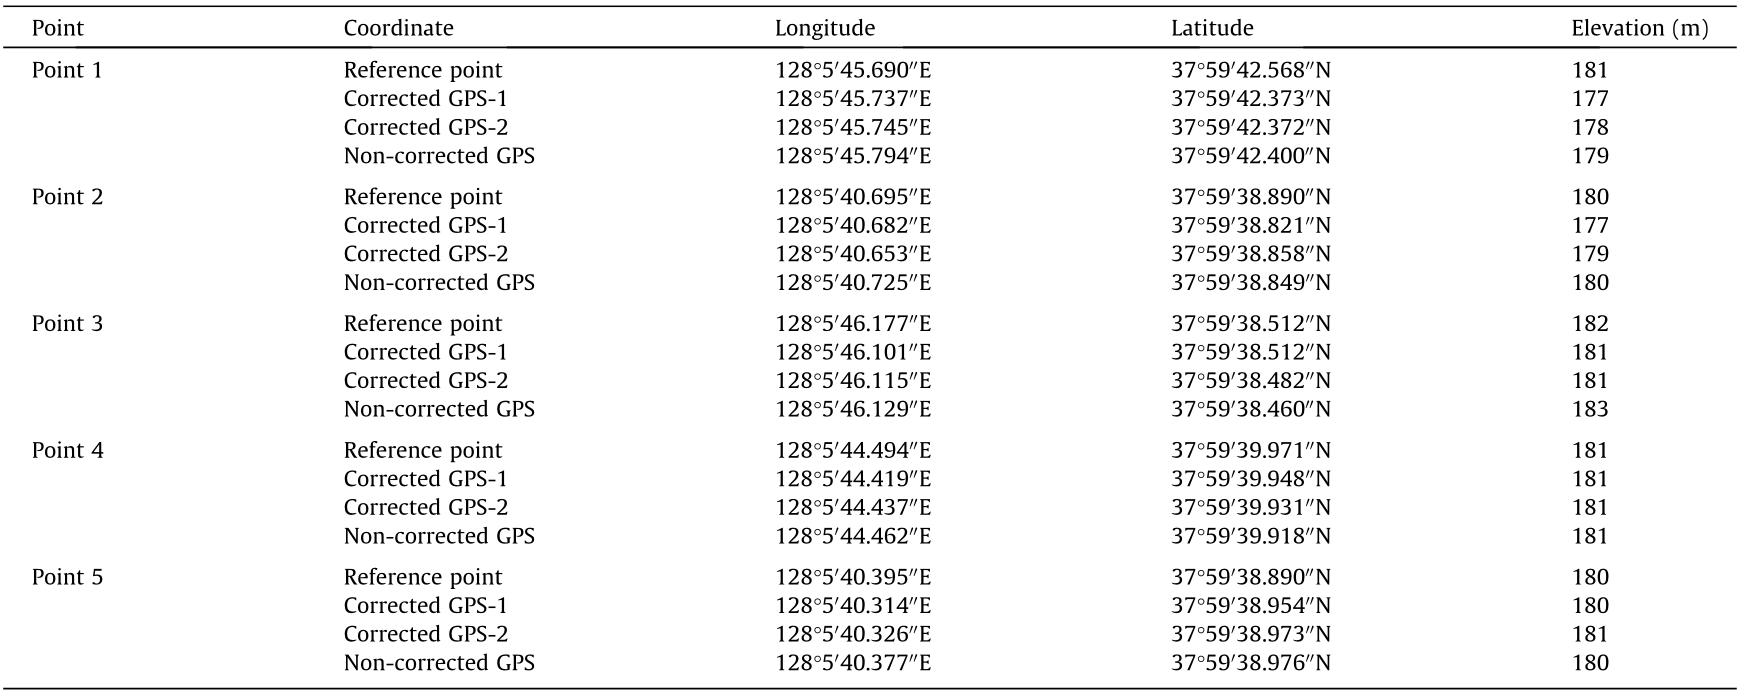
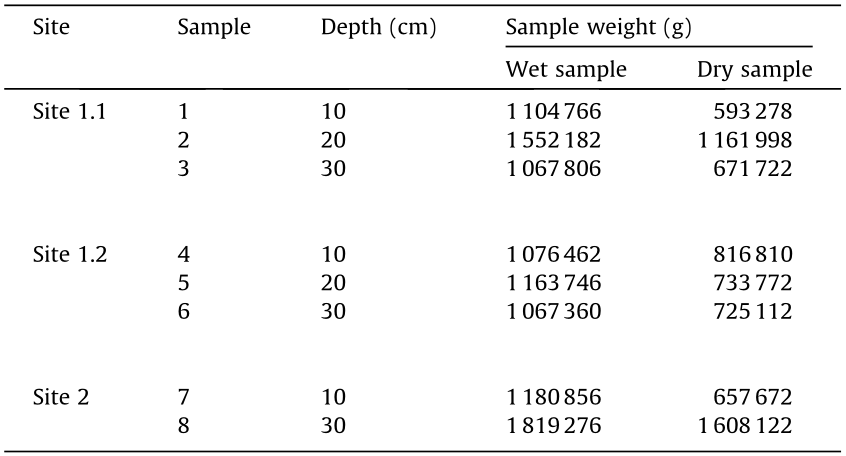
Data were collected on 22 August 2018 near the south side of Inje, at five initial sampling points around Soyang Lake. From these locations, two sampling points were chosen (Point 1 on the east side and Point 2 on the west side), and three sampling sites were selected at these two points: Site 1.1 and Site 1.2 at Point 1, and Site 2 at Point 2. Sediment samples were collected from those sites. At each site, the soil was dug to a depth of about 40 cm; sediments were sampled at depths of 10 cm (upper), 20 cm (middle), and 30 cm (bottom) from the floodplain of the Soyang River (Fig. 2). Eight samples were collected in total, with three samples of each sites at Point 1, and two samples at Point 2 Site 2. Other points (Point 3–5) were still be used as the observation point for GPS procedure. The sampling points were plotted using three GPS handheld units and a GPS drone. Two of the GPS units were corrected with reference points, and the other unit was not corrected. We compared the sampling coordinates collected using the three GPS units with those collected using the GPS drone to improve accuracy (Table 1). The sample data were wet weights including moisture and dry weights after water removal (Table 2).
《Fig. 2》

Fig. 2. Sediment sampling in the Soyang Lake floodplain at three sampling sites: (a) Site 1.1; (b) Site 1.2; (c) Site 2.
《Table 1》
Table 1 GPS point data of the Soyang Lake floodplain.
《Table 2》
Table 2 Sample weight measurements of the sediment in the Soyang Lake floodplain.
《2.2. Grain fineness number》
2.2. Grain fineness number
Grain fineness number (i.e., particle diameter) is widely used in sediment studies. A standard reference scale is needed to distinguish particles of different sizes, because the size of sediment particles varies greatly. For example, Udden [24] sets the reference value at 1 mm. A particle size of double the reference value is one unit larger in this scale, whereas a particle size of half the reference value is one unit smaller. A size difference of 1 mm is important for particles the size of sand, but for gravel and larger particles it is less important, because it can be considered to fall within the range of measurement error. Krumbein [25] notes that it is easier to express millimeter particle sizes on a logarithmic scale to overcome this problem. Thus, the standard particle size parameter that is widely used today was first reported by Udden [24] and is defined as phi (Φ). Wentworth [26] also developed a scheme, which is used as a standard classification scale. The classification of sediment particle size in this study refers to particle size according to the Udden–Wentworth scale, with particle sizes in millimeter and Φ, and provides the descriptive name of each class of particle size in each section [27].
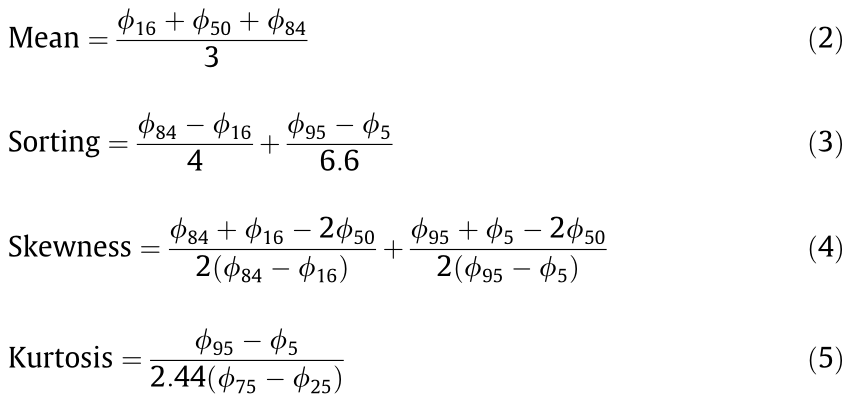
In this study, the particle sizes of dried sand samples were analyzed using sieve analysis with a standard sieve set. The sizes of the particles on the Φ scale were determined as shown in Eq. (1).

where d represents the diameter of the particle in mm, and d0 is the reference diameter, with a value of 1 mm.
Particle diameter can be determined using a filter or by direct measurement from thin sections. The sediment particle size distribution was analyzed using numerical values to describe the distributions or shapes, such as cumulative frequency curves, classification, slope, kurtosis, mean, mode, and median values. Statistical analysis can be performed using the moment method by converting the particle size data to the Φ standard. Graphs based on data using Φ standards are more commonly used than moment calculations, due to uncertainty of the largest and smallest particle sizes. In this study, particle size analysis was carried out as described in Eqs. (2)–(5), applying the method proposed by Folk and Ward [28]. For example, Φ16, Φ50, and Φ84 represent cumulative weight percent values (16%, 50%, and 84%), which are used to calculate grain size.
Sediments were collected to a depth of 40 cm from the east and west sides of the floodplain, and sediment was sampled at depths of 10 cm (upper), 20 cm (middle), and 30 cm (bottom) from the floodplain of the Soyang River (Table 3). The vertical distribution of the data was calculated by analyzing particle size relative to the amount of sand collected (Fig. 3). The samples were classified into size classes of 4, 2, 1, 0.5, 0.25, 0.125, and 0.0625 mm using analytical sieves.
《Table 3》
Table 3 Grain size percentages for each sample taken from Site 1.1, Site 1.2, and Site 2.

《Fig. 3》
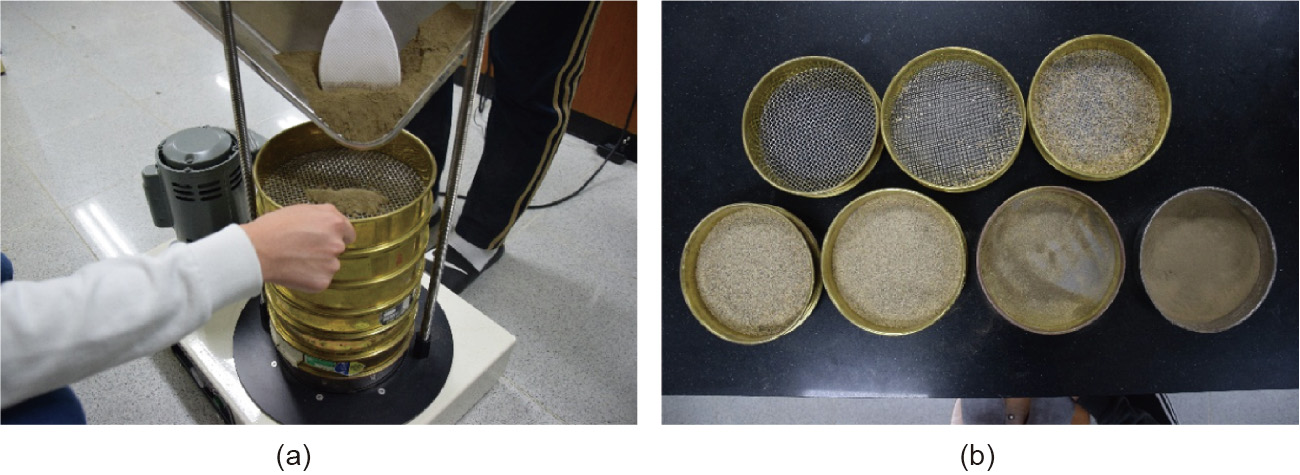
Fig. 3. Grain fineness number analysis of sediment samples. (a) Sieve analysis process; (b) filtered sediment sample.
《2.3. Moisture content》
2.3. Moisture content
Accurate and reproducible measurement of moisture content is essential for minimizing possible systematic errors in the quantitative determination of a measured analyte. Therefore, measuring moisture content with small uncertainty is of the utmost importance, especially for sample measurement. The moisture content of a sample must be accurately known in order to determine the quality of the sample.
We analyzed the sediment moisture content of each sample. The method was based on removing soil moisture by oven drying a soil sample until the weight became constant. The moisture content (%) was calculated from the sample weight before and after drying. A uniform quantity of each wet sand sample was weighed. The sample was then dried for 24 h, after which each sample was weighed again. The weight of each sand sample before and after drying was compared to determine the mass ratio. We used the weight difference before and after drying as a reference to calculate the moisture content of each sample. Fig. 4 illustrates the water content analysis conducted in this study.
《3. Results》
3. Results
《3.1. GPS and aerial photograph analysis》
3.1. GPS and aerial photograph analysis
GPS systems have become a valuable complement or extension of conventional survey tools such as theodolites, tapes, bars, electromagnetic distance measurement, and stations. The GPS procedure is based on measuring the coordinates, distance, or angle to a series of targets from fixed locations used as reference points. The difference between the measured value and the initial coordinates provides information about the movement of the target or object. The spatial distributions of the observation points used for the Soyang Lake floodplain surveys are shown in Fig. 1(b) and summarized in Table 1.
GPS data can be used to monitor the coordinates of a sediment sampling site. A total of five coordinate observation points on the Soyang Lake floodplain were measured using three GPS units. Of these, two units were corrected and one was a non-corrected GPS. Sediment sampling was conducted at Point 1 and Point 2, whereas Points 3–5 were measured as a comparison to determine the accuracy of the three GPS devices. Fig. 5 shows a zoomed-in view of aerial photograph (drone image) data to show a comparison of the accuracy of the three GPS devices at these reference points. The difference in the distances between the three GPS devices and each reference point is shown in Table 4. The error tolerance of the three GPS devices was 3 m. Therefore, when the coordinate measurement results of the data from the three GPS units had values below 3 m, the three GPS units were obtaining accurate data. There were no significant differences between the non-corrected and corrected GPS data; thus, it can be concluded that the non-corrected GPS unit performed as well as the corrected GPS units. From the results of the GPS coordinate measurement, the three GPS datasets showed poor accuracy at point 4, which may have been due to an error in measuring the reference point.
《Fig. 4》

Fig. 4. Sediment samples for analyzing moisture content. (a) Wet samples; (b) dry samples.
《Table 4》
Table 4 A comparison of the three GPS devices to reference points.
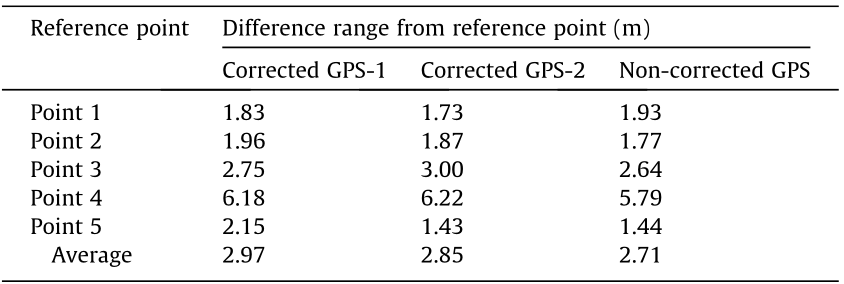
Fig. 5 also shows a DSM of the floodplain area of Soyang Lake. The DSM data recorded the sedimentation on the Soyang Lake floodplain, enabling the identification of the sediment distribution and sediment height. DSM data are obtained using digital aerial photography data that are corrected using GPS data. Based on the DSM data, sediments in the eastern portion of the Soyang Lake floodplain were higher and thicker than those in the western portion. This phenomenon may occur due to the direction of sedimentation flow toward the eastern region, which builds thicker sediment deposits there than in the western region. DSM data is very useful for monitoring the development and distribution of sedimentation in a study area.
《Fig. 5》

Fig. 5. A DSM of the Soyang Lake floodplain showing a comparison of the differences between the points collected using three GPS devices and reference points.
《3.2. Grain size analysis》
3.2. Grain size analysis
The sedimentary depositional environment of the study area was determined by analyzing data from three sampling sites, two of which were on the eastern side of the floodplain and one of which was on the western side. Three samples were collected at depths of 10, 20, and 30 cm at each location of the eastern sampling site (Site 1.1 and Site 1.2), and two samples were collected at depths of 10 and 30 cm at the western site (Site 2). All sediment samples were analyzed for grain fineness number, classification, skewness, and kurtosis.
Table 5 shows the results of the particle size analysis. Three sites were selected, and samples were collected according to the local environmental conditions of the study area. The results were analyzed by selecting locations where valid research data were available. The average particle size at each sampling location was calculated and classified according to the Udden–Wentworth scale. The average particle size at each site ranged from 1.33 to 2.44 mm, indicating that Soyang Lake floodplain sediments mainly consist of very coarse sand. In general, values below 0.35Φ (0.0 value) denote very good classification or sorting, and those above 4Φ (4.0 value) show extremely poor classification. Therefore, as most of the sites in the study area were in the range of 1Φ–2Φ (values of 0.95–1.27), the classification of the samples can be considered to be moderately to poorly sorted. The study sites showed differing amounts of skewness. Sediments from sampling sites on the east side (Site 1.1 and Site 1.2) were strongly negative skewed, while those from the west side (Site 2) were strongly positive skewed. The areas on the east side were biased toward fine grain sizes, whereas the area on the west side was biased toward a moderate grain size. Kurtosis was generally positive; therefore, the distribution was generally leptokurtic. Site 1.1 and Site 1.2 on the east side of the Soyang Lake floodplain and Site 2 on the west side were compared. A particle size of 0.125 mm dominated among the small particles in the eastern sites, whereas a 0.0625 mm particle size was dominant in the western site, indicating eastward movement of the breach.
《Table 5》
Table 5 Analysis of parameters at the three sampling sites.
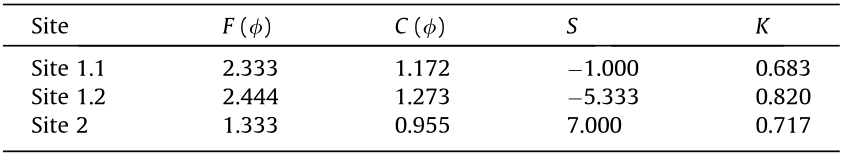
F : average fineness number; C: classification or sorting; S: skewness; K: Kurtosis.
《3.3. Moisture content analysis》
3.3. Moisture content analysis
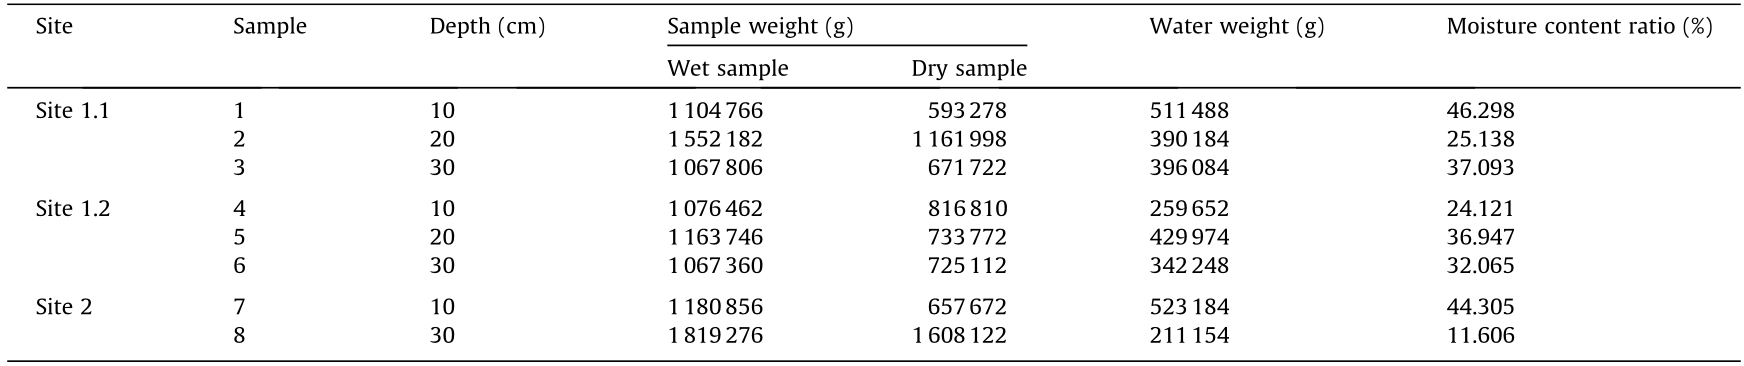
Samples collected from three sites on the two sides of the floodplain were analyzed to assess the moisture content ratio vertically. Table 6 shows the average moisture content ratios in a depth profile. The average moisture content ratio was highest in sediments taken at 10 cm, which indicates that the sediment at a depth of 10 cm has relatively poor porosity. In addition, we compared the moisture content of the western and eastern sides. Higher moisture contents on either side of the breach indicate the influx of water, meaning that a breach is likely to occur. Thus, a relatively high moisture content ratio indicated that a breach will likely occur on the east side.
《Table 6》
Table 6 Analysis of moisture content ratios in the depth profiles for each sample.
《4. Discussion and conclusion》
4. Discussion and conclusion
The purpose of this study was to survey sediment deposits in the floodplain of Soyang Lake to analyze the quality of Soyang River water after the construction of the Soyang Dam. The grain smoothness, water content, sediment size, and sedimentation rates were analyzed in order to better understand the breach that occurred in the study area. A total of three sampling sites were chosen, with two sites in the east and one in the west. Three samples were collected from each site at 10 cm intervals to a depth of 30 cm in the eastern area, and two samples were collected at depths of 10 and 30 cm at the western site. The particle size in the Soyang Lake sediment samples ranged from a minimum of 1.33 mm to a maximum of 2.44 mm, representing coarse and very coarse sediments with a negative slope. Particle size analysis showed that the breach is moving eastward. High water content at the eastern sites show a high probability of breach compared with the western site, which had low water content.
The use of GPS data and digital aerial photography is a practical method for monitoring sedimentation in the Soyang Lake floodplain. GPS coordinate survey data and DSM data must be collected continuously so that the distribution of sediment, sedimentation rate, and development of sediments in the Soyang Lake floodplain can be analyzed.
The results of this study indicate that analyses of grain fineness, moisture content, sediment deposits, and sedimentation rates can be used to understand and predict the direction of sediment movement in Soyang Lake. However, because it is difficult to determine trends based on the results of a single study, ongoing research and data collection are needed, and the theoretical diversity and accuracy of the approaches employed in this study must be validated with additional research. Further research will improve the comparisons of obtained data, such as grain fineness, water content, sedimentation rate, and sedimentation direction, as well as GPS and DSM, for use as a sedimentation monitoring standard for the Soyang Lake floodplain.
《Acknowledgements》
Acknowledgements
This research was supported by a grant from the National Research Foundation of Korea provided by the government of Republic of Korea (2019R1A2C1085686).
《Compliance with ethics guidelines》
Compliance with ethics guidelines
Mutiara Syifa, Prima Riza Kadavi, Sung Jae Park, and ChangWook Lee declare that they have no conflict of interest or financial conflicts to disclose.


 京公网安备 11010502051620号


