

《1. Introduction》
1. Introduction
With rapid urbanization, an increasing number of metro systems are being constructed in Chinese cities [1–5]. Shield tunneling is an economic and effective way to construct metro tunnels under various geological conditions [6–9]. During work processes in mixed strata or rock conditions, disc cutters are pushed forward and pressed into the rock through thrust force (TF). Cracks appear and spread by increasing the pressure of the cutter penetration. The rocks are then chipped into different parts due to crack coalescence between contiguous cutters, which crushes the rocks. The complicated interaction between the disc cutter and the rock– soil environment causes serious wear of the disc cutter, which is difficult to predict [10,11]. In some tunneling projects, disc cutter consumption and replacement constitute approximately onethird of the project costs and consumption time [12]. To estimate the excavation costs of a mechanized tunneling process, correct estimation of the cutter life is essential [13,14].
Disc cutter consumption depends largely on the ground conditions, shield construction parameters, and cutting conditions. Solving key problems, such as identifying the major causes for cutter consumption, analyzing the wear mechanism, and developing techniques to increase cutter life, help to reduce construction cost and improve excavation efficiency. Previous researchers have studied the influence of ground conditions on cutter consumption through experimental studies on prediction processes [15–19] and empirical or theoretical analyses [20–22]. For example, Hassanpour [23] proposed a relationship between disc cutter life and geological parameters based on statistical analysis and an empirical equation. Ren et al. [14] proposed a wear-prediction model for heterogeneous ground based on the total energy consumption theory. Yang et al. [24] analyzed the failure and consumption of a disc cutter on a water conveyance tunnel section based on data from a Lanzhou construction project in China. Because many parameters affect cutter life, the predicted results from empirical models do not match well with the measured results. Thus, it is necessary to develop models that allow more accurate predictions of cutter life in heterogeneous ground.
Recently, soft-computing artificial intelligence (AI) techniques such as regression, optimization, and group method of data handling (GMDH)-type neural networks (NNs) have been successfully used in a wide range of geotechnical fields [25–28]. GMDH is a selforganizing technique that can be used to solve complex problems in nonlinear systems with large degrees of complexity. The main advantage of this technique is that the analytical equations can be estimated via quadratic polynomials. In addition, the GMDH approach undoubtedly provides a favorable tool that can professionally overcome short and noisy data [29,30]. However, artificial models such as GMDH are usually trapped in the local minimum and are therefore unable to find the global minimum. Therefore, prevailing optimization algorithms are necessary to avoid such drawbacks. The genetic algorithm (GA) is an evolutionary method inspired by Darwin’s theory, which can enhance the generalization performance of artificial models [31–33].
The objective of the present study is to provide a reliable prediction model for disc cutter life by using AI technology with the input data of geological and operational parameters. The proposed hybrid model is first applied to estimate disc cutter life. Thus, the proposed model is established to address the gap between nonlinear systems and machine learning techniques. Empirical analyses were developed in detail for predicting disc cutter life using statistical regression systems (linear and nonlinear). Then, a new mathematical model based on integrating GMDH-type NN with GA was developed to evaluate its ability as a more reasonable cutter life prediction model. The Guangzhou–Shenzhen intercity railway project in China is used as a case study to demonstrate the feasibility of the developed model and its application potential. A sensitivity analysis of the established approach was also conducted to determine the effect of each input parameter on the model output and to facilitate the evaluation procedure.
The present study is organized as follows. Section 2 displays the background of this study, which includes factors affecting the estimate of disc cutter life. Section 3 presents the basic GMDH-type NN and describes the model development. The project description, disc cutter consumption, and data preparation are introduced and analyzed in Section 4. Section 5 displays the results and discussion for predicting disc cutter life, and the last section concludes the paper.
《2. Background》
2. Background
The performance analysis and prediction of disc cutter life are essential in tunnel projects because the cost and schedule of the entire project are determined according to the tunneling performance. This is especially necessary in huge tunnel projects, since shield tunneling is a complex interaction between the soil– machine process, and is influenced by various parameters. Thus, it is important to study such parameters in order to avoid many unnecessary losses and a great deal of trouble in the construction process [34]. The effective parameters for disc cutter life should be considered as input variables for building an accurate model.
In general, geological conditions should be investigated in advance before tunnel excavation. The efficiency of the drilling system by shield cutters is related to the properties and types of soil. In a previously published paper [23], the uniaxial compressive strength (UCS), which refers to the strength characteristics of the rock material, was employed as the most representative input parameter for the geological conditions. The penetration rate (PR), which represents the ratio of the drilled distance to the operating time during a continuous excavation phase, was considered to be one of the key input parameters for the shield construction parameters [12,35,36]. In another study, Ren et al. [14] investigated the effect of TF on disc cutter life. TF, which represents the cutterhead load, is one of the main construction parameters affecting rock breaking and cutter wear conditions. The TF imposed on a cutter during tunneling is expressed as a function of the PR and rock material properties [37]. Since the forces influencing the cutter can be estimated from the operational parameters of the machine, penetration depends not only on the properties of the rock material, but also on the cutting conditions, which directly affect the disc cutter life [38–40]. The specific energy (SE) is the energy consumed to drill a unit volume of soil. Namli and Bilgin [41] have stated that the SE can be utilized to assess the cutting efficiency of a tunnel-boring machine. Furthermore, the cutter rotation speed reflects the rock-breaking status during the cutting, which is directly influenced by the working efficiency and therefore affects the cutting performance. Based on the aforementioned parameters, it is noticeable that disc cutter life is the output of an extremely complex system influenced by several geological and operational parameters. Furthermore, analyzing the shield cutting performance still principally depends on experience and on statistical and theoretical analyses. Thus, a systematic analysis method could provide comprehensive understanding of the performance of shield cutting according to shield monitoring data.
《3. Cutter life prediction via an AI approach》
3. Cutter life prediction via an AI approach
《3.1. GMDH-type neural network》
3.1. GMDH-type neural network
The GMDH-type NN is one of the best methods for solving AI problems such as identifying and predicting short-term and longterm expectations of random processes in complex construction problems. The GMDH-type NN is a layered structure; each layer contains independent neurons and the independent neurons are organized in pairs, with each pair being integrated via a quadratic polynomial. In all layers, new neurons are formed by crossing the independent variables from the previous layer. Consequently, new generations of neurons are generated. Anastasakis and Mort [42] presented a GMDH based on choosing the optimal quadratic polynomial formulas for modeling nonlinear models using a collection of input and output variables. For the input vector X = (x1, x2, x3, ..., xn), the predicted output  is expected to be close to the actual output (
 ). Hence, the presented M indications for multiple-input single-output data pairs are observed as follows [43]:

In order to predict the required output from the presented input vector  , the predicted output is displayed as follows:

The squared variance between the actual outputs and the estimated outputs is decreased to determine the GMDH:

GMDH provides a comprehensive map between the input and output parameters, which are expressed in a nonlinear function in the form of a Kolmogorov–Gabor function [44]:

where  is the coefficient of the quadratic polynomial and i, j, k
  (1, 2, ..., n).
The presented formula refers to the Kolmogorov–Gabor formula and can be represented via a second-degree polynomial form:

The GMDH-type NN is employed to estimate the coefficients  (i = 1, 2, ..., 5) in Eq. (5) by utilizing a regression analysis to minimize the variance between the actual and estimated output for every set of (xi , xj ) as input parameters [45,46]. Thus, to optimize the coefficients of every quadratic equation, the least-squares method is used, as presented below (E stands for error which is the quantity to be minimized):

To display the main form of the GMDH approach, the matrix form of Eq. (5) can be rewritten as follows:

where Y =  and
and  , which represents the coefficient of the quadratic polynomial vector; A is estimated for various p and q ( {1, 2, ..., n}):

The least-squares formula for the multiple regression analysis solves a normal equation:

The best coefficients vector of Eq. (5) is calculated for a triples set of M data. Although the GMDH model provides a favorable tool to overcome short and noisy data, it is usually trapped in the local minimum and is therefore unable to find the global minimum.
After computing partial descriptive coefficients, the selection criterion is adjusted according to the objective function (OF) to eliminate neurons that present inferior results. To conduct a selection step, the database is split into a training dataset and testing dataset. The OF of each output is calculated as follows:
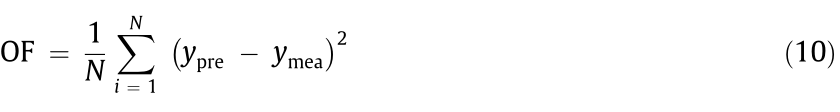
where ypre , ymea , and N are the predicted, measured, and total number of datasets, respectively.
The selection step is conducted based on the testing data, and the OF of each output is applied for the evaluation process. The GMDH training process involves adding layers, calculating partial characterization coefficients, and eliminating the neurons that introduce the worst results. During the training stage, the output of the recent layer is converted into the input of the next layer. This process discontinues in the case of an existing layer residue of one neuron after the selection stage, or in the case of a new layer being added whose training does not upgrade the performance of the overall network. The neuron that gains the best behavior is preserved in the preceding layer and the other neurons are eliminated. Finally, the trimming stage is performed to fulfil the eventual network structure. Fig. 1 [46] shows a graphical example of the GMDH training procedure. In this figure, the removed neurons are displayed in a light color [46]. Itemized mathematical information and further background related to the GMDH-type polynomial network can be found in Ref. [46].
《Fig. 1》
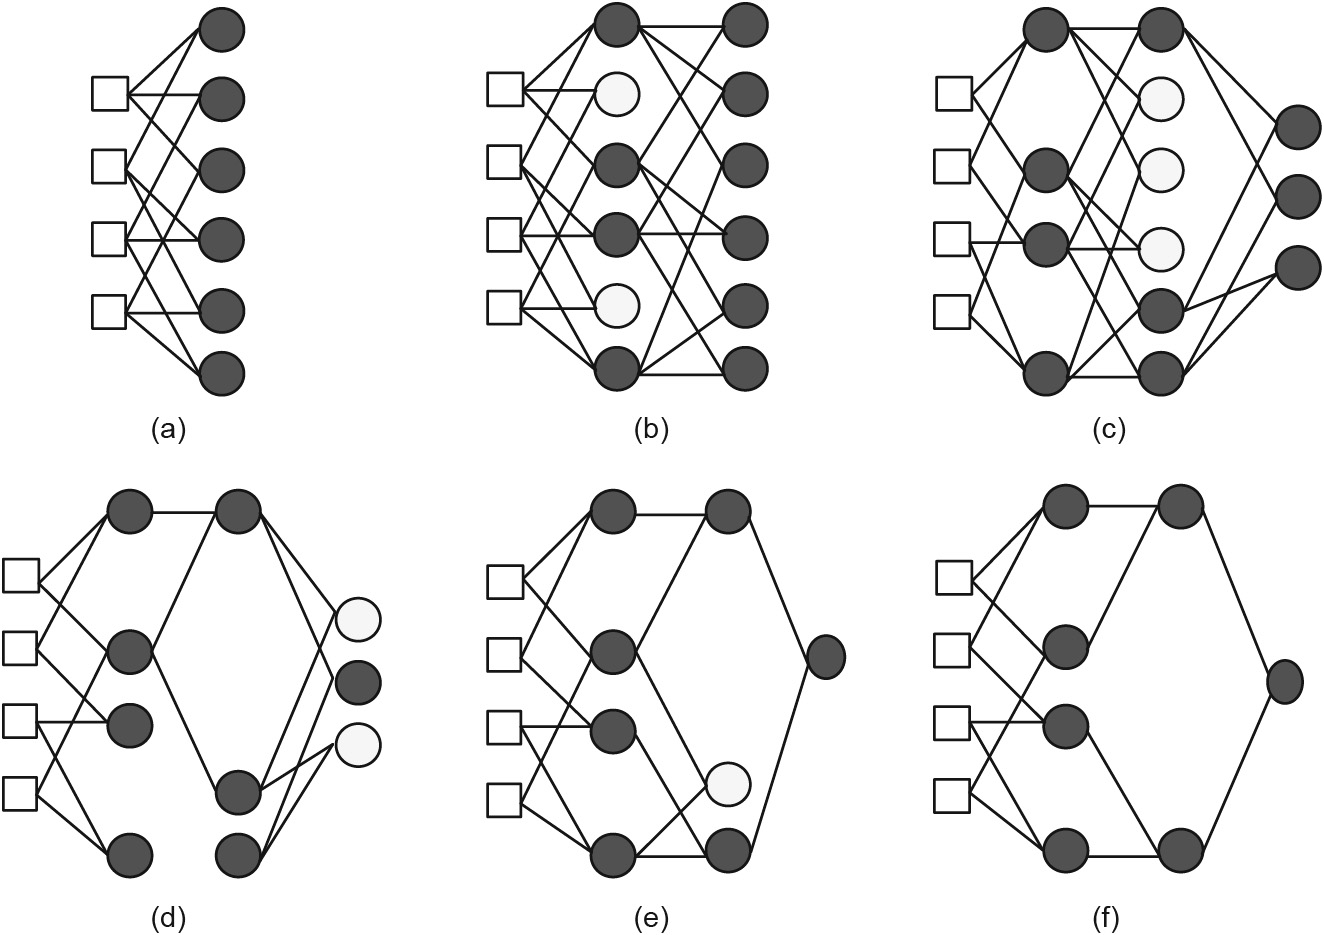
Fig. 1. Graphical example of the GMDH training process. (a) The network layer formed with four inputs; (b) after calculating the coefficients for all neurons, the eliminating neurons are showed in a light color; (c) the selected neurons on the new layer; (d) after selection process, the training stops when any layer remains with only one neuron; (e) and (f) all neurons that are not participating in the network are removed. Reproduced from Ref. [46] with permission of Elsevier Ltd., ©2012.
《3.2. Genetic algorithm》
3.2. Genetic algorithm
The GA, which was initially proposed by Holland [47] and then developed by Goldberg [48] to optimize complicated problems, is an adaptive heuristic search technique. This algorithm is established according to the basis of Darwin’s theory of evolution. Based on this concept, the lower adjusted types tend to vanish, whereas the fittest individuals survive and generate new offspring. Optimization methods like the GA are distinguished by simplicity, resilience, and self-adaptability. The GA repeatedly adjusts the population in generations for individual solutions. Individuals from the recent generation are haphazardly selected to be parents for producing children in the following generation, until the population promotes the best solution. For every generation, a new collection of approximations is formed according to the fitness grade. During each iteration, the GA is repeated until the required termination criterion, such as the predefined number of generations, is achieved. Further details of GAs are provided in the literature, such as Ref. [48]. Although a GA can be extensively applied in different stages of the design of NNs, it suffers from a low ability for local searches [28,49,50]. Therefore, it is necessary to propose a higher-accuracy model that reduces the OF by adjusting the design parameters while achieving the design procedures. A hybrid GMDH–GA model is proposed here to address the shortcomings of the abovementioned models and to create a synergetic effect in forecasting, which has become the dominant approach in recent years.
《3.3. GMDH-type NN design using a GA》
3.3. GMDH-type NN design using a GA
To predict disc cutter life with a higher accuracy, this study introduces a hybrid GMDH–GA model. In this hybrid model, the abovementioned GA is applied to optimize the whole structural of the GMDH-type NN (i.e., number of neurons for every hidden layer and its formation of correlations, in conjunction with individual value decomposition to detect the optimal set of adequate coefficients). A flowchart for integrating GMDH with the GA model to predict disc cutter life is shown in Fig. 2. The systematic procedures of the proposed model are as follows:
《Fig. 2》

Fig. 2. Flowchart of generalized structure for GMDH–GA model.
Step 1: The input parameters X = {x1, x2, ..., xn} and the corresponding output Y = {yn} are preprocessed to obtain a suitable dataset for training model.
Step 2: The used data in the hybrid GMDH–GA model are divided into training and testing sets. The training set is utilized to train neurons, whereas the testing set is utilized to assess how well the neurons predict the predestined data.
Step 3: The GA is initialized as the initial population and GA operators are generated to optimize the GMDH parameters.
Step 4: In the selection stage, the preferable two chromosomes, which refer to the best solutions, are recognized according to their fitness, and the chosen chromosomes are utilized as parents for creating children, chromosomes, and new generations.
Step 5: In the crossover stage, the chromosomes intersect haphazardly with the specific probability for producing children.
Step 6: Through mutation, the population diversity is adjusted and the search ability is enhanced to overcome the convergence in the local optima.
Step 7: Through iterative processing, the GA is applied until the specified condition is achieved. As there is no explicit method or formula for choosing the optimum GA parameters, this study estimates the GA parameters using a trial-and-error approach. In this way, trials of the hybrid model are conducted with a gradually increasing relative fitness function, until no further improvement is achieved.
《4. Case description》
4. Case description
《4.1. Project summary》
4.1. Project summary
The Guangzhou–Shenzhen intercity railway, which is located on the coast of the Pearl River Delta of Guangdong, China, includes tunnels of a total length of 22 km. The construction project connects Guangzhou North Station and Shenzhen Bao’an International Airport. The tunnel section is located in the zone of the airport’s Terminal 3, between Bao’an Airport North Station and Bao’an Airport Station. Fig. 3 depicts the location of the studied section. Its length is approximately 3.3 km. An earth pressure balance (EPB) shield machine is utilized to construct the tunnel. The cutterhead of the machine has diameter equal to 8.85 m and the diameter of trailing shield is 8.78 m. The segment ring has 1.6 m width and 0.4 m thickness. The precast concrete lining rings (six segments and a key piece) are erected within the shield body and have inner and outer diameters of 8.10 and 8.50 m, respectively. Several parameters such as the TF, cutter rotation speed (CRS), screw rate (SC), cutterhead torque (CT), grouting pressure (GP), PR, burial depth (H), soil pressure (SP), and SE were carefully monitored. Table 1 lists the specifications of the EPB shield machine.
《Fig. 3》

Fig. 3. Location of the construction site (based on Google Earth).
《Table 1》
Table 1 Main specifications of EPB shield machine in this study.

《4.2. Geological conditions》
4.2. Geological conditions
Before excavating the tunnel, the geological conditions were examined using a series of boreholes. In this study, several boreholes were drilled to a depth of approximately 45 m every 50– 70 m along the tunnel. The core samples were tested to determine different parameters such as internal friction angle and cohesion force. These factors were used to describe the geotechnical features and the formations along the tunnel path. The plasticity index of the soil encountered by the shield machine varied from 11.90 to 25.10. Moreover, the consistency index of the soil samples was below 1. The ground water table varied between 1.63 and 3.63 m below the ground surface. According to the preliminary geological investigations, the geological formations outcropping in the project area mainly consisted of backfill, silty clay, weathered rock, and moderately to highly weathered granite. The properties of various ground formations are illustrated in Table 2. The present study focused on the shield tunneling performance in mixed ground formation of rock–soil strata. For soil stratum, the undrained shear strength of soil was calculated using the following two approaches [50–53]: ① the modified Cam-clay model (MCC) [53–55]; and ② Ladd’s empirical equation [56]. For the MCC model, the undrained shear strength of soil was determined based on the following equations:

where Su refers to the undrained shear strength, p' is the initial effective mean stress, μ = q'/p' (q' refers to the initial deviator stress), OCR is the over consolidation ratio, is the equivalent effective mean stress; g is the slope line failure;
  , and K and
  refer to the slope of the rebound line in the e–lnp' (e: the void ratio) plot and compression line, respectively. For Ladd’s empirical equation, Su is estimated as follows:

where  is the vertical effective stress; S and k are constants, and were adapted based on Ladd’s work [56], in which the value of S was 0.162–0.250; and k is 0.75–1.00.
For rock stratum, the UCS of the surrounding rock (  ) values were calculated based on the following approach [57]:

where CT is the cutterhead torque, Nc is the cutter number, PR is the penetration rate, and DTBM is the cutterhead diameter of the tunnelboring machine (TBM).
《Table 2》
Table 2 Geological description of the tunnel.

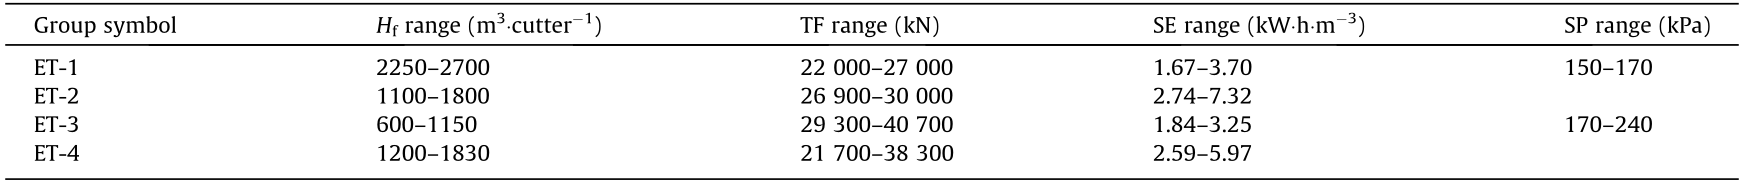
Fig. 4 displays the geological profile along the tunnel, and introduces the rock classifications [58,59]. As shown in Fig. 4, key data extracted from the field such as the rock quality designation (RQD), quartz content (Qc), joint surface condition, and UCS were considered. The rock mass classifications along the studied section were defined according to the Chinese standard ‘‘Code for hydropower engineering geological investigation” (GB 50287–2016), which can be utilized to guide excavation design and underground works [60]. The classification of the rock formation for the engineering topography (ET) in zones ET-1, ET-2, and ET-4 was soft rock, as shown in Fig. 4, while the formation of rock ET-3 was classified as hard rock [61].
《Fig. 4》
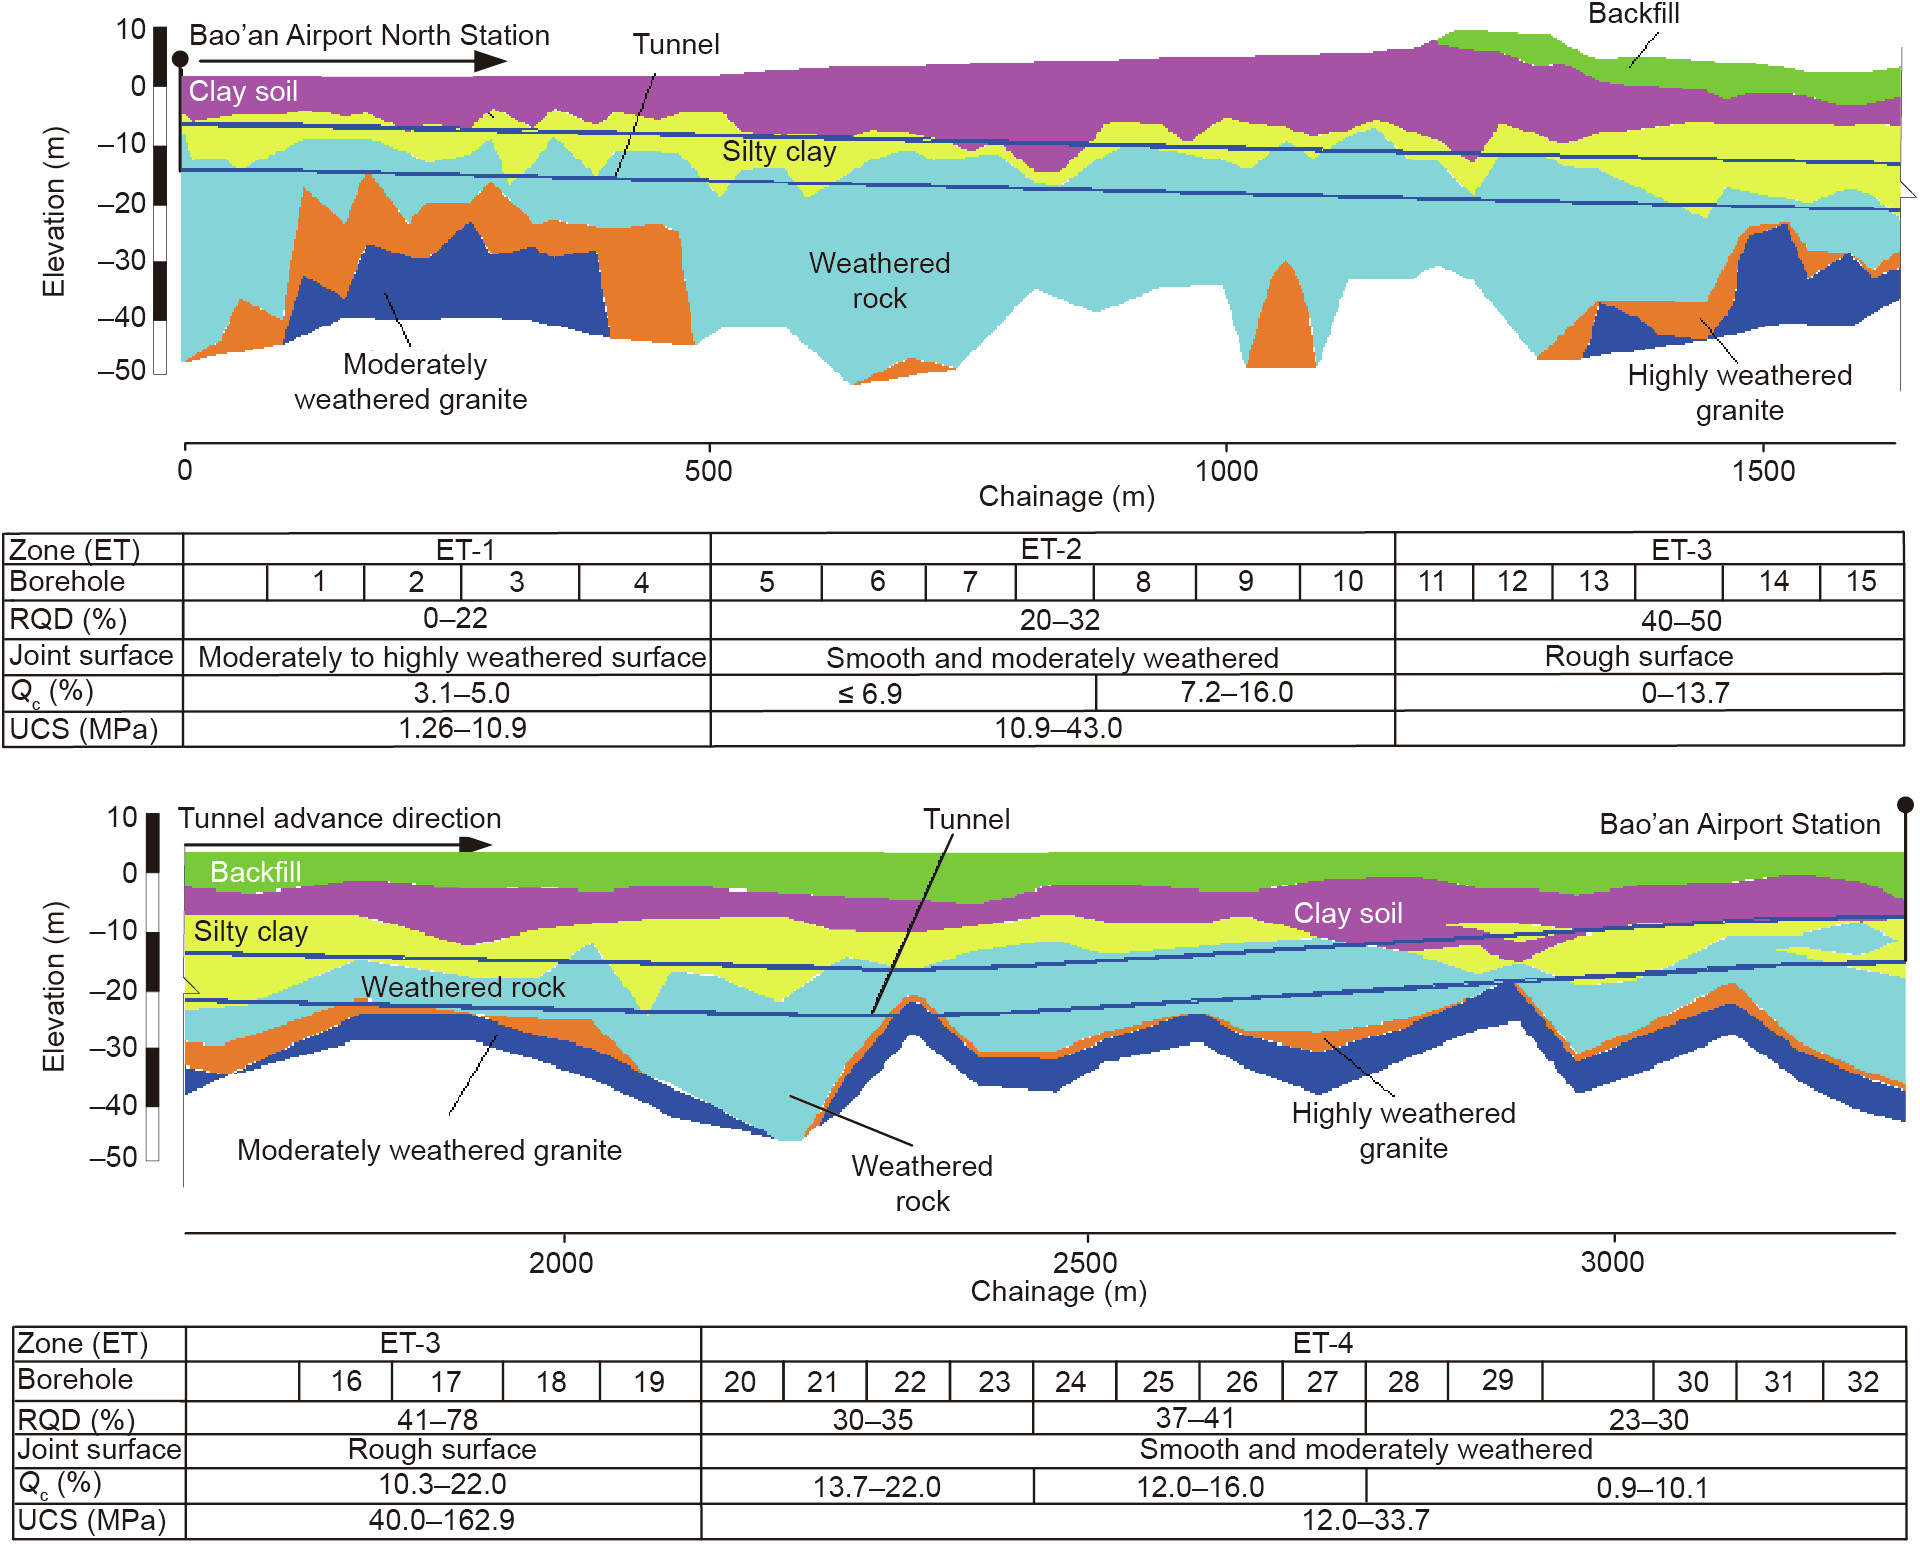
Fig. 4. Topography of the construction site in the longitudinal tunnel direction. ET: engineering topography; RQD: rock quality designation; Qc: quartz content.
Rock abrasivity is essential for estimating disc cutter life. The Cerchar abrasivity index (CAI) is a fast, simple, and economic method for determining rock abrasiveness [62]. According to Cerchar’s definition, the CAI values vary from 2.0 to 3.3 for metamorphic schist rock. Thus, the ground can be defined as moderately to highly abrasive material. When the shield machine encounters silty clay, the ground is defined as slightly to moderately abrasive material with CAI values from 0 to 1.2 [63].
《4.3. Cutter wear analysis》
4.3. Cutter wear analysis
A disc cutter is used to chip hard and weathered rock layers or at positions where mixed face conditions are expected [64]. Fig. 5 shows a schematic section of the cutterhead machine and cutter arrangements of a shield. To determine the influence of cutter position on cutter consumption, the cutterhead was numbered based on the cutter positions (No. 1–12 are the central cutters; 13–46 are the face cutters; 47–56 are the gauge cutters). Cutter consumption was categorized into two classes: normal and abnormal wear. Normal wear is an expected type of wear that causes uniform abrasion for the cutter ring, as shown in Fig. 6(a). Abnormal wear refers to partial wear, bearing damage, chipping, and loosening. During cutter inspection, if the cutter rings reveal abnormal damage, the cutter should be immediately replaced. An example of disc cutter wear encountered during tunneling with abnormal wear (partial wear and damage by chipping or breaking) is shown in Figs. 6(b)–(d). During the excavation process, 112 disc cutters were replaced. Fig. 7 shows the overall number of worn disc cutters for every disc position, and most worn cutters (more than 70%) exhibit normal wear. According to Fig. 7(a), the central cutters did not exhibit normal wear owing to the very small radii of their positions compared with their diameter. The number of disc replacements increased for the outer edge of the cutterhead. In addition, the rate of consumption of disc cutters indicates that the cutter-exchange frequency was extremely high for disc cutters 47–56 in the gauge area (three times higher than the cutter replacements for the total excavated tunnel length). This obvious increase can be explained as a result of cutters No. 1–46 being parallel to the direction of tunneling excavation and perpendicular to the face of tunnel. In contrast, there are 7°–8° between the directions of the gauge cutters (arc segments) for cutters 47–56. During the cutting process and under axial thrust, the greater the angle, the higher the lateral force endured by the disc cutter. This observation is in accordance with previous publications [65,66]. The normal wear proportion is 74.11% (Fig. 7(b)). Fig. 8(a) presents the distribution of the disc cutter replacements for abnormal wear. According to the results, the replacement number of disc cutters is independent of the cutter position for abnormal wear, which might be attributed to the contrast of the mixed strata. Furthermore, the abnormal wear is relevant for the operation level of the shield driver and breakage grade of the rock mass [14,67,68]. The flat wear proportion is 89% (Fig. 8(b)). The wear rate of an individual disc cutter is measured in terms of the ring height loss. Fig. 9 shows the analyses of the collected wear mounted on the cutterhead at each position. It can be deduced that the collected wear extent of the face and gauge cutters increases greatly with distance from the cutterhead to the center.
《Fig. 5》
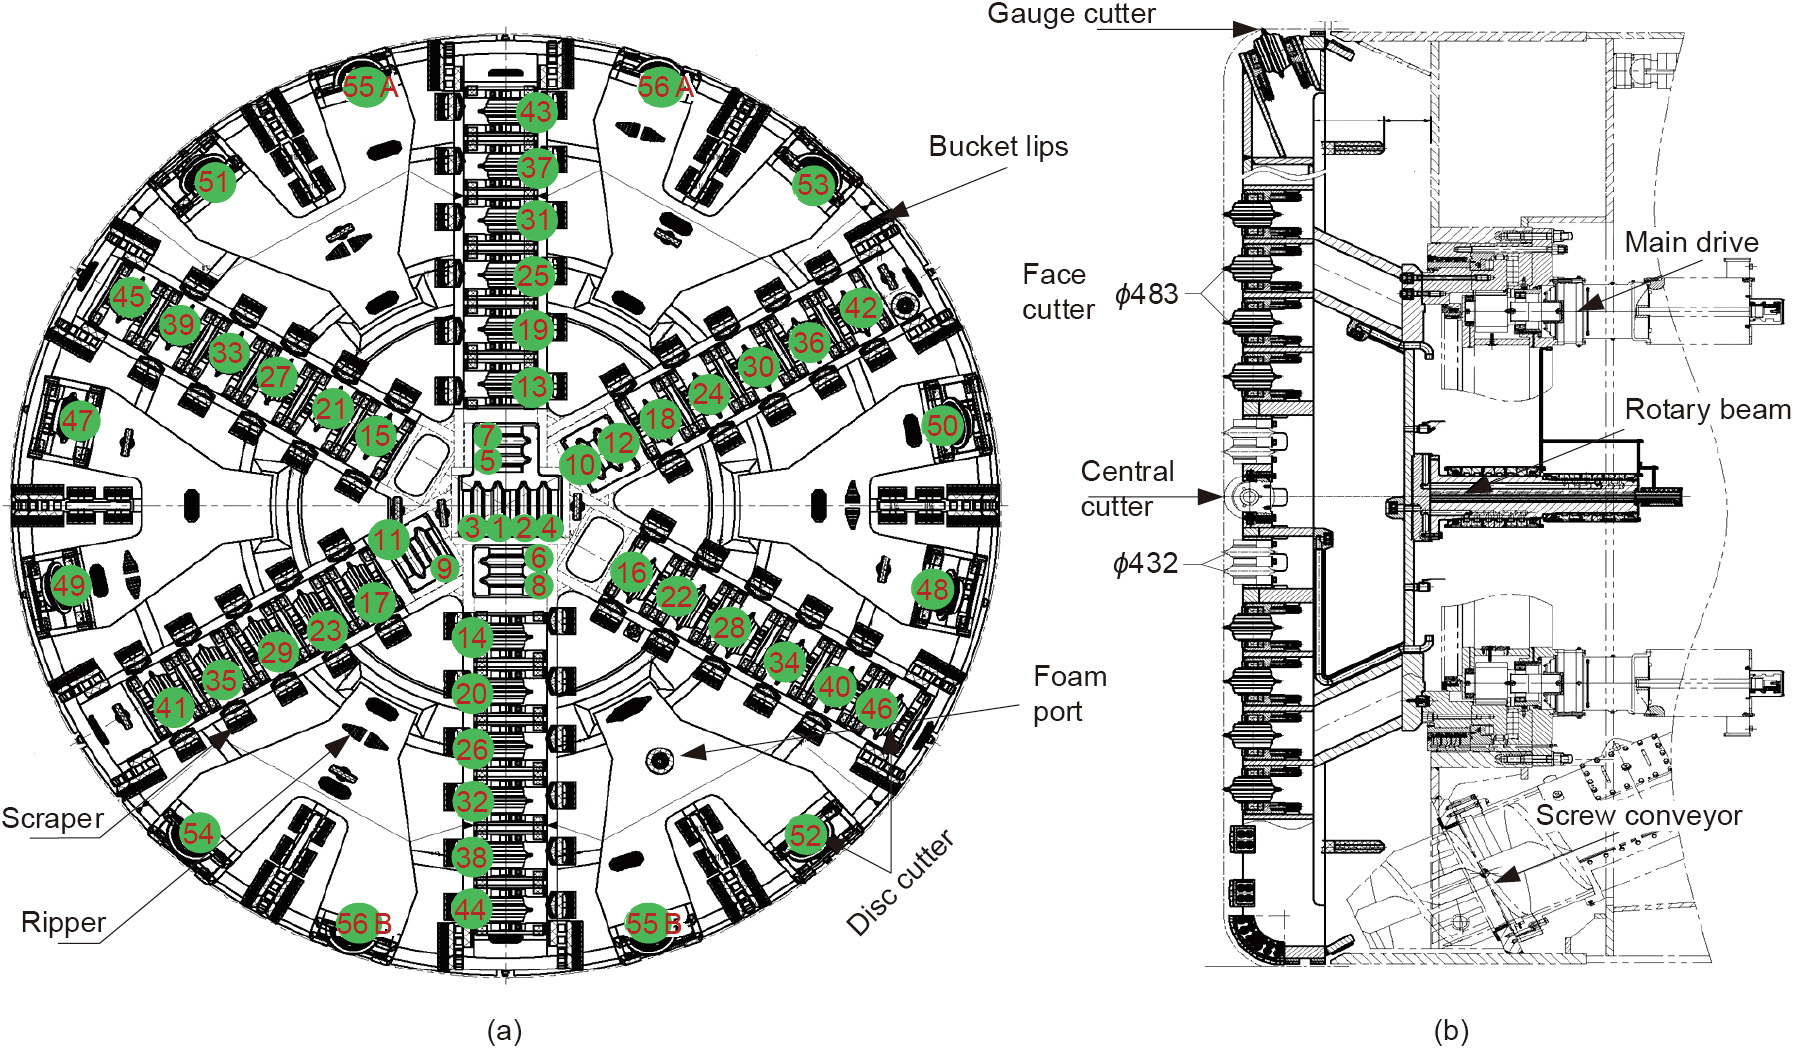
Fig. 5. EPB shield cutterhead components. (a) Cutter wheel with various excavation tools; (b) machine components. Φ: the diameter of the cutter (mm).
《Fig. 6》
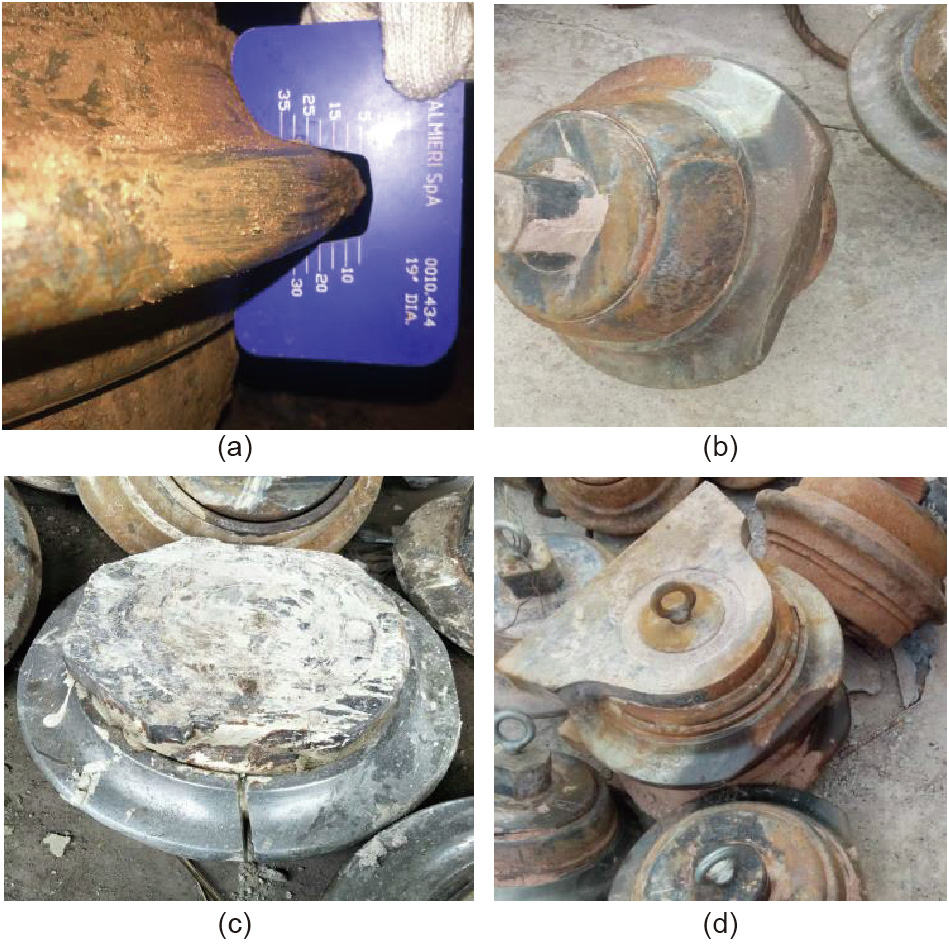
Fig. 6. Disc cutter wear. (a) Normal wear; (b) partial wear; (c) breakage wear; and (d) badly damaged.
《Fig. 7》
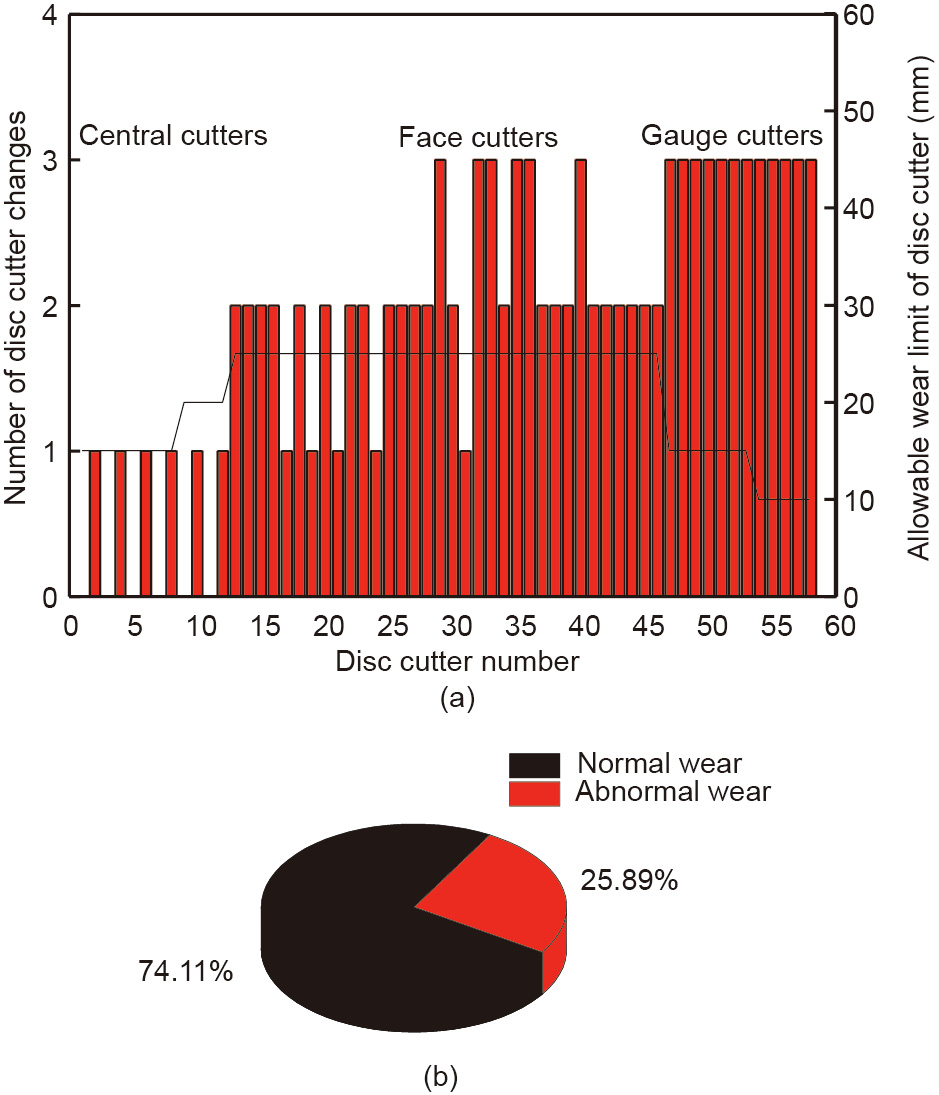
Fig. 7. (a) Disc cutter replacement for various disc cutter positions and (b) the proportion of normal and abnormal wear of the disc cutter in the studied project. The solid line in (a) represents the wear limit.
《Fig. 8》
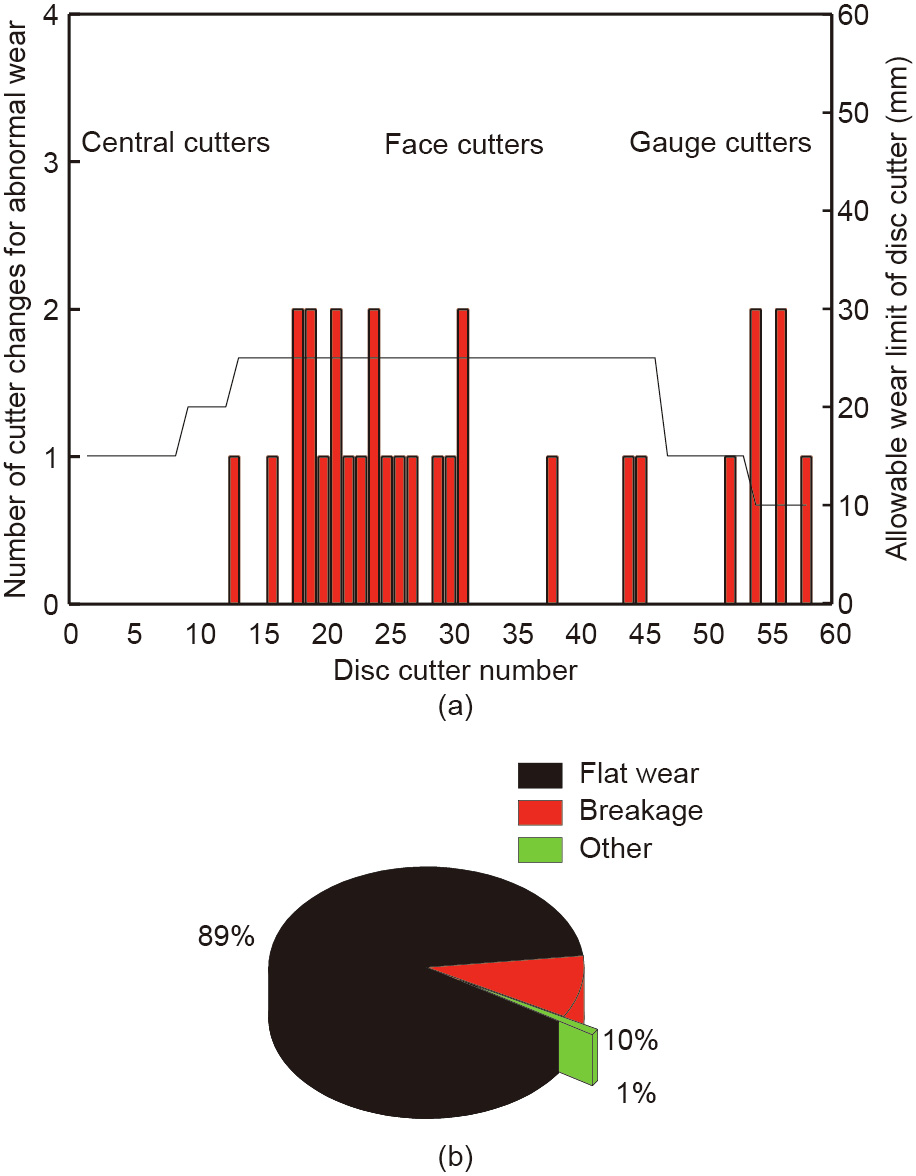
Fig. 8. (a) Disc cutter replacement for abnormal wear and (b) the proportion of flat wear, breakage, and other damages of disc cutter in the studied project. The solid line in (a) represents the wear limit.
《Fig. 9》
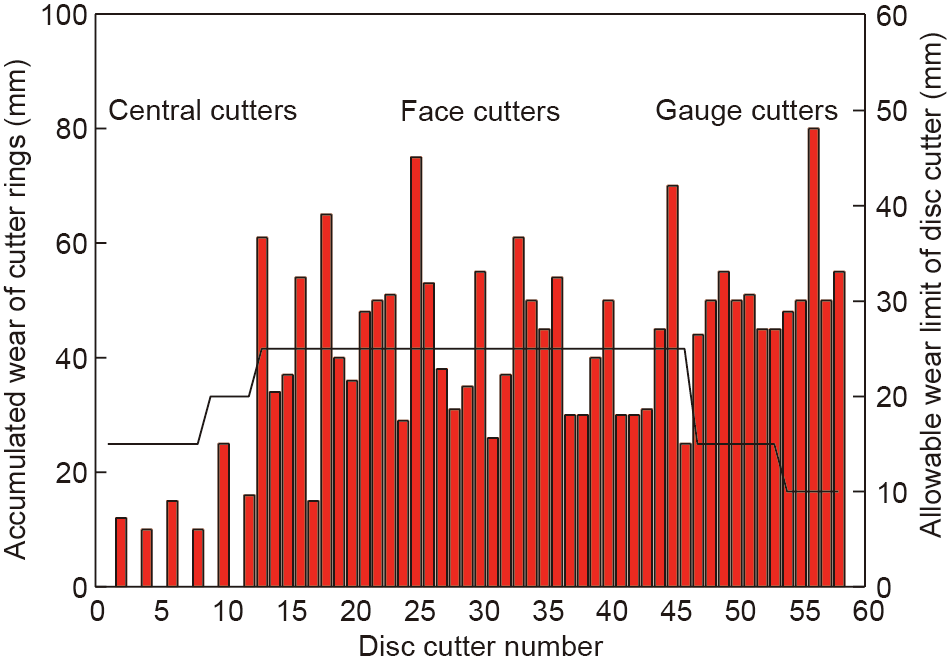
Fig. 9. Histogram of accumulated wear extent of rings in the studied project. The solid line represents the wear limit.
《Table 3》
Table 3 Calculated cutter life and cutter wear for studied section.

Disc cutter life is identified as the amount of time each cutting tool is used for before it requires replacement. Bruland [69] expressed disc cutter life using three different methods: Hm, Wm, and Hf. That is, disc cutter life can be defined as the excavated tunnel length per cutter (Hm in meter per cutter) or via the wear of a disc cutter, which is represented by the number of cutters changed per rolling distance of excavated soil (Wm in cutter per meter). Finally, disc cutter life can be defined as the soil excavation volume per cutter (Hf in cubic meter per cutter). To calculate these parameters, the following equations are used:

where NTBM, L, and d are the number of exchanged disc cutters, excavated length (m), and shield diameter (m), respectively. Table 3 lists the estimated cutter life and wear in this study. The results indicate that the average cutter life was 29.46 m, which corresponds to an excavation volume of 1820 m3 . Among the above three parameters, Hf has been shown to be the most suitable parameter for estimating cutter life in several projects [23]. Therefore, Hf was employed as a parameter to predict disc cutter life.
《4.4. Data preparation》
4.4. Data preparation
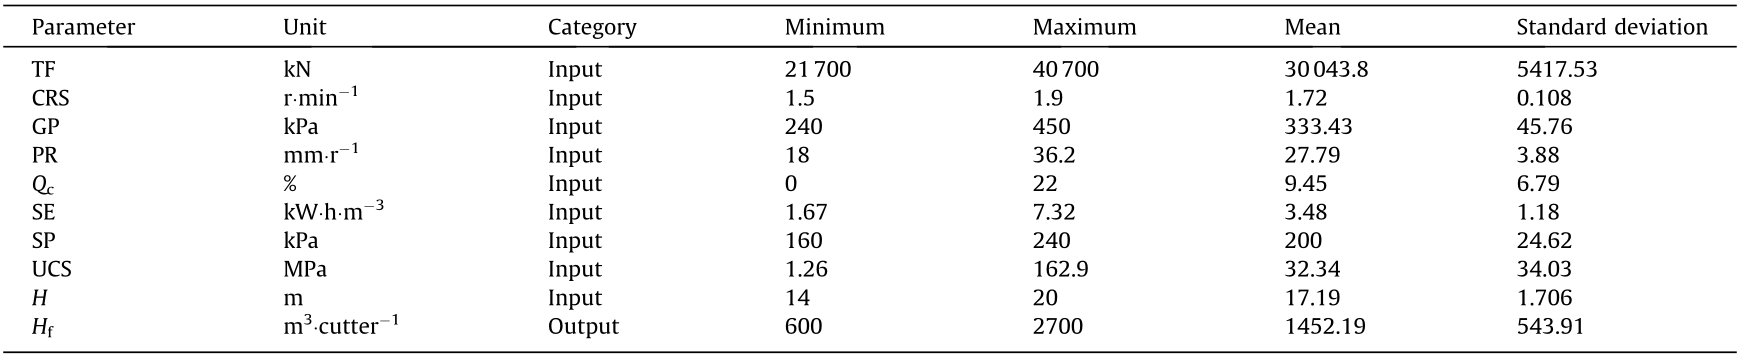
To consider the geological conditions, geological and geotechnical reports from boreholes and surface outcrops were used in this study. The geological characterization was considered from the extracted core samples (Section 4.2). The intact rock properties and rock mass parameters were used to quantify the ground characteristics. For each tunnel section, the values of the parameters were calculated from different sets of tests in the database [23,61,66]. The mean values of these parameters were then utilized to detect the geotechnical properties of the specified engineering geological sets. To build up a complete database, the tunnel was split into 32 sections with uniform geological characteristics (Fig. 4). The database was divided into two main categories. The first category comprised the geological conditions, such as intact rock properties (UCS and Qc) and rock mass parameters (RQD). The variation range of the UCS was between 1.26 and 162.9 MPa, and the optimal values of Qc and RQD were 22% and 78%, respectively. The second category contains the shield construction parameters, such as PR, TF, GP, SP, and SE. Table 4 summarizes the statistical analyses of the input and output models. In this study, a proposed method suggested by Bruland [69] was used to estimate the disc cutter life over the tunneling process. The instantaneous cutter life was estimated for every part by collecting the cutter wear and life at every cutter replacement section. Along the tunnel alignment, the variation in disc cutter life indicated that most estimated average values of cutter life were between 600 and 2700 m3 per cutter. Furthermore, the maximum was approximately 4.5 times the minimum. Table 5 shows the mean values of disc cutter life and some shield operational parameters along the studied tunnel section.
《Table 4 》
Table 4 Descriptive statistics of generated database for this study.
《Table 5》
Table 5 Excavation performance data along the tunnel alignment.
《5. Model development》
5. Model development
Several empirical equations based on geological conditions have been used to predict disc cutter life in geotechnical engineering applications [23,67]. This study aims to develop empirical models based on not only geological conditions, but also shield operational parameters, in order to predict the disc cutter life for excavation tunnels. Therefore, two statistical techniques (i.e., simple and multiple regression models) were utilized to develop the relation between disc cutter life and the influencing factors.
《5.1. Simple regression model》
5.1. Simple regression model
In this study, different simple regression models were analyzed using cutter life as an objective variable. The influences of differen parameters, including SP, UCS, CRS, and Qc, on the prediction of cutter life were investigated. The correlations between disc cutter life and certain geological and operational engineering parameters via linear and nonlinear regression models are displayed in Fig. 10. The UCS was found to be the most suitable parameter for predicting disc cutter life, compared with the other parameters. The results of the regression coefficients and related equations are listed in Table 6 [23,65].
《Fig. 10》
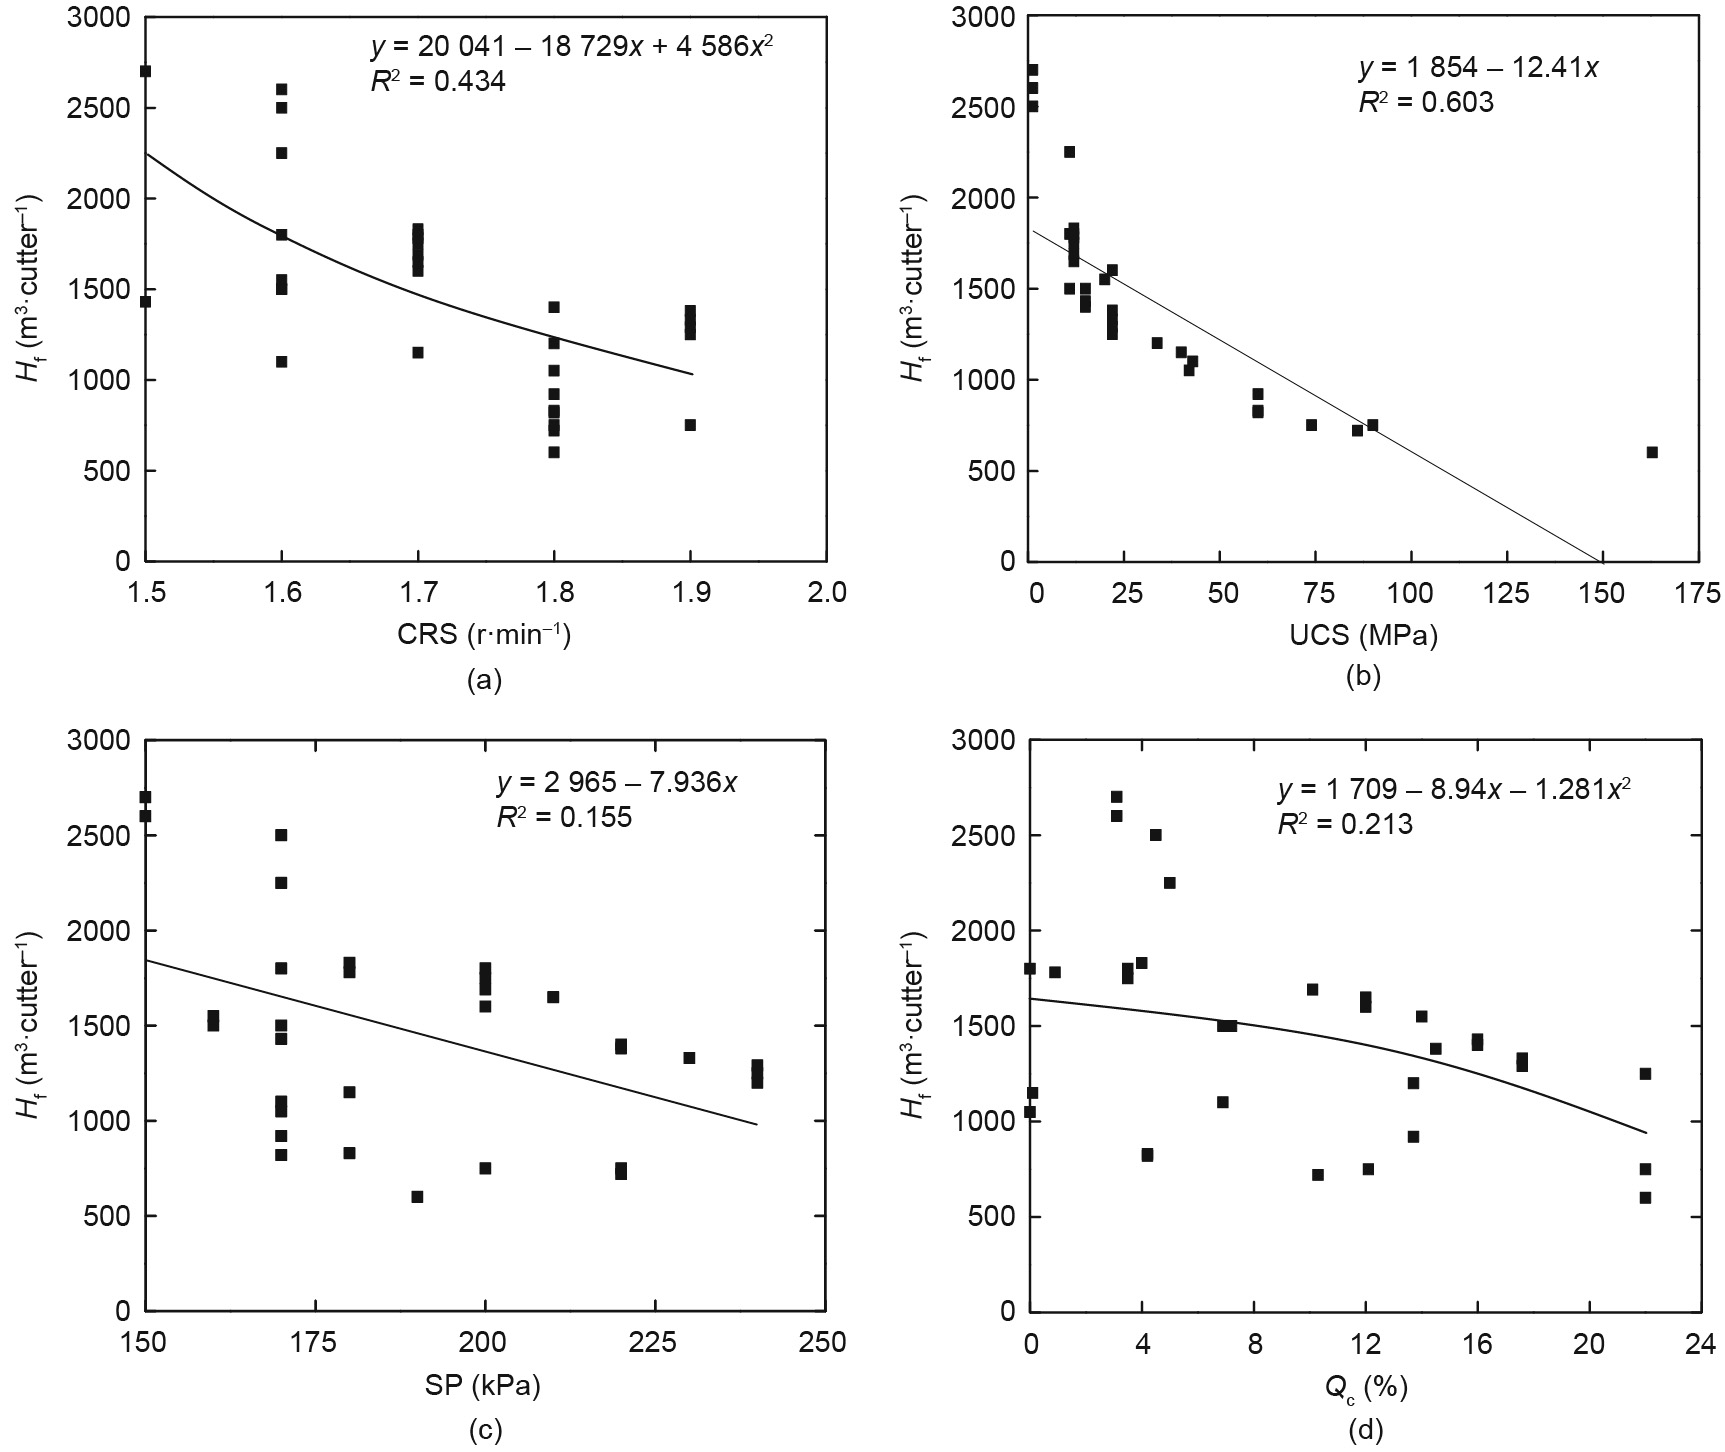
Fig. 10. Relationship between recorded disc cutter life (Hf) and different operational and geological parameters. (a) CRS; (b) UCS; (c) SP; (d) Qc.
《5.2. Nonlinear regression model》
5.2. Nonlinear regression model
Cutter wear depends on many parameters [10,14,65]. A nonlinear multiple regression model can be used to combine more than one parameter (independent parameter) that affects the cutter life (dependent parameter) during tunneling. Hence, a multiple regression model was employed to determine a nonlinear solution with an optimal fit to the existing data. After performing a series of simulations, the best correlation of the geological and operational parameters for the prediction of cutter life was obtained for the PR, RPM, and UCS parameters (best fit with R2 = 0.84, based on Eq. (20) in Table 6). Fig. 11 displays the relationship between the actual and predicted results for cutter life. The proposed model is compared with previous models in Table 6. Evidently, the proposed model predicts cutter life better than the previous models. It can be noted that the results of the multiple regression model are statistically meaningful. However, in order to achieve better performance, a more advanced model should be developed.
《Table 6》
Table 6 Results of regression coefficients for different input and output parameters [23,65].

VHNR: Vickers hardness number of the rock.
《Fig. 11》
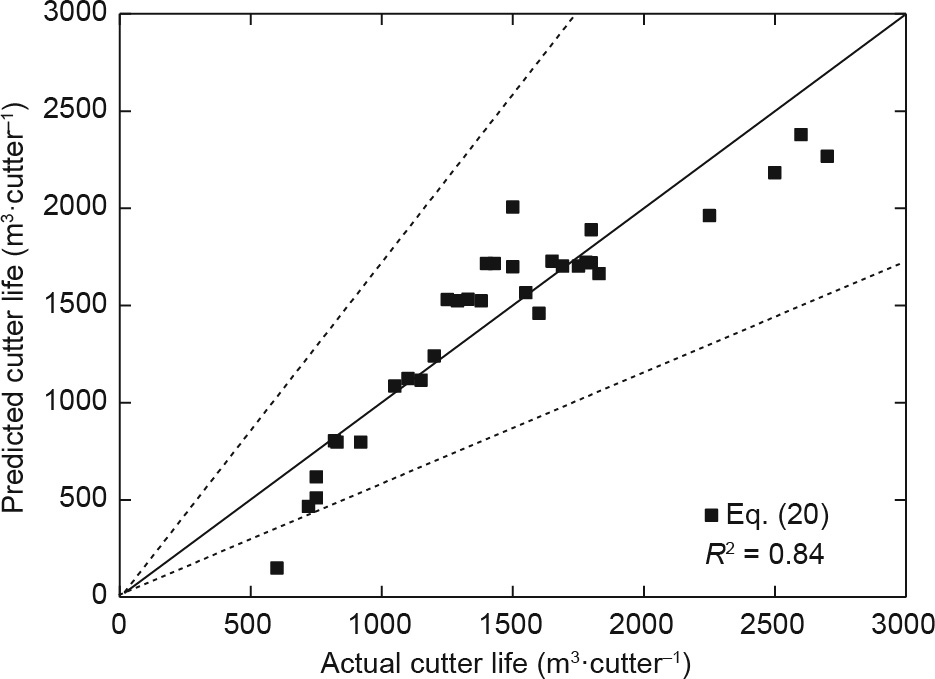
Fig. 11. Comparison between actual and predicted cutter life from multivariate nonlinear regression analysis.
《5.3. Evaluation of cutter life using GMDH–GA》
5.3. Evaluation of cutter life using GMDH–GA
The GA was applied to optimize the quadratic function parameters and thus gain the best structure of the GMDH technique. The essential stages of the hybrid GMDH–GA are illustrated in Fig. 2. The first step includes the selection of proper inputs. Previous studies were examined to identify the most effective parameters for estimating disc cutter life. The accuracy of the predicted model depends on the inclusiveness of the empirical data and appropriate choice of input parameter. As mentioned above, an extensive data range that covered the tunnel section was used to develop the model. To select the best model structure using GMDH–GA, four models were proposed. To determine the prediction ability of the developed models, the data were split haphazardly into two sets: a training set and a testing set. Among the 32 datasets used in this research study, 70% of the complete dataset (training group) was employed to determine the coefficients in Eq. (5), whereas the other 30% (testing group) was used to evaluate the trained model. Several parameters were involved in the structure of the hybrid GMDH–GA model (e.g., size of population, number of hidden layers, probability of crossover and mutation, and number of generations). The selected parameters can affect the model generalization ability. To employ the GA in the GMDH design structure, a population of 100 individuals with 0.95 crossover probability and 0.01 mutation probability was used through 300 generations; no further improvement was conducted. The corresponding polynomial representations obtained via the structural models and the relevant equations for models GMDH–GA-1 to GMDH–GA-4 are illustrated in Table 7. These polynomial representations are provided for each model based on Eq. (5), using a partial quadratic polynomials system with two variables. For example, in GMDH–GA-1, Y1 is estimated based on PR and UCS; Y2 is determined based on TF and PR; and Y3 is not independent but is related to Y1 and Y2. Hf is then estimated based on Y3 and PR. These mathematical equations and their coefficients are obtained from the four different models to predict disc cutter life during the tunneling process. These analyses are visualized in Fig. 12, which displays the structure of the developed double hidden GMDH layers for the four GMDH–GA models. Double hidden layers were chosen to avoid over-fitting and obtain simpler equations. Inserting more hidden layers greatly increased the complexity of the established model without achieving substantial improvement.
《Table 7》
Table 7 Parameters and coefficients used in neuron equations.

《Fig. 12》

Fig. 12. Evolved structure of double hidden GMDH layers in models GMDH–GA-1 to GMDH–GA-4 for the prediction of Hf.
To evaluate the deviation between the results predicted via GMDH–GA and field data, the root mean-square error (RMSE) and correlation coefficient (R2 ) were applied:

where xmea, xpre, xm, and n are the measured, predicted, and mean x values and the total number of datasets, respectively.
Fig. 13 shows the relation between the actual and predicted cutter life for all datasets. According to Fig. 13, the values of the predicted cutter life from four GMDH–GA models exhibit a good correlation for both the training and testing datasets. Furthermore, the predicted disc cutter life values are limited to curves corresponding to ±20%, which indicates high accuracy of the hybrid models in the prediction of cutter life during the tunneling process. The best quadratic polynomial model for predicting Hf consists of UCS, PR, TF, and CRS, and is presented in model GMDH–GA-3, as shown in Table 8. This model exhibits significantly lower error than the other models. Better accuracy can be achieved by minimizing the RMSE and maximizing R2 . Furthermore, the best hybrid GMDH–GA model was compared with the equation obtained from the multiple nonlinear regression (Eq. (20)) to evaluate its accuracy. According to the result, the hybrid model can effectively predict cutter life via geological and operational parameters—that is, the correlation coefficient R2 = 0.967 and RMSE = 97.22 compared with the empirical equation with R2 = 0.84 and RMSE = 218.
《Fig. 13》

Fig. 13. Comparison between actual and predicted Hf by models GMDH–GA-1 to GMDH–GA-4.
《Table 8》
Table 8 Statistical results for evolved GMDH–GA models.

《5.4. Sensitivity analysis》
5.4. Sensitivity analysis
A sensitivity analysis for the proposed model was carried out to define the impact of each input parameter on the model output. Analysis of the double hidden layers of the GMDH structure was performed by changing each input parameter at a constant rate and keeping the other input variables constant. The cosine amplitude model was used to perform the analysis [49]:

where Li and Lj are the input and output parameters, and n is the total number of datasets. The Rij value [0, 1] expresses the strength of the relationship between every input variable and the output model. Fig. 14 shows the results of Rij estimated via the GMDH algorithm for double hidden layers. As can be seen, the PR is the most significant parameter in the hybrid model for cutter life prediction.
《Fig. 14》

Fig. 14. Influence of each input parameter on the output of the double hidden layer model.
《5.5. Discussion》
5.5. Discussion
According to the aforementioned empirical models, disc cutter life basically depends on geological and operational parameters. To obtain more accurate estimations, a GA was applied to the GMDH model to optimize the quadratic function parameters and thus improve model accuracy. Four parameters (UCS, PR, TF, and CRS) were demonstrated to be closely linked with cutter wear and were therefore utilized as factors for predicting disc cutter life. The results of GMDH–GA-3 confirmed that using these four parameters helped to accurately predict disc cutter life with high accuracy (Fig. 13). To evaluate the effect of every input parameter on the model output, a sensitivity analysis was performed. Using the results of this study, engineers studying tunneling engineering can have a deeper understanding of the prediction of disc cutter life and can make a reasonable choice between different prediction models. It is noteworthy that rock mass properties such as the UCS have an evident impact on disc cutter life. This fact was the stimulus for analyzing disc cutter life to evaluate and infer the variation of geological conditions. Given the importance of shield operational parameters, the method developed in this study could become necessary to create a new factor governance method for shield performance. Moreover, the parameters used in hybrid model GMDH–GA-3 reflect the field conditions and differ with cutter wear changes. Thus, this model can predict disc cutter life in a timely and reliable manner.
Finally, it must be mentioned that shield tunneling is often conducted in rock–soil varied strata, and thus benefits from improvements in design and manufacturing technologies for the cutterhead and its cutters. The EPB shield machine studied here is used in many current tunneling projects—particularly in China (e.g., in the case study of the Sui–Guan–Shen (Guangzhou– Dongguan–Shenzhen) intercity railway in the Pearl River Delta [8]; the Guangzhou South Railway Station for the intercity railway project; the railway tunnel project in Changsha, Hunan [70]; and the intercity tunnel project between Guangzhou and Foshan (under construction) [71]. However, adaptations might be necessary for cases with different cutting heads.
《6. Conclusions》
6. Conclusions
This study proposed an AI approach to predict disc cutter life during shield tunneling in rock–soil varied strata. To achieve accurate estimation, a database was compiled and subjected to statistical analysis to derive new approaches and models for predicting disc cutter life and thus improving the shield machine performance. The proposed model includes not only geological data, but also shield operation parameters. The following conclusions can be drawn:
(1) The results indicate that normal wear significantly affects disc cutter life, and the accumulated wear volume of the disc cutters increases with increasing distance between the cutterhead center and the face cutters.
(2) The proposed empirical model provides a reasonable tool for the quick assessment of construction parameters and the verification of field results for the prediction of cutter life with an acceptable accuracy range (R2 = 0.84).
(3) The results obtained via the GMDH–GA models exhibit a high degree of accuracy for disc cutter life values and a notably better performance than those obtained from empirical models. To assess the effect of each input parameter on the model output, a sensitivity analysis was performed. The sensitivity analysis shows that the PR of the shield machine, as predicted using double hidden GMDH layers, significantly influences the disc cutter life.
(4) In applications, the proposed GMDH–GA model can use shield operational parameters (TF, PR, CRS) and geological conditions (UCS) as inputs to predict disc cutter life during the tunneling process. The proposed model is general, and can be utilized to analyze different tunneling systems in other projects with similar geological and mechanical conditions. Eventually, the proposed model is expected to provide insightful suggestions to support engineers in the prediction of disc cutter life; it can be utilized as intelligent selection to achieve acceptable prediction in both the planning and construction stages.
《Acknowledgements》
Acknowledgements
The research work was funded by ‘‘The Pearl River Talent Recruitment Program” in 2019 (2019CX01G338), Guangdong Province and the Research Funding of Shantou University for New Faculty Member (NTF19024-2019), China.
《Compliance with ethics guidelines》
Compliance with ethics guidelines
Khalid Elbaz, Shui-Long Shen, Annan Zhou, Zhen-Yu Yin, and Hai-Min Lyu declare that they have no conflict of interest or financial conflicts to disclose.


 京公网安备 11010502051620号


