

《1. Introduction》
1. Introduction
The Knudsen effusion cell is one of the most universal evaporators used to grow high-quality Cu(In,Ga)Se2 (CIGS) film in coevaporation processes. Recently, many research institutions, such as Center for Solar Energy and Hydrogen Research BadenWürttemberg [1], National Renewable Energy Laboratory [2], Solibro GmbH [3], and Uppsala University [4], have achieved a record efficiency of above 20% for CIGS devices using this method. However, when traditional single-heating Knudsen effusion cells are used as the evaporators of copper (Cu), indium (In), or gallium (Ga), obvious condensation and droplet ejection can be observed at the nozzle of the crucible [5,6]. If these droplets spray onto the substrate, a large amount of incomplete metal selenides form on the CIGS film. In addition, a low substrate temperature will further deteriorate the quality of the CIGS film due to the low diffusion coefficient of the metal elements [7]. In order to grow highquality CIGS film, many researchers choose a Knudsen effusion cell that consists of two independent heating systems, which is known as the double-heating Knudsen effusion cell. One heating system is used to evaporate the material in the crucible and the other is applied to keep the nozzle of the crucible at a high temperature in order to avoid the formation of condensation and droplet ejection there [6,8]. Although the double-heating Knudsen effusion cell has a more favorable structure than the traditional cell, it requires a more complex control system and has a higher cost. Thus, it is necessary to design a new low-cost single-heating Knudsen effusion cell to grow high-quality CIGS film.
In this work, we focus on the CIGS film grown in a lowtemperature deposition process. First, we report on our investigation of the surface morphology of CIGS films prepared at different growth rates with traditional single-heating Knudsen effusion cells and our observation of some incomplete metal selenides in the CIGS film. Subsequently, we describe our failed attempts to eliminate these incomplete metal selenides by simply increasing the temperature of the selenium (Se) evaporator. We then attempt to identify the causes of the formation of incomplete metal selenides in CIGS films and analyze these causes using a thermodynamics process. Finally, we propose a new single-heating Knudsen effusion cell.
《2. Experimental process》
2. Experimental process
《2.1. Preparation of films and solar cells》
2.1. Preparation of films and solar cells
CIGS films with different growth rates were fabricated onto a molybdenum (Mo)-coated substrate in a three-stage co-evaporation process [9]. During the deposition process, the temperature of the Se source was kept at 310 °C. After CIGS deposition, a 50 nm thick cadmium sulfide (CdS) buffer layer was prepared by chemical bath deposition at a temperature of 77 °C. Sequentially, intrinsic zinc oxide (i-ZnO) and aluminum (Al)-doped zinc oxide (Al-ZnO) layers were deposited with thicknesses of 50 and 500 nm, respectively. Finally, a nickel (Ni)/Al grid with a thickness of about 1.5 μm was grown on top of the stacked layers. The active area of the CIGS solar cells is 0.34 cm2 with no antireflection coating [10].
For our baseline co-evaporation process, the deposition times of the three stages were respectively 15, 18, and 3 min, and the average growth rate of this process was about 63 nm·min-1 (named ‘‘Sample L”). We also fabricated two other samples with growth rates of 104 nm·min-1 (Sample M) and 231 nm·min-1 (Sample H). For the samples prepared by the new single-heating Knudsen effusion cell, the average growth rate of Sample L-N was similar to that of Sample L, and the average growth rate of Sample H-N approached that of Sample H (where ‘‘-N” indicates the samples that were fabricated by the new single-heating Knudsen effusion cell).
《2.2. Characterization》
2.2. Characterization
The composition of the CIGS film was determined by MagixPW2403 (Royal Philips NV, the Netherlands) X-ray fluorescence (XRF) analysis. An optical microscope (OM, STM6-LM, Olympus Corporation, Japan) was used to measure the surface morphology of the CIGS films. A scanning electron microscope (SEM) was used to characterize the morphology of the films, and its elemental distribution was measured by energy dispersive spectroscopy (EDS). The site-specific components of the elements were characterized by focused ion beam (FIB). Hall measurement (HL5550PC, Accent Optical Technologies, Inc., USA) was used to determine the electrical characterizations of the CIGS films at room temperature. The current–voltage (I–V) characteristics of the CIGS solar cells were measured by a Keithley 2420 (Keithley, USA) SourceMeter under air mass (AM) 1.5G (100 mW·cm-2 ) illumination. The external quantum efficiency (EQE) of the solar cells was measured by the ratio of the short-circuit photocurrent to the incident illumination intensity in the range of 350–1300 nm. The capacitance–voltage (C–V) and admittance spectroscopy (AS) characterizations were determined by an HP 4284A LCR meter (Agilent Technologies, USA).
《3. Results and discussion》
3. Results and discussion
《3.1. Effect of traditional single-heating Knudsen effusion cells on CIGS films》
3.1. Effect of traditional single-heating Knudsen effusion cells on CIGS films
Table 1 summarizes the components and thickness of the CIGS films prepared at different growth rates by traditional single-heating Knudsen effusion cells. The molar fraction ratios of  (GGI) and
  (CGI), and the thickness of these films are roughly similar for all absorbers.
《Table 1》
Table 1 Components of CIGS films at different growth rates, determined by XRF.

GGI: molar fraction ratio of  ; CGI: molar fraction ratio of
  .
.
The surface morphologies of the CIGS films grown at different growth rates were investigated by OM, as shown in Fig. 1. The morphology of the CIGS films was strongly affected by the growth rate. When the growth rate was increased from 63 to 231 nm·min-1 , a large number of dark spots were observed in the CIGS film.
《Fig. 1》
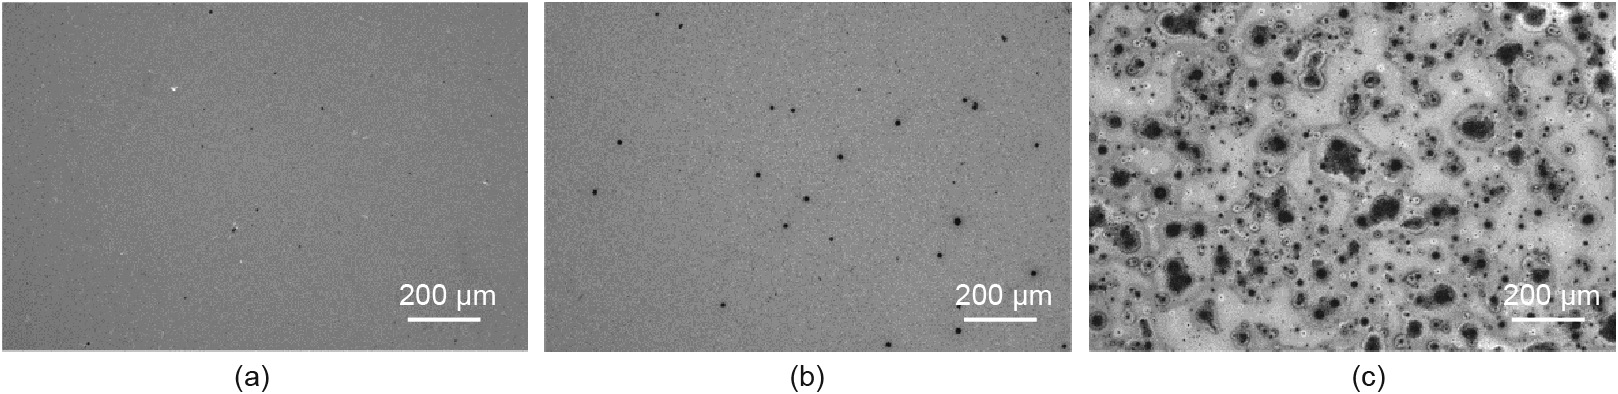
Fig. 1. OM images of (a) Sample L, (b) Sample M, and (c) Sample H.
Fig. 2(a) displays the SEM micrographs of Sample H; an island accumulation can be observed at the location of each dark spot. To determine the composition of the island accumulation, elemental mappings for Cu, In, Ga, and Se in Sample H are shown in Figs. 2(b)–(e), respectively. These mappings show that the island accumulation contains a high In content, which appears to be connected to the presence of incomplete metal selenides. In addition, two black dots next to the island accumulation appear in all elemental mappings. This phenomenon may be attributed to highenergy electron beams being blocked by the island accumulation during EDS mapping processes. In order to further distinguish the components of the island accumulation, the FIB result is shown in Fig. 3. Three locations in an island accumulation were chosen randomly and labeled 1, 2, and 3; their EDS components are summarized in Table 2. Although Cu has an almost uniform distribution in the film due to its high diffusion coefficient [7], the GGI value decreases from 0.692 to 0.255. This suggests the presence of a large amount of In in the island accumulation, which aligns with the elemental mapping results in Fig. 2(c). Previous studies have proposed that the expected molar fraction ratio of  in CIGS film should be close to 1 [11,12]. However, the ratios of the samples located at 1, 2, and 3 are 0.447, 0.808, and 0.612, respectively, which can be linked to the presence of binary phases. From the result of the Hall measurement shown in Table 3, it is found that Sample H has a higher carrier concentration and lower resistivity than Sample L, which indicates the presence of some metal-like phases in the former [13].
《Fig. 2》

Fig. 2. SEM morphology images of (a) Sample H and its elemental distribution measured by EDS in SEM: (b) Cu, (c) In, (d) Ga, and (e) Se.
《Fig. 3》

Fig. 3. FIB image of Sample H. Locations 1, 2, and 3 were selected from different parts of the dark spot.
《Table 2》
Table 2 Components and GGI values of samples at different locations in the island accumulation.

《Table 3》
Table 3 Hall results for Samples H and L.

《3.2. The way to eliminate dark spots》
3.2. The way to eliminate dark spots
To eliminate these metal-like phases, it is necessary to selenize the CIGS film completely. Previous research has reported that the degree of selenization for CIGS films is correlated with the Se fluxes, with higher Se fluxes promoting the degree of selenization [14]. However, regardless of the growth rates of CIGS films, the temperature of the Se evaporator was always kept at 310 °C; this indicates that the Se fluxes for Sample H may be insufficient. Therefore, we increased the temperature of the Se evaporator for Sample H from 310 to 320, 330, 340, and 350 °C, respectively; their OM results are shown in Fig. 4. However, these films still contain a large number of dark spots, which confirms that simply increasing the temperature of the Se evaporator is not an effective way to eliminate island accumulation (dark spots) in CIGS film.
《Fig. 4》
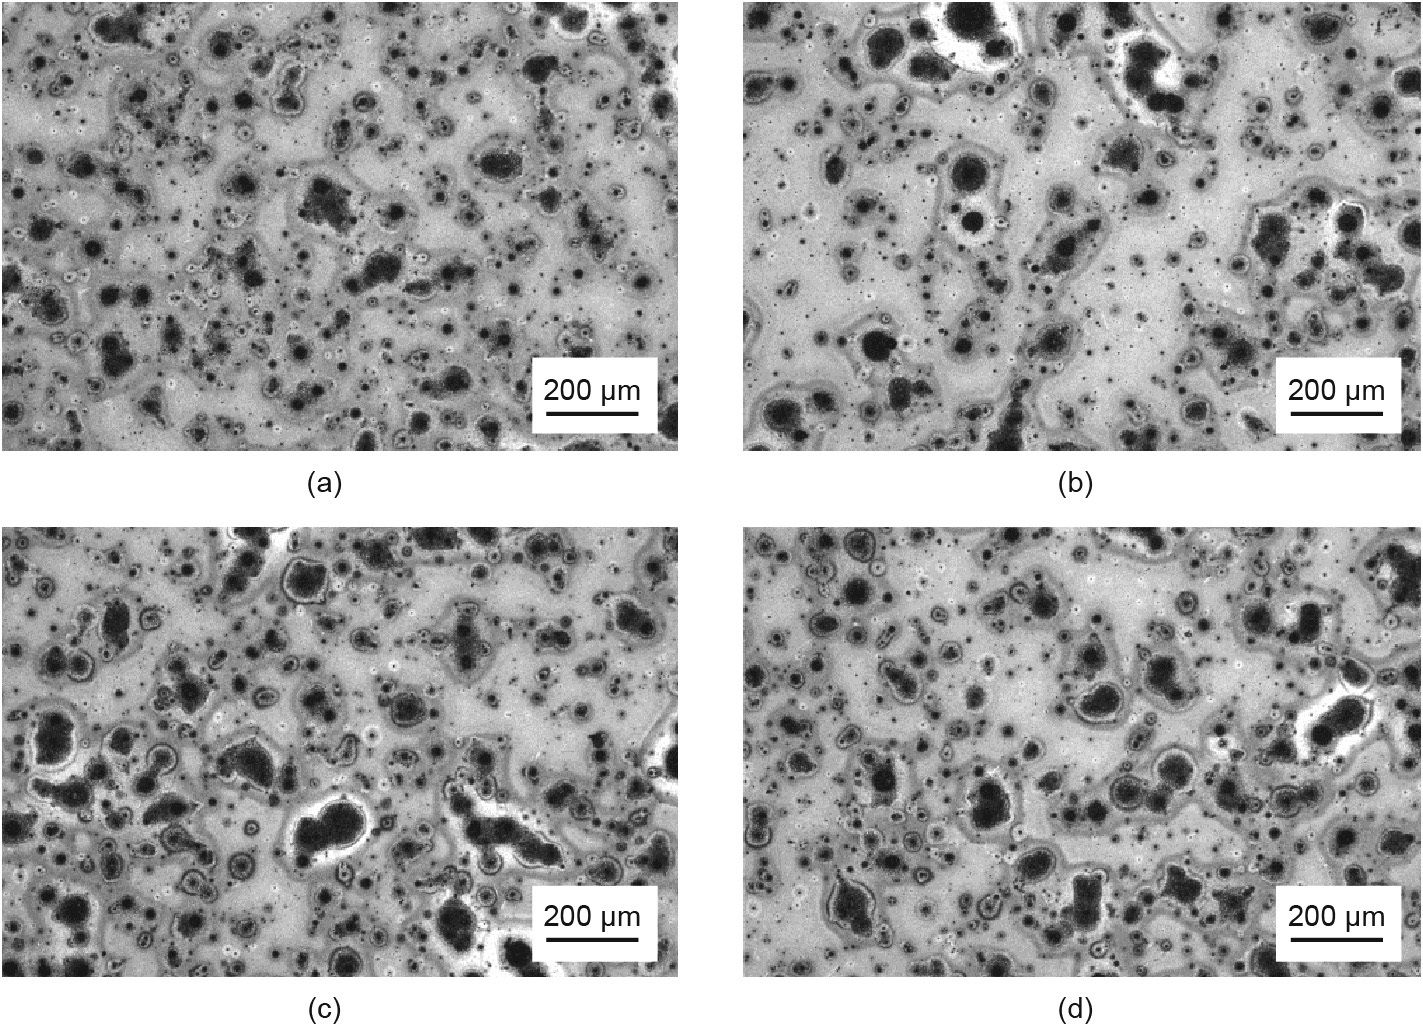
Fig. 4. OM images of CIGS films prepared at different Se evaporator temperatures at a growth rate of about 230 nm·min-1 and a substrate temperature of 450 °C. Results are provided for the Se evaporator at the temperatures of (a) 320 °C, (b) 330 °C, (c) 340 °C, and (d) 350 °C.
In fact, condensation and droplet ejection can also be observed at the nozzle of the Cu and Ga crucibles, which confirms that the traditional single-heating Knudsen effusion cell is incapable of growing high-quality CIGS film in this experiment. However, in our laboratory, a similar single-heating Knudsen effusion cell has no condensation when the height of the crucible is about 2 cm, implying that the height of the crucible may be a crucial factor in the phenomenon of condensation.
Supposing that the effusion cell has no heat loss, its temperature is the same everywhere in the crucible. Here, the mass-loss Knudsen effusion model was employed to explore the relationship between the condensation and the height of the crucible. During the period t, the vapor pressure P can be calculated by Eqs. (1) and (2) [15,16]:

where m is the mass of the effused metal element, t is the effusion time, T is the temperature, A0 is the area of the crucible,  is the transmission probability factor of the effusion cell, R is the molar gas constant, r is the radius of the crucible,
  is the length of the effusion orifice, and M is the molar mass. As shown in Fig. 5(a), as the radius of the crucible is the same from top to bottom, we can treat the length of the effusion orifice as the height of the crucible. Moreover, an assumption has been made that vapor pressures are the same in the whole crucible. According to Eqs. (1) and (2), the height of the crucible can be expressed by the following:

According to Eq. (3), it can be seen that the temperature decreases as the height of the crucible increases. If T0 is the lique-faction temperature, when the height of the crucible is greater than  , the temperature of the crucible will be lower than the liquefaction temperature and the phenomenon of condensation will be observed. In fact, the temperature difference between the nozzle and the bottom of the crucible is much greater than 100 °C, because serious heat loss occurs at the nozzle of the crucible. Theoretically, the heat loss for the traditional singleheat Knudsen effusion cell can be estimated roughly. The total heat loss (QTO) can be expressed as follows:

where QM is the metal vapor energy taken from the crucible. QT, QB, and QL are the heat loss at the top, bottom, and lateral of the single-heating Knudsen effusion cell, respectively as shown in Fig. 5(a). Although the bottom and lateral of the effusion cell have no obvious effect on the heat change of the crucible, QT and QM will obviously increase the total heat loss and result in the formation of condensation. Based on the temperature of the nozzle and the bottom of the crucible, QT and QM can be calculated by the heat radiation rule [17]:

where  are the emissivity, radiation constant, and radiation propagation speed in a vacuum, respectively. Here, QLS, T1, and T2 are used to characterize the heat loss energy, absolute temperature for radiation, and absolute temperature for the absorber, respectively. With the increase of heat loss energy, the temperature at the nozzle of the crucible will decrease. According to the Maxwell speed distribution function, the mean gas speed
  is [18]

where k is the Boltzmann constant. As the temperature at the nozzle of the crucible decreases, the speed of the vapor will be reduced. If this metal vapor becomes metal droplets, the speed of these droplets will be further reduced due to the fact that the molar mass for droplets is larger than that of the metal vapor. When these droplets spray onto the substrate, dark spots will form in the CIGS film. Furthermore, a higher evaporation temperature will result in the formation of larger metal droplets, which are caused by the increased molecular collision frequency for metal elements. Thus, more dark spots are present in Sample H than in Sample L. To summarize, serious heat loss at the nozzle of the crucible is the major factor for condensation.
《Fig. 5》
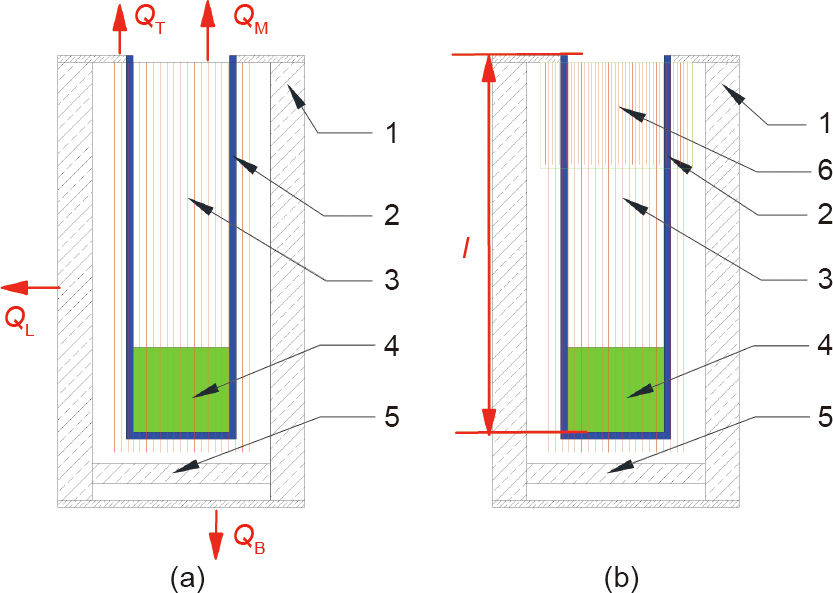
Fig. 5. Schematic of (a) the traditional single-heating Knudsen effusion cell and (b) the new single-heating Knudsen effusion cell. The heat loss QM is the metal vapor energy taken from the crucible. QT, QB, and QL are the heat loss at the top, bottom, and lateral of the single-heating Knudsen effusion cell, respectively. 1: the insulating layer for the effusion cell; 2: the crucible; 3: the single-heating coil of the effusion cell; 4: the evaporated material in the crucible; 5: the insulating layer at the bottom of the effusion; 6; the extra heater zone for the cell.
Based on the theory analysis described above, we propose a new single-heating Knudsen effusion cell, shown in Fig. 5(b). In comparison with the traditional effusion cell, the new cell has an extended heater on the upper half of the crucible, which is applied to provide extra energy to compensate for the heat loss at the nozzle of the crucible. The extended heater is part of the single-heating coil, so there is no need to introduce a new heating circuit and change the winding density of the single-heating system. It is only necessary to determine the length of the extended heater from the following equations:

where IS is the current of the resistance wire of the new Knudsen effusion cell. QS, RS, ρ, S, and LS are the heat energy from the extended heater, resistance, electrical resistivity, sectional area, and length of the heat wire of second layer, respectively. In order to maintain a high temperature at the nozzle of the crucible, QS must be greater than QLS or QM and QT; the length of the extended heater can be expressed as follows:

To research the effect of the new single-heating Knudsen effusion cell on CIGS film, different samples prepared by the traditional effusion cell and by the new cell are compared in Fig. 6. It is clear that the surface of Sample H-N is smoother than that of Sample H, which indicates that the new cell can effectively reduce condensation and droplet ejection at the nozzle of the effusion cell and improve the quality of the CIGS film. Samples L and L-N, which have a lower growth rate, show a similar result.
《Fig. 6》

Fig. 6. SEM morphology images of CIGS films for (a) Sample H, (b) Sample H-N, (c) Sample L, and (d) Sample L-N, where Samples L-N and H-N were fabricated by the new single-heating Knudsen effusion cell. Insets: OM images of the corresponding films.
《3.3. Solar cell device performances》
3.3. Solar cell device performances
Fig. 7 shows the I–V and EQE graphs for solar cells made from Samples H, H-N, L, and L-N with the same batch. Obviously, the device performance of solar cells made using the new effusion cell is higher than that of those made from the traditional one, which is mainly attributed to a high-quality CIGS films. In addition, the statistic boxplots for the short-circuit current density (Jsc), opencircuit voltage (Voc), and fill factor (FF) of the cells are shown in Figs. 8(a), (b), and (c), respectively. These figures show that the enhanced efficiency of solar cells made using the new singleheating Knudsen effusion cell is mainly derived from both the Voc and FF. However, the Jsc of Sample H and that of Sample H-N are slightly larger than those of Samples L and L-N, which may be related to the different growth rates of the samples. According to Ref. [19], a high growth rate in the second stage of the threestage co-evaporation process will result in a smaller minimum GGI value (mini GGI value). Thus, the varied Jsc can be attributed to the mini GGI value of the absorber layer, which absorbs more long-wavelength light [20].
《Fig. 7》

Fig. 7. (a) I–V curves and (b) EQE responses of the best CIGS solar cells fabricated from different absorber samples. η is the best efficiency of each batch cells. Jsc: short-circuit current density; Voc: open-circuit voltage; FF: fill factor.
《Fig. 8》

Fig. 8. Statistics boxplots of (a) the Jsc, (b) the Voc, and (c) the FF of the CIGS solar cells.
《3.4. Defect characteristics in CIGS devices》
3.4. Defect characteristics in CIGS devices
In order to further investigate the cause of the improved Voc and FF, the results of C–V measurement are shown in Fig. 9. The doping concentration (NA) in the CIGS films is 1.24 × 10¹⁶, 1.04 × 10¹⁶, 6.46 × 10¹⁵, and 3.72 × 1015 cm-3 for Samples H, H-N, L, and L-N, respectively; thus, the new effusion caused the doping level to decrease. According to Refs. [10,21], the relationship between the Voc and NA can be estimated by Eq. (10):

where q is the elementary charge. Based on this relationship, a higher doping concentration NA should lead to a higher Voc [21]; however, a higher NA corresponds to a lower Voc in our samples, so we can deduce that there should be other factors affecting the Voc of these devices.
To explore the main factor affecting the Voc, AS measurement was applied to determine the defect densities and their distributions for our samples. The results are shown in Fig. S1 in Appendix A. The deduced density spectra derived from the admittance spectra are shown in Fig. 10. The concentration of the defect level of Sample H is so high that its device performance clearly deteriorates. In addition, a shallow defect with an energy level of about 33.1 meV can be associated with some incomplete selenized metal elements in the film, which can be verified by Hall measurement. The defect density of Sample H-N decreased from 3.17 × 10¹⁶ to 1.05 × 1016 cm-3 ·eV-1 and the defect level increased from 33.1 to 173.1 meV, as shown in Fig. 10(b). This indicates that the quality of CIGS films with high growth rates is improved by the new effusion cell. Moreover, samples with normal growth rates have a similar variation trend, as shown in Figs. 10(c) and (d). Therefore, we can conclude that the new single-heating Knudsen effusion cell can improve the quality of the films.
Based on all of the analysis described above, we deduced that the difference in defect density and its distributions will contribute to the Voc and FF. A comparison of all samples in Fig. 6 shows that there are dark spots in Samples H, L, and H-N, whose Voc has decreased significantly compared with that of Sample L-N. These defects appear to be related to the shallow defect (the so-called N1 defect), which can obviously deteriorate the Voc [22,23]. Thus, dark spots in the CIGS film will lead to higher defect density and a deeper defect level. In addition, the N2 is often observed at about 250–300 meV and has no obvious effect on the device performance [23]. Therefore, the defects of Sample L-N may be attributed to the N2 defect.
《Fig. 9》

Fig. 9. Carrier concentration distributions for (a) Sample H, (b) Sample H-N, (c) Sample L, and (d) Sample L-N.
《Fig. 10》
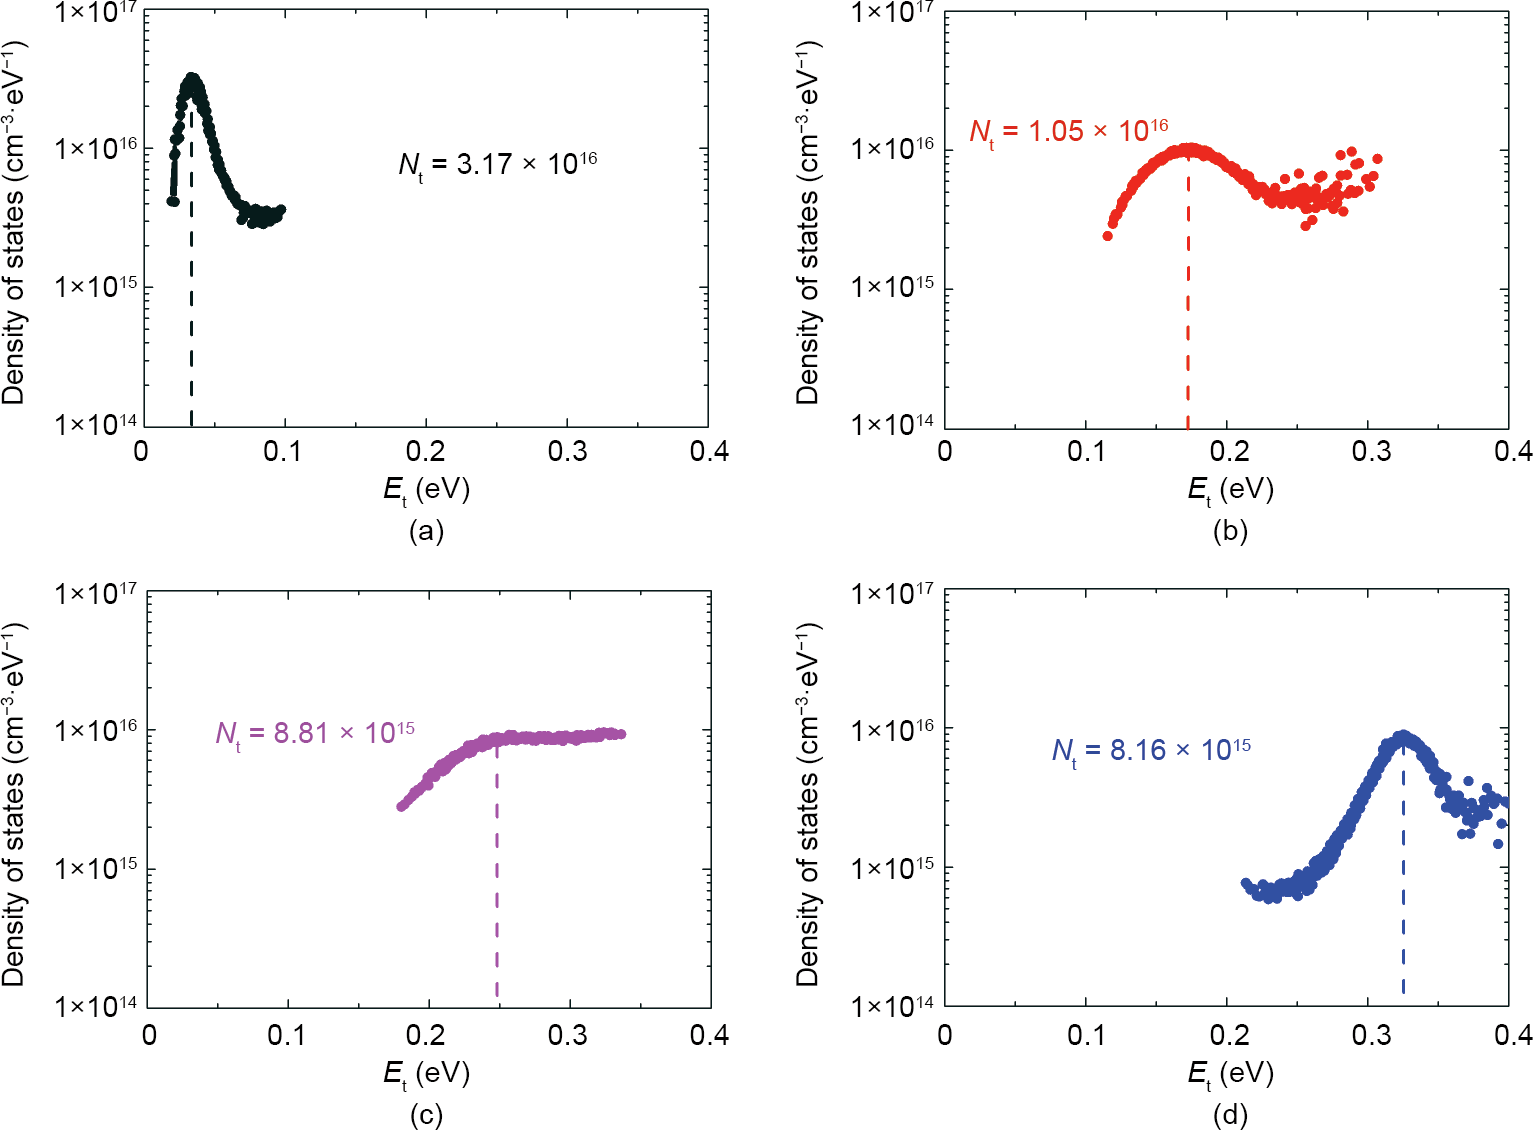
Fig. 10. Deduced density spectra derived from the admittance spectra for (a) Sample H, (b) Sample H-N, (c) Sample L, and (d) Sample L-N. Et is the corresponding defect energy level and Nt is the density of defect states.
《4. Conclusions》
4. Conclusions
This work examined the effect of the traditional single-heating Knudsen effusion cell on CIGS films with different growth rates. A comparison of samples with different growth rates showed that the quality of CIGS film is significantly influenced by the growth rate, with a higher rate often producing film with a large number of dark spots. Moreover, the dark spots appear to enhance the metal characteristic of the film due to the existence of some metal-like phase. Only increasing the temperature of the Se evaporator does not eliminate the dark spots, indicating that the Se flux is not responsible for the complete metal selenides. Considering the structure of the traditional single-heating Knudsen cell, serious heat loss is observed at the nozzle of the crucible, which is likely to be the reason for the formation of dark spots. Based on thermodynamic analysis, we designed a new single-heating Knudsen effusion cell that can compensate for the thermal loss at the nozzle of the crucible to prevent condensation. Eventually, using the new single-heating Knudsen effusion cell, we obtained the best solar cells with a conversion efficiency of 16.1% and 13.3% at growth rates of about 60 and 230 nm·min-1 , and a substrate temperature of 450 °C, respectively. In addition, the results of AS measurement show that the dark spots are related to N1 defects, where a large number of dark spots results in higher defect density and a lower defect level, which obviously deteriorates the device performance. We hope that this work will be helpful for the preparation of high-quality CIGS film by means of a low-cost single-heating Knudsen effusion cell.
《Acknowledgements》
Acknowledgements
The work was supported by the National Key R&D Program of China (2018YFB1500200), the National Natural Science Foundation of China (61774089 and 61974076), and the Natural Science Foundation of Tianjin (18JCZDJC31200).
《Compliance with ethics guidelines》
Compliance with ethics guidelines
Yunxiang Zhang, Shuping Lin, Shiqing Cheng, Zhichao He, Zhaojing Hu, Zhiqiang Zhou, Wei Liu, and Yun Sun declare that they have no conflict of interest or financial conflicts to disclose.
《Appendix A. Supplementary data》
Appendix A. Supplementary data
Supplementary data to this article can be found online at https://doi.org/10.1016/j.eng.2020.01.016.


 京公网安备 11010502051620号


