

《1. Introduction》
1. Introduction
Studies have indicated that changes in the intestinal microbiota may play an important role in the development of liver cirrhosis [1]. Furthermore, there is increasing evidence that the oral microbiome is overrepresented in the lower gastrointestinal (GI) tract in liver cirrhosis [2]. Microbial dysbiosis in the gut and oral cavity has been observed in several studies to have a close correlation with inflammation response and progression of cirrhosis [2–6]. However, the microbiota of the stomach, which links the oral cavity and gut, has not been well characterized in patients with liver cirrhosis. A better understanding of the gastric microbiota might provide a more complete picture of the complex microbiota in liver cirrhosis.
The human stomach has long been thought to be exclusively inhabited by Helicobacter pylori (H. pylori) due to the acidic conditions and other antimicrobial factors. With the development of high-throughput sequencing technology, the identification of gastric bacteria has increased dramatically. In addition to H. pylori, there is a characteristic microbiota present in the stomach.
The most prominent phyla of stomach bacteria have been reported to be Proteobacteria, Firmicutes, Actinobacteria, Bacteroidetes, and Fusobacteria [7,8]. Various evidence shows that the gastric microbiota plays a key role in the development and progression of gastric diseases [9,10]. In addition, gastric microbiota colonization is correlated with pathology, immune responses, and message RNA (mRNA) expression for pro-inflammatory and cancer-related genes [11]. Non-Helicobacter bacteria colonization in the stomach has also been implicated in diseases, such as gastric cancer and gastric polyp [12]. From superficial gastritis, atrophic gastritis, and intestinal metaplasia to intestinal-type gastric cancer, different gastric microbiota exists in different gastric diseases [10,13–15].
Gastric symptoms are common in cirrhosis. The pathophysiology is complex and may involve factors such as structure changes, psychological distress, increased gastric sensitivity to distension, and delayed gut transit [16–19]. Mucosa changes and varices are major endoscopic findings in liver cirrhosis [20]. Gastric mucosa changes in cirrhosis include chronic gastritis, erosive gastritis, and gastric ulcer [21]. Varices are most common in the esophagus and/ or the gastric fundus. Most patients with cirrhosis present with delayed gastric emptying or impaired small bowel transit [17]. Distinct pH, oxygen, nutrients, ions, and chemicals may present considerable variations in the gastric microenvironment of liver cirrhosis, which can preferentially support the colonization of specific bacterial strains. Gastric bacteria may also contribute to gastric symptoms by inducing mucosa inflammation.
The purpose of this study was to characterize the gastric mucosal microbiota in patients with liver cirrhosis and determine its association with gastric symptoms. Endoscopic normal individuals were used as controls. Pyrosequencing of 16S ribosomal RNA (rRNA) and cluster analysis were applied. Our results demonstrated that the H. pylori colonization rate was reduced in cirrhotic patients. In addition, the gastric mucosal microbiota of H. pylori-negative subjects showed considerable heterogeneity. A particular gastric microbial structure is associated with previous endoscopic variceal ligation (EVL) therapy and more severe GI symptoms.
《2. Methods》
2. Methods
《2.1. Patients》
2.1. Patients
Recruitment and sampling of patients and control groups were conducted at The First Affiliated Hospital, College of Medicine, Zhejiang University. The patient group included 29 patients with cirrhosis who were to undergo prearranged upper GI endoscopy in the hospital. The diagnosis of liver cirrhosis was based on the clinical and laboratory data supported by liver biopsy or ultrasonography. Of the cirrhotic patients, 24 (82.8%) were hepatitis B virusrelated, three (10.3%) had primary biliary cirrhosis, and two (6.9%) had alcoholic cirrhosis. We used the Child–Pugh score to evaluate the prognosis of liver cirrhosis. Child–Pugh grade A indicates well-compensated disease, grade B indicates functional compromise, and grade C indicates decompensated disease [22]. In the liver cirrhosis group, there were 25 Child–Pugh grade A (86.2%), three grade B (10.3%), and one grade C (3.4%). In addition, a total of 31 subjects undergoing gastric endoscopy for routine physical examination with basically normal endoscopic findings served as the controls. The patients with liver cirrhosis and the controls were matched for age and gender. Subjects were not recruited if they had received antibiotics or proton pump inhibitor (PPI) in the last two months. Before endoscopic examination, all the subjects were asked to rate their symptoms based on the patient assessment of gastrointestinal disorders symptom severity index (PAGI-SYM) questionnaire [23].
Written informed consent was obtained from all participants before they entered the study. The research followed the ethical guidelines of the 1975 Declaration of Helsinki. The research plan was approved by the Institutional Review Board of the First Affiliated Hospital, College of Medicine, Zhejiang University on 11 December 2013.
《2.2. Endoscopic sample collection》
2.2. Endoscopic sample collection
All endoscopy procedures were performed by the same gastroenterologist (Dr. Feng Ji). The endoscopic findings for the healthy controls were generally normal. A total of two biopsies were collected from the antrum of the stomach. One biopsy was used for histopathological analysis. Another biopsy sample, used for 16S rRNA pyrosequencing, was suspended in sterile halfstrength peptone water and stored at -80 °C for subsequent microbiological procedure.
《2.3. Mucosal DNA extraction》
2.3. Mucosal DNA extraction
Mucosal DNA extraction was conducted with the QIAamp DNA isolation kit (Qiagen, USA) in combination with a bead-beating method. To summarize, biopsies were incubated in 180 μL of Qiagen tissue lysis buffer ATL buffer with 20 μL of proteinase K for 1 h at 56 °C. Glass beads of different diameters (0.1, 0.5, and 1.0 mm; Sigma, USA) were then added to the mixture. After that, a FastPrep FP120 bead beater (Bio 101, USA) was applied for sample homogenization for 30 s at 4 m·s-1 . Next, the mixture was incubated for an additional hour at 56 °C. The lysate was then added into 4 mL of RNase A (100 mg·mL-1 ) and 200 μL of Qiagen lysis buffer AL, and incubated for 30 min at a temperature of 70 °C. Purification of the lysates was performed over a QIAamp column, as specified by the manufacturer, after the addition of 200 μL absolute ethanol. A total of 200 μL of Qiagen elution buffer AE was used for elution.
《2.4. 16S rRNA pyrosequencing》
2.4. 16S rRNA pyrosequencing
16S rRNA gene (V1-3 region) was amplified with universal polymerase chain reaction (PCR) primer sets (27F 5' -AGAGTTT GATCCTGGCTCAG-3' , 533R 5' -TTACCGCGGCTGCTGGCAC-3' ) as described previously [24]. Pyrosequencing of 16S rRNA gene was performed on a 454 Genome Sequencer FLX Titanium system using standard software tools from Roche/454 (Switzerland).
《2.5. Bioinformatics and statistics》
2.5. Bioinformatics and statistics
The quantitative insights into microbial ecology (QIIME) pipeline (1.7.0) was used to process and compare 16S rRNA reads [25]. A minimum read length of 200 base pairs (bp) with an average quality score of 25 was applied to trim raw reads. More than two mismatches were not allowed along the primer sequences. The upper limitation of homopolymers’ authorized number in sequences was set to 6. The number of high-quality sequences generated was 484 105, with an average of 8068 reads per sample (ranging from 5491 to 13 957). The average sequence length was 464 bp. To normalize sequencing depth, α/β diversity, and taxa, a comparison was performed with a subset of 5491 reads picked randomly from each sample. The similarity threshold was set to 97% in order to generate operational taxonomic unit (OTU). OTUs with the most abundant sequences were selected as representative reads. The Greengenes database (gg_13_8_otus) was used for the taxonomy assignments of representative reads. USEARCH was performed for chimera identification [26]. The R package Phyloseq was used to analyze QIIME results [27]. Functional gene content predictions were based on phylogenetic investigation of communities by reconstruction of unobserved states (PICRUSt) [28].
The significance test of diversity and clinical parameters between patients with liver cirrhosis and the controls was based on a two-sided Student’s t-test. To identify the bacterial taxa, functional modules, and clinical characteristics differentially represented among the four non-H. pylori clusters, one-way analysis of variance (ANOVA) and Tukey’s test or the chi-square test were applied. Student’s t-test, ANOVA, and the chi-square test were conducted in R with the ‘‘mixOmics,” ‘‘plyr,” and ‘‘reshape2” packages.
《3. Results》
3. Results
《3.1. Clinical characteristics and endoscopic findings》
3.1. Clinical characteristics and endoscopic findings
A total of 60 subjects were included in this study. The characteristics of the 31 controls and 29 cirrhotic patients are summarized in Table 1. There were significantly higher PAGI-SYM scores in patients with liver cirrhosis than in the controls (6.7 ± 4.8 vs 3.2 ± 2.7, p = 0.001). Clinical characteristics (age, body mass index, and gender) were generally matched across the disease and control groups.
Endoscopic findings in the 29 patients with liver cirrhosis are summarized in Table S1 in Appendix A. Esophageal or gastric fundus varices were observed in all the cirrhotic patients. The gravity of the varices was estimated as described previously [29]. There were 15 patients (51.7%) with portal hypertensive gastropathy, according to the New Italian Endoscopy Club criteria. Three patients (10.3%) had gastroduodenal ulcers (two gastric ulcers and one duodenal ulcer). Four patients (13.8%) had erosive gastritis. Two patients (6.9%) had atrophic gastritis. The endoscopic findings in the 31 controls were generally normal.
《3.2. Cirrhosis is associated with lower H. pylori infection in the stomach》
3.2. Cirrhosis is associated with lower H. pylori infection in the stomach
H. pylori were histologically identified in 32.3% (10/31) of the control subjects, but in only 6.9% (2/29) of the cirrhotic patients. Patients with liver cirrhosis had significantly lower H. pylori infection rates (p = 0.03) (Table 1). Analysis of microbial profiling based on 16S rRNA gene sequences also revealed significant differences in the relative abundance of Helicobacter genus between the H. pylori-positive subjects and the H. pylori-negative subjects. The average percentage of Helicobacter genus reads in the H. pylori-positive samples was 97.1% of all sequences (range 90.1%–99.9%), and that in H. pylori-negative subjects was 0.7% of all sequences (range 0–8.5%) (see Table S2 in Appendix A). There was a significant reduction of bacterial richness between H. pylori-positive and -negative gastric microbiota, as estimated by observed OTUs (76 ± 45 in H. pylori-positive controls vs 203 ± 35 in H. pylori-negative controls, p < 0.001), and of diversity, as estimated by the Shannon index (0.37 ± 0.01 in H. pylori-positive controls vs 3.50 ± 0.47 in H. pylori-negative controls, p < 0.001) (Table 1).
《Table 1》
Table 1 Clinical characteristics and α diversity of subjects in research.
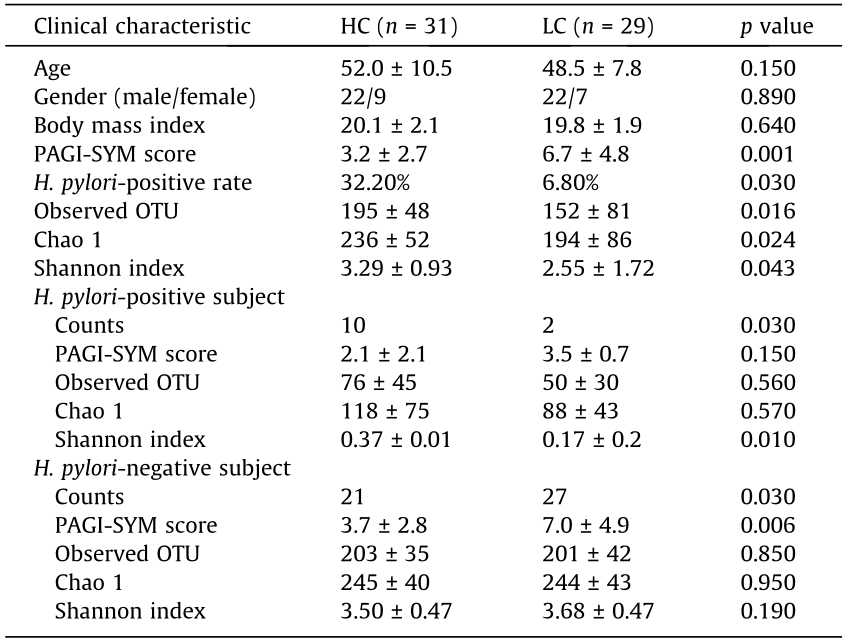
HC: healthy control; LC: liver cirrhosis.
《3.3. Four clusters identified for H. pylori-negative gastric microbiota》
3.3. Four clusters identified for H. pylori-negative gastric microbiota
H. pylori-infected samples were dominated by H. pylori reads. To better characterize the alterations of gastric non-H. pylori bacteria in cirrhosis, we further analyzed the H. pylori-negative samples. Microbial communities of gastric mucosa in patients with liver cirrhosis and the controls showed Bray–Curtis similarity (Fig. S1 in Appendix A). Next, another kind of exploratory and unsupervised data analysis approach known as clustering was applied to explore whether there was natural grouping for this gastric microbiota. To identify the optimal number of clusters, the partitioning around medoids method was applied using the Jensen–Shannon distance with the OTU-level relative abundance profile. A silhouette index was observed for four clusters of 1.83, indicating strong support for four clusters. Between class analyze indicated that the four clusters showed clear separation from each other (Fig. 1(a)). The highest Calinski–Harabasz value was observed for four clusters, which also provided evidence for four clusters as the optimal cluster number (Fig. 1(b)). When comparing the microbial diversities, no significant difference was observed among the four clusters (Table 2).
《Fig. 1》

Fig. 1. Four clusters were observed in non-H. pylori gastric microbiota. (a) Principal coordinate analysis of the Jensen–Shannon distance obtained from the OTU-level relative abundance profiles. Samples are colored according to clusters identified by the partitioning around medoids clustering algorithm (blue: Cluster_1; red: Cluster_2; black: Cluster_3; green: Cluster_4). (b) Four clusters were supported with the highest Calinski–Harabasz (CH) pseudo F-statistic value, as the optimal number of clusters.
Among the 48 H. pylori-negative patients in the research, 10 subjects (21%) were clustered as Cluster_1, 10 (21%) as Cluster_2, and 15 (31%) as Cluster_3, while the remaining 13 (27%) fell into Cluster_4. The clinical characteristics of the individuals in each cluster are summarized in Table 2. Although there were cirrhotic patients and controls in each cluster, the ratio of cirrhosis was different. Cluster_1 (80%) and Cluster_2 (80%) had a significantly higher rate of cirrhotic patients, while Cluster_3 (20%) had a significantly higher ratio of controls (p = 0.02). The severity of upper GI tract symptoms was compared among the clusters by means of the PAGI-SYM score. Patients in Cluster_2 (9.6 ± 4.6) showed the highest PAGI-SYM score, followed by those in Cluster_1 (6.1 ± 4.0), Cluster_4 (4.9 ± 3.8), and Cluster_3 (3.0 ± 2.9) (p = 0.001). Moreover, there was a tendency of higher ratio of patients who underwent previous EVL therapy for gastric varices bleeding in Cluster_2 (62.5%) than in Cluster_1 (25.0%), although the difference was not statistically significant (p = 0.18). Previous variceal bleeding, the presence of varices, the severity of cirrhosis expressed using the Child–Pugh score, the use of propranolol, and the presence of portal hypertensive gastropathy were comparable among the patients of each cluster.
《Table 2》
Table 2 Clinical characteristics and α diversity comparison among four H. pylori-negative gastric microbial clusters.

Different letters (H, L, HL) indicate statistical difference at p < 0.05 among groups by one-way ANOVA and Tukey’s test. H: the highest value among groups; L: the lowest value among groups; HL: no significant difference between neither the highest nor the lowest group.
a Gravity of varices 3/2/1 indicate the severity of varices was diagnosed as severe, moderate or mild according to the New Italian Endoscopy Club criteria.
《3.4. Compositional analysis of non-H. pylori gastric microbial clusters》
3.4. Compositional analysis of non-H. pylori gastric microbial clusters
Significant differences were compared among the taxa displaying > 1% relative abundance in the whole dataset to identify signature taxa (Fig. 2). Major differences were observed among four clusters. At the phylum level (Fig. 2(a)), a significantly lower relative abundance of phylum Bacteroidetes was observed in Cluster_2 than in Cluster_3 and Cluster_4 (p = 0.0007). Cluster_1 was characterized by a significantly higher relative abundance of Proteobacteria than other clusters (p = 0.00002). Firmicutes showed a higher level in Cluster_2, a lower level in Cluster_1, and a middle level in Cluster_3 and Cluster_4 (p = 0.015). The relative abundance of Actinobacteria was significantly greater in Cluster_4 than in Cluster_1 (p = 0.002).
At the class level (Fig. 2(b)), Cluster_2 had a significantly lower ratio of Bacteroidia than Cluster_3 and Cluster_4 (p = 0.0002). Class Bacilli showed the greatest relative abundance in Cluster_2 in comparison with the other clusters (p = 1 × 10⁻⁷ ). Cluster_1 had the highest level of Betaproteobacteria in comparison with the other clusters (p = 1 × 10⁻⁶ ). The level of Alphaproteobacteria was found to be obviously higher in Cluster_2 than in other clusters (p = 1 × 10⁻⁵ ).
At the genus level (Fig. 2(c)), Neisseria was responsible for the enrichment of Betaproteobacteria in Cluster_1 in comparison with the other clusters (p = 1 × 10⁻⁵ ). Streptococcus from the bacterial class Bacilli was found to have the highest ratio in Cluster_2 among the four clusters (p = 1 × 10⁻⁸ ). The relative abundance of Prevotella was significantly greater in Cluster_4 than in Cluster_1 and Cluster_2 (p = 0.002). Fusobacterium from class Fusobacteria was found to be obviously enriched in Cluster_1 in comparison with Cluster_2 and Cluster_4 (p = 0.002).
《Fig. 2》
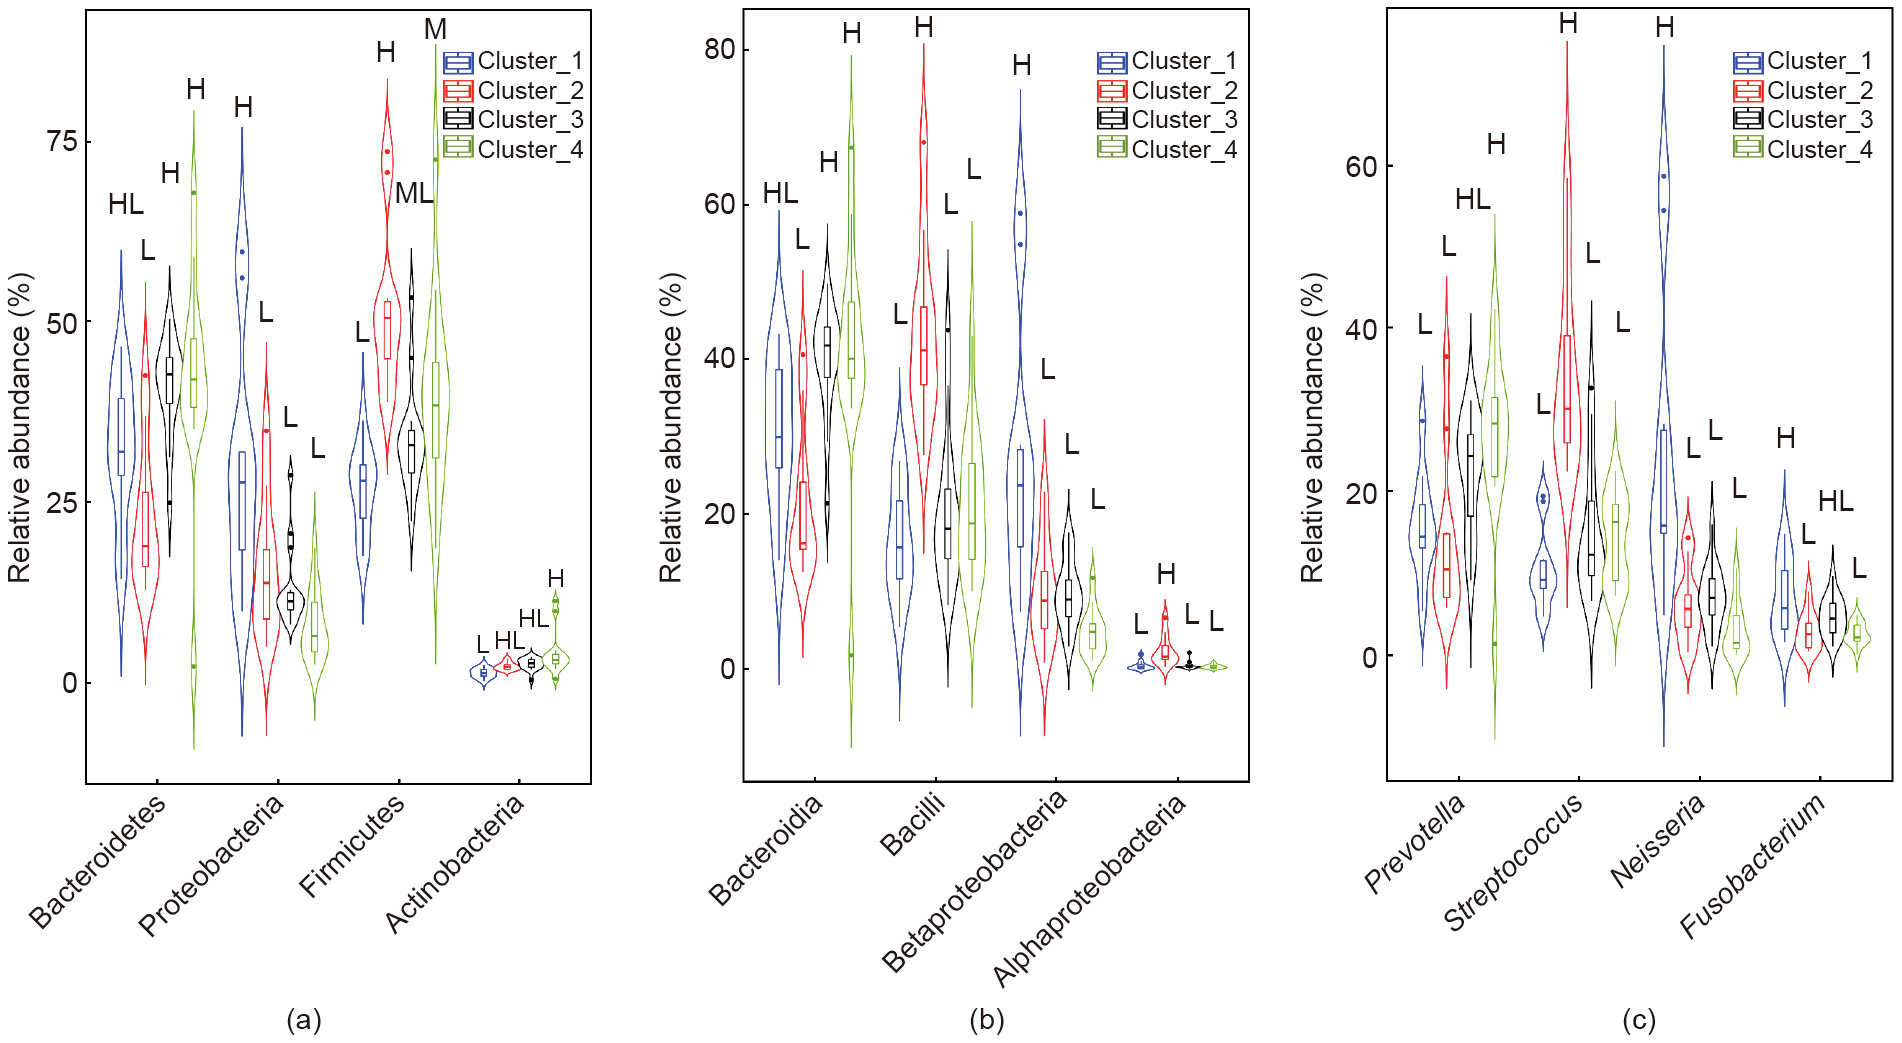
Fig. 2. The relative abundance of bacterial taxa with a significant difference among clusters. (a) Phylum level; (b) class level; (c) genus level. Data are visualized with a violin plot, in which the line in the middle is the median value and the box represents the interquartile range. The thin line extending from the box represents the upper (max) and lower (min) adjacent values in the data. Plots with different colors indicate different clusters. M: the middle level among groups, which means significantly higher than the lowest and significantly lower than the highest; ML: no significant difference between neither the highest nor the middle group.
《3.5. Function gene profiles of non-H. pylori microbial clusters》
3.5. Function gene profiles of non-H. pylori microbial clusters
To generate a functional potential profile of the gastric microbiota, PICRUSt analysis was used to obtain the prediction profiles of the Kyoto Encyclopedia of Genes and Genomes (KEGG) modules. A comparison of the functional modules among the non-H. pylori microbial clusters was done (Fig. 3). When comparing the level 1 KEGG pathway (Fig. 3(a)), genetic information processing was found to be significantly lower in Cluster_2 than in the other three clusters (p = 1 × 10⁻⁴ ). At KEGG pathway level 2 and level 3, several pathways involving genetic information processing contributed to the decline, including ribosomes and ribosome biogenesis from translation, and the pathway of folding, sorting, and degradation (Fig. 3(b)). Module folding, sorting, and degradation showed the lowest relative abundance in Cluster_2 in comparison with the other clusters (p = 0.0005). Module ribosomes from pathway translation showed a significantly lower ratio in Cluster_2 than in Cluster_1 and Cluster_3 (p = 0.006). Another module ribosome biogenesis from pathway translation was found to be significantly lower in Cluster_2 than in Cluster_3 and Cluster_4 (p = 0.001). The relative abundance of amino sugar and nucleotide sugar was found to be significantly lower in Cluster_1 in comparison with Cluster_3 and Cluster_4, while the level in Cluster_2 was in the middle (p = 0.001). Cluster_2 had the lowest level of module glycan biosynthesis and metabolism in comparison with the other clusters (p = 0.0005).
《Fig. 3》

Fig. 3. Relative abundance of functional modules with significant difference among clusters. (a) Level 1; (b) levels 2 and 3. Data are visualized with a violin plot, in which the line in the middle is the median value and the box represents the interquartile range. The thin line extending from the box represents the upper (max) and lower (min) adjacent values in the data. Plots with different colors indicate different clusters.
《4. Discussion》
4. Discussion
The gut microbiota plays an important role in complications of liver cirrhosis. However, most previous investigations have focused on the fecal microbiota. Our study is the first to characterize the gastric mucosal microbiota in cirrhotic patients. The H. pylori infection rate was significantly lower in patients with cirrhosis than in the controls. In H. pylori-negative patients, the gastric microbiota were clustered into four distinct clusters: Cluster_1 and Cluster_2 (mostly cirrhosis), Cluster_3 (mostly healthy), and Cluster_4 (around half of each). Significant compositional and functional differences were observed among these microbial clusters, especially in Cluster_2. In terms of clinical characteristics, most of the cirrhotic patients from Cluster_2 had previous EVL therapy and severe upper GI symptoms, indicating a potential link between gastric microbiota, EVL, and gastric symptoms in cirrhosis.
H. pylori are the most-studied bacterium in the stomach. This study showed that cirrhotic patients had lower H. pylori infection rates. Recently, Chang and Hu [30] reported that decompensated cirrhosis and compensated cirrhosis patients with peptic ulcers had a lower H. pylori infection rate than non-cirrhosis patients in the Taiwan population. In line with the work of Chang and Hu, the results in the current study reconfirm that H. pylori is not the predominant etiology for gastroduodenal lesions in patients with liver cirrhosis [31]. The mechanism by which cirrhosis leads to a decrease in gastric H. pylori colonization is unclear. Several possible reasons might be involved. First, in patients with liver cirrhosis, gastric pH has been found to be higher than in controls, with a larger proportion of cirrhotic patients showing hypochlorhydria [32]. Second, for patients with liver cirrhosis, the frequency of gastric atrophy and intestinal metaplasia has been shown to be higher than that of the control group [33]. The development of atrophic gastritis would diminish or eliminate H. pylori colonization [34]. Patients with liver cirrhosis are often given antacids for symptoms such as nausea, vomiting, and GI hemorrhage. The low prevalence of H. pylori in cirrhosis could also be attributed to frequent PPI medication. These results are in line with a recent study that investigated the effects of PPI on the GI microbiota of healthy dogs, and revealed a decrease in Helicobacter spp. in the stomach during omeprazole administration [35]. The presence of H. pylori in the gastric mucosa has long been associated with gastric diseases, including peptic ulcers, gastric carcinoma, and gastric mucosaassociated lymphoid tissue (MALT) lymphoma [36]. However, some recent data is suggestive of a protective effect of H. pylori against autoimmune and allergic diseases [37]. If a decline in H. pylori participates in the complications of liver cirrhosis, this should be elucidated in future studies.
The composition of the gastric microbiota is affected by multiple factors such as dietary habits, medication use, inflammation of the gastric mucosa, disease, and genetic backgrounds [38]. For H. pylori-negative individuals, not many characteristic differences could be observed from direct comparison of patients with cirrhosis and the controls (Fig. S1). The results might indicate that liver cirrhosis itself was not the major shaper of the gastric microbiota. The gastric microbiota of all the non-H. pylori subjects was then clustered into four clusters based on the microbial composition. Cluster_1 and Cluster_2 had significantly more patients with liver cirrhosis, which suggests a disease-related microbial status.
Cirrhosis is often accompanied by GI symptoms. The potential pathophysiology involves factors related to the severity of liver disease, gut dysfunction (e.g., increased gastric sensitivity to distension and delayed gut transit), and psychological distress [39]. PAGI-SYM has been widely used to evaluate GI symptoms in diseases [23]. The average PAGI-SYM score was significantly higher in patients with liver cirrhosis than in the controls in this research. In particular, patients in Cluster_2 had the most severe upper GI symptoms in comparison with the other clusters, as estimated by the PAGI-SYM score. Taxonomically, Cluster_2 was characterized by a relative decline of Bacteroidia with enrichment of Bacilli. The correlations between GI symptoms and gastric microbiota have recently been characterized. Han et al. [40] reported that the relative abundance of H. pylori in the stomach was closely associated with histological and endoscopic gastritis, but had no significant relation to symptomatic gastritis. The PAGI-SYM scores were positively correlated with the relative abundance of the species Corynebacterium segmentosum, Prevotella nanceiensis, Neisseria enlongata, Pantoea sp., and Actinobacillus parahaemolyticus, but negatively correlated with the relative abundance of the species Prevotella pallens, Propionibacterium acnes, and Staphylococcus epidermidis [40]. Recently, Fukui et al. [41] found that Streptococcus was significantly increased in the upper gut in functional dyspnea. Furthermore, the relative abundance of Streptococcus was positively correlated with upper GI symptoms. The microbiota might alter the symptom sensitivity via the neurogenic inflammatory process and enteric nervous system modulation [42]. Although there are few studies exploring the associations between gastric microbiota and GI symptoms, there is mounting interest in bidirectional interactions within the brain–gut–microbiome (BGM) axis [43]. Alterations in the BGM axis have been implicated not only in functional intestinal disorders such as irritable bowel syndrome [44], but also in psychiatric and neurologic disorders with GI comorbidities [45]. The findings of correlations between GI symptoms and the gastric mucosal microbiota should be part of the BGM axis, and need further study.
Variceal hemorrhage is one of the most common complications in liver cirrhosis. At present, EVL is the most widely used invasive procedure in patients with cirrhosis. It is not only the first choice for acute episodes of variceal hemorrhage, but also the first choice for secondary prophylaxis [46]. The influence of EVL on the gut microbiota has not been systematically assessed before. EVL has been associated with multiple adverse events, including dysphagia, esophageal ulceration, retrosternal pain, odynophagia, heartburn, throat pain, and fever [47]. Dysmotility of the upper GI tract has been observed in patients after EVL [48]. Both Cluster_1 and Cluster_2 showed a relatively higher ratio of cirrhosis patients. However, in comparison with Cluster_1, more patients in Cluster_2 had undergone previous EVL. Our results suggest that EVL induces an increase of genus Streptococcus in the stomach. There have been concerns regarding the risk of bacterial infection after EVL, although the data has been limited. Patients receiving invasive treatment have shown higher infectious rates caused by grampositive cocci [49]. Streptococcus is one of the leading causes of infections in patients with cirrhosis. Previous research has found more abundant Streptococcus in the fecal samples of cirrhosis patients [6]. Streptococcus mitis and Staphylococcus epidermidis were isolated in two blood samples of patients who subsequently received EVL, although no bacterial infection developed [50]. Streptococcus belongs to the normal oral microbiota that can cause dental and periodontal infections. Our results here suggest that EVL might add the risk of bacteria translocation from the oral cavity to the stomach.
In our research, functional analysis of the microbiome revealed interesting variations of gene abundance in clusters. We found a significantly lower abundance of the genes involved in glycan biosynthesis and metabolism and genetic information processing in Cluster_2 than in the other three clusters. The symbiotic microbes that inhabit the human gut are specialized at foraging polysaccharides and glycans, including the endogenous glycans secreted by the host mucus and dietary glycans [51]. For the gastric mucus microbiota, endogenous glycans provide a major source of nutrients. Due to the chemical diversity of endogenous polysaccharides, mucosal microbes produce a variety of different degradative enzymes in order to make use of these heterogeneous polymers [51]. From an ecological perspective, the decline of glycan biosynthesis and metabolism genes in Cluster_2 might indicate that the microbiota is not a stable community as a result of long evolution. Invasive operations, such as EVL, disturb the microbiota and introduce microbes from upstream locations, such as the oral cavity. Bacteria live in a constantly changing environment. In order to adapt quickly, they have evolved a wide range of mechanisms to regulate every cellular process from transcription initiation to protein inactivation and degradation [52]. A bioinformatics analysis using PICRUSt has shown that a harsh environment, such as heavy metal exposure, had a strong effect on the enriched functions of environmental and genetic information processing [53]. The relatively lower abundance of function genes related to genetic information processing in Cluster_2 also confirmed that the microbiota was not comprised of the original members that had adapted to the harsh environment.
Nevertheless, the present study still has some limitations. First, most of the people who visited the clinic had upper GI complaints. Although the healthy controls had basically normal endoscopic results, they may not be strictly normal. Second, the composition of the gastric microbiota might have been affected by other factors as well, such as dietary habitats and medication [38]. The dietary habitat was not recorded and compared here. We tried to reduce the effects of medication by excluding patients who had taken PPIs, antibiotics, and probiotics in the four weeks prior to sampling. However, in the long run, people with cirrhosis are more likely to take drugs, which might affect the microbiota. Future studies with a large sample size are warranted to evaluate the influences of these factors. Third, the PICRUSt-based prediction of the functional gene does not provide real metagenomic results. In the future, metagenomic analysis with shotgun pyrosequencing should be applied. In addition, the results of this study were not sufficient to explore the potential role of H. pylori in liver cirrhosis. Further studies with a larger sample size are necessary in order to clarify the specific mechanism.
In conclusion, this study characterized the gastric mucosal microbiota in patients with cirrhosis in comparison with healthy controls. Colonization of H. pylori in the gastric microbiota was less prevalent in patients with cirrhosis than in the controls. For H. pylori-negative individuals, not many characteristic differences could be observed in a direct comparison of those with cirrhosis and the controls. However, the gastric microbiota of H. pylori-negative subjects could be clustered into four microbial clusters, of which two clusters (Cluster_1 and Cluster_2) had a significantly higher ratio of patients with cirrhosis. Cluster_2, which had the most obvious differences in structure and functional profile, had relatively more patients who had experienced EVL and who showed severe GI symptoms. Our research suggests a potential link between the gastric microbiota, upper GI symptoms, and invasive therapy such as EVL in cirrhosis. Further studies with a large cohort to confirm the relationships between the gastric microbiota, invasive treatment, and symptoms are warranted. In addition, specific mechanisms and microbial-targeted therapy to relieve gastric symptoms need to be explored.
《Acknowledgements》
Acknowledgements
This work was supported by the National Natural Science Foundation of China (81790631), and Zhejiang Provincial Natural Science Foundation of China (LY15H030012).
《Compliance with ethics guidelines》
Compliance with ethics guidelines
Yanfei Chen, Jing Guo, Chunlei Chen, Ding Shi, Daiqiong Fang, Feng Ji, and Lanjuan Li declare that they have no conflict of interest or financial conflicts to disclose.
《Appendix A. Supplementary data》
Appendix A. Supplementary data
Supplementary data to this article can be found online at https://doi.org/10.1016/j.eng.2020.04.014.


 京公网安备 11010502051620号


