

《1. Introduction》
1. Introduction
Fault-induced coal burst is a phenomenon that involves a violent energy release at the coalmine scale due to a sudden fault slip caused by coal exploitation activities [1]. This sudden fault slip, also known as fault reactivation, is the key element in the initiation of fault-induced coal burst. For example, a coal burst accident (equivalent to moment magnitude scale (Mw) 4.1) was induced by a large F16 thrust fault reactivation at 7:18 p.m. local time on 3 November 2011 at Yima Qianqiu Coal Mine, causing ten deaths and trapping 75 miners [2]. Another destructive coal burst accident (equivalent to Mw 1.9) occurred at the same mine at 11:18 a.m. local time on 27 March 2014 [3], causing six deaths and trapping 13 miners. It was officially announced that fault reactivation was the main inducing factor of this accident. In addition, multiple strong coal bursts were reported in the No. 25110 longwall panel of the Yima Yuejin Coal Mine when the face was approaching the F16 thrust fault [4,5]. In this context, if the mechanism of fault reactivation induced by coal mining activities could be clearly understood in advance, the fault-induced coal burst mechanism could then be revealed. Furthermore, data-driven yet physicsbased monitoring methodologies could be developed to accurately forecast the occurrence of fault-induced coal burst, allowing reasonable prevention and emergency-response measures to be taken immediately to ensure the safety of miners.
Regarding the mechanism of fault reactivation and its induced coal burst, various findings have been reported from in situ observations, theoretical analyses, numerical modeling, and experimental investigations. These investigations mainly focus on two key problems: How mining activities cause fault reactivation and, in turn, how fault reactivation affects stress distribution around mines.
The in situ observations and theoretical analyses revealed that the risk of coal burst increases when a working face approaches a fault [6]. Qi et al. [7] proposed a stick–slip instability theory to explain coal burst initiation, which considered that the existence of the thin-soft layer between the strata and the weak surface of the fault was the main structural factor inducing coal burst. Pan [1] summarized a disturbance response criterion of fault-induced coal burst, which revealed that fault reactivation could be induced by either decreasing normal stress or increasing shear stress. Li [8] categorized fault reactivation into two kinds—namely, stable and unstable—from the viewpoint of catastrophe theory, combined with the stick–slip model and the viscoelastic brittle block model. Li et al. [5] divided fault-induced coal burst into three types by introducing the new fault pillar concept (where a fault pillar is a coal pillar between the mining space and the fault): The three suggested types of coal burst were fault-slip-induced, pillar-failureinduced, and those induced by their interaction. It was also inferred that a high static stress concentration would be generated in a fault pillar structure under the action of voussoir beams [9].
In terms of physical similar-material modeling and numerical modeling, Zuo et al. [10] used theodolite in a physical similarmaterial model to monitor the horizontal displacements from fault movements, which verified the phenomenon of fault slip under mining disturbance. Kong et al. [11], Ji et al. [12], and Li [8] investigated the effects of different mining layouts on fault reactivation. They found that the disturbance effect of mining activities operating parallel to the fault strike was less than the effect of activities operating perpendicular to the fault strike. They also found that the effect was less in the hanging wall than in the footwall of the fault. Jiang et al. [13] investigated the evolution characteristics of mining-induced stresses around a fault and found that the fault played a role in breaking the continuity of the strata and thereby acted as a stress barrier, which led to a low stress in the roof and a high stress concentration in the floor. In addition, Zhang [14] and Li et al. [15] found that, with a decrease in the distance from the working face to a fault, the peak location of the abutment stress shifted forward and the fault was more easily reactivated. After passing through the fault, the abutment stress decreased and gradually returned to a normal state. Jiang et al. [16] and Zhu et al. [17] studied fault stress evolution under mining disturbances and found that, as mining activities approached a fault, the normal stress and shear stress of the fault dramatically increased, and the likelihood of fault reactivation increased. In turn, unstable dynamic loading or loading–unloading wave stress generated from fault reactivation will propagate in the coal seam across the mining area, which might eventually result in the occurrence of coal burst. Luo et al. [18] carried out numerical modeling and physical similarmaterial modeling in an attempt to elucidate the mechanism of coal burst induced by the Yima F16 thrust fault. They found that, prior to fault reactivation, a high stress concentration formed in the fault pillar due to mining-induced overburden strata movement. When the fault reactivation was initiated, a fault-induced coal burst was triggered under the coupled effect of the instability of the overburden structure, the fault stress changes, and the fault reactivation. Islam and Shinjo [19] adopted boundary element method (BEM) numerical modeling to investigate mininginduced fault reactivation in the Barapukuria Coal Mine in Bangladesh. They found that mining-induced stresses caused significant deformation around faults, and that higher stresses developed near the tips of the faults. Sainoki and Mitri [20,21] investigated the effects of fault surface asperities on the seismic waves arising from the fault reactivation using a mine-wide numerical model and dynamic analyses.
With respect to physical mechanics experimental investigations, Brace and Byerlee [22] first presented the stick–slip as a mechanism for earthquakes. It was found that the fault slip was no longer a stable slip but an unstable slip along with the stress drop. Song et al. [23] carried out direct shear tests by biaxial loading and concluded that a certain lateral stress was required for the occurrence of fault-induced coal burst. Cui et al. [24] investigated the effect of a lateral stress wave on fault reactivation and found that a small perturbation from the lateral stress could cause an ultra-low friction phenomenon and trigger a large stress drop.
In summary, the phenomenon of mining-induced fault reactivation has been verified through theoretical analyses, in situ observations, and ex situ numerical modeling and experiments. The results of fault stress evolutions under mining disturbances and the mining-induced stress characteristics around a fault, as investigated by numerical modeling and physical similar-material modeling, have well illustrated the fault-induced coal burst mechanism as being dominated by mining-induced static stress. However, few studies can be found that consider the effect of mininginduced seismic-based dynamic stress on fault reactivation. Moreover, most physical mechanics experimental investigations into fault reactivation only focus on illustrating the earthquake mechanism, which ignores the effects of the true mining-induced quasistatic loading–unloading stress path and the seismic-based dynamic stress on fault reactivation. Therefore, it is still necessary to further study the coal burst mechanism triggered by fault reactivation under mining-induced static and dynamic stresses, which is the theoretical basis for the monitoring and prevention of fault-induced coal burst.
In this paper, the relationships between coal mining layouts and fault occurrences are first investigated; next, two kinds of fault reactivations from mining-induced static stress (FRMSS)- dominated and seismic-based dynamic stress (FRSDS)-dominated are summarized. Subsequently, the mechanisms of these two kinds of fault reactivations and their induced coal burst are demonstrated utilizing theoretical analysis and numerical simulation. Finally, the fault-induced coal burst mechanism is validated by the results of experimental investigations, numerical modeling, and in situ microseismic monitoring. Accordingly, monitoring methods and prevention strategies for fault-induced coal burst are discussed and recommended.
《2. Mechanism of fault reactivation and its induced coal burst》
2. Mechanism of fault reactivation and its induced coal burst
《2.1. Conceptual models of fault reactivation》
2.1. Conceptual models of fault reactivation
A fault is a common geological structure that may be revealed in the process of underground coal excavation and mining. The nature of its discontinuous structure controls the deformation, damage, and mechanics of the coal or rock mass. The interaction between this discontinuous structure and coal mining activities is the key factor dominating fault reactivation. According to in situ investigations, four conceptual models for fault reactivation induced by underground coal mining activities can be summarized, as shown in Fig. 1:
(1) In Fig. 1(a), the mining activities are far away from the fault and there is no interaction between fault stress and abutment stress. In this case, fault reactivation is unlikely to be initiated. Nevertheless, the possibility cannot be excluded that local deformation and transient slip of the fault could be triggered by far-field mining-induced seismicity, given that the fault may be critically stressed during long geological tectonic activity.
(2) In Fig. 1(b), the mining activities are approaching the fault. The superposition of fault stress and abutment stress forms a high static stress concentration in the fault pillar. At the same time, with decreasing distance from the mining face, the abutment stress in the vertical direction (the main contribution to the fault shear stress) increases gradually to a peak stress and then decreases dramatically due to coal mass damage near the face. In the horizontal direction (the main contribution to the fault normal stress), the abutment stress decreases gradually to nearly zero from the hydrostatic stress state [25]. This will inevitably change the local stress state of the fault and then trigger an FRMSS-dominated fault reactivation.
(3) In Fig. 1(c), the mining activities are shifting away from the fault. When the fault pillar is wide enough, there will be no interaction between the fault stress and the abutment stress, which may be similar to the situation in Fig. 1(a). Otherwise, the overlying roof will bend and sink as the coal seam is mined out. In the latter case, the abutment stress in the fault pillar will completely unload in the horizontal direction and gradually load in the vertical direction, which may easily trigger an FRMSS-dominated fault reactivation.
(4) In Fig. 1(d), the mining activities are shifting in a direction parallel to the fault. When the fault pillar is wide enough, there will be no interaction between the fault stress and the abutment stress, which may be equivalent to the situation in Fig. 1(a). Otherwise, the superposition of the fault stress and the abutment stress will form a high static stress concentration in the fault pillar. However, the disturbance effect of the abutment stress is limited and may not even change, especially during the drivage. In this case, fault reactivation would need to be triggered by an extra driving force, such as mining-induced seismicity. Thus, this would be an FRSDS-dominated fault reactivation.
《Fig. 1》
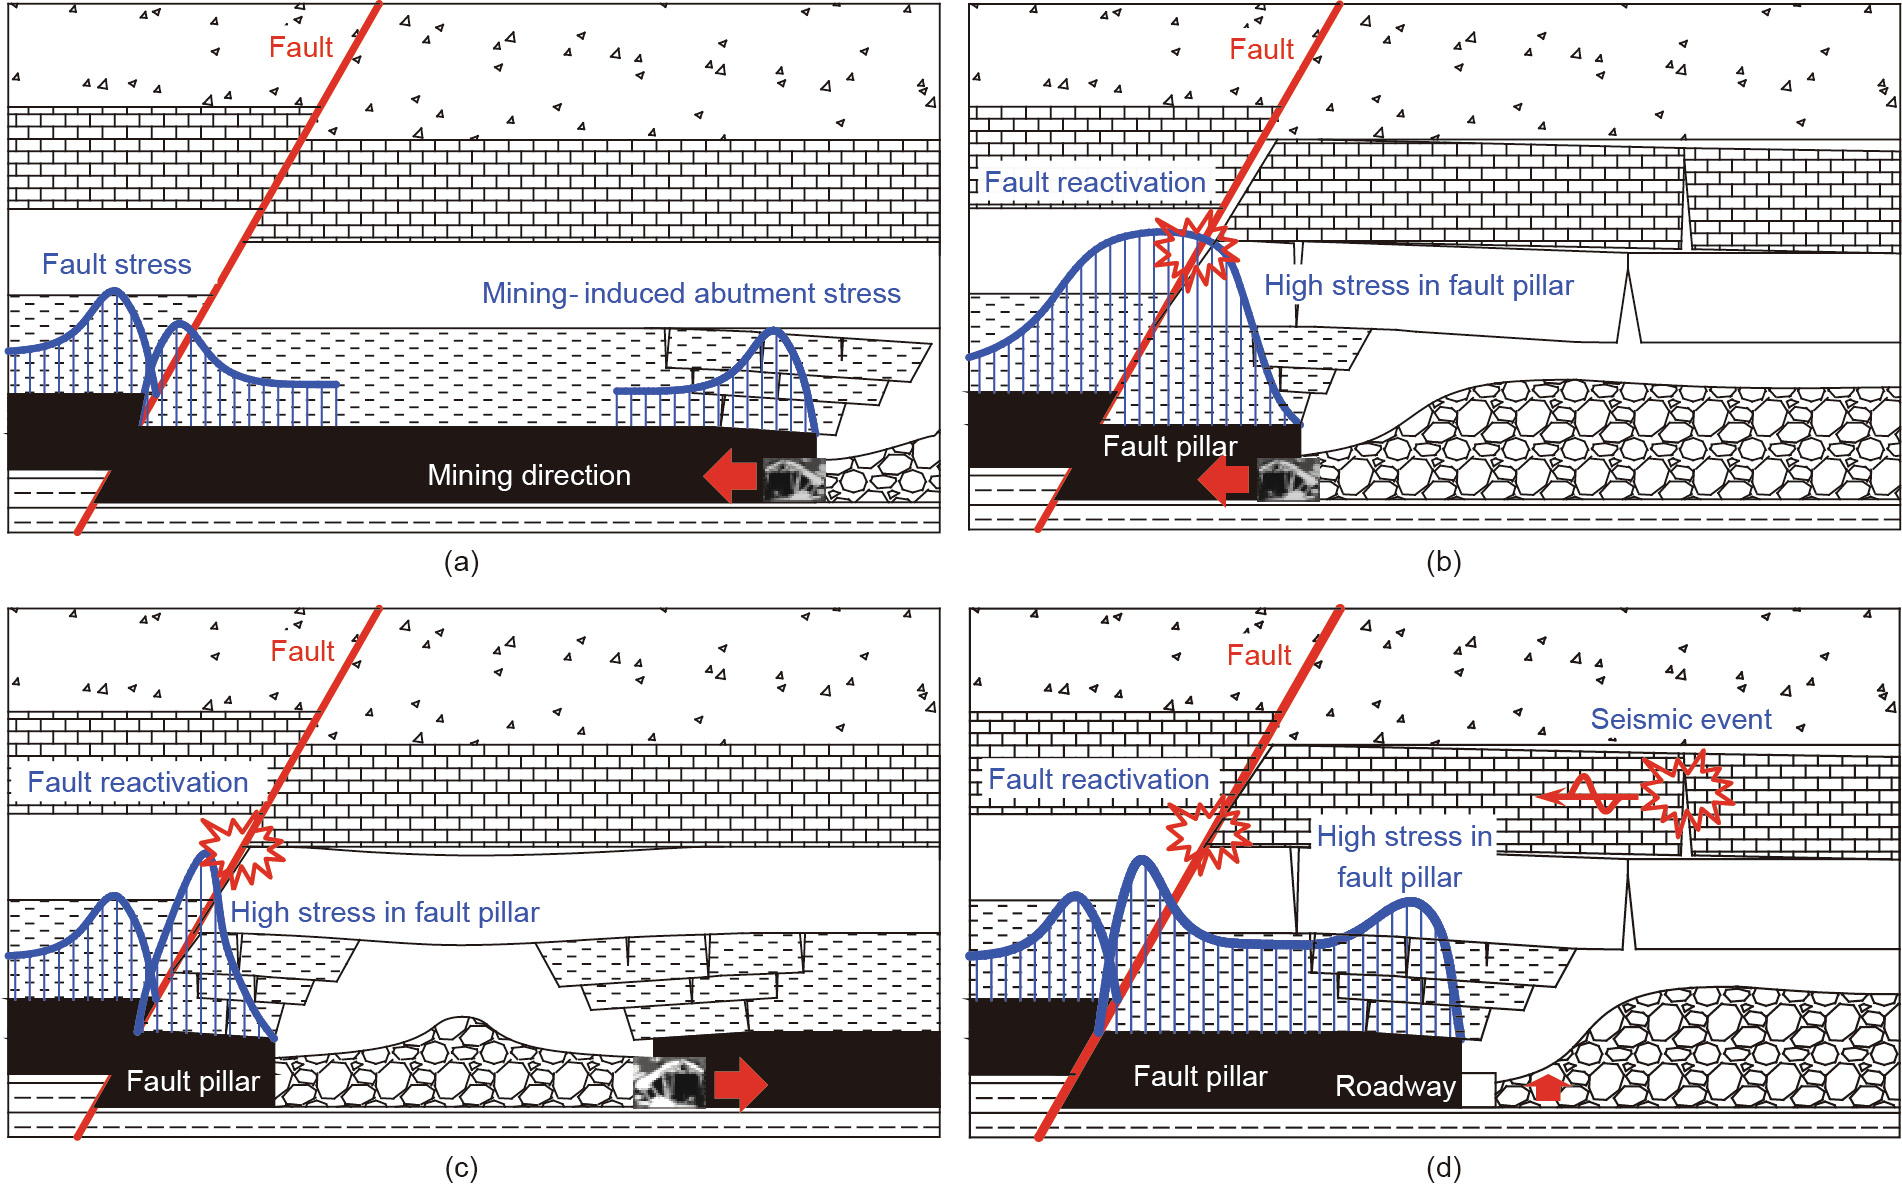
Fig. 1. Conceptual models of fault reactivation induced by underground coal mining activities. (a) Mining activities are far away from the fault and there is no interaction between fault stress and abutment stress. (b) Mining activities are approaching the fault, that is, FRMSS. (c) Mining activities are shifting away from the fault, that is, FRMSS. (d) Mining activities are shifting in the direction paralleled to the fault, that is, FRSDS.
《2.2. Mechanism of fault reactivation》
2.2. Mechanism of fault reactivation
Taking the fault unit as the research object, sketched in the left corner of Fig. 2(a), the normal stress (σyy) and the shear stress (σxy) in the fault plane can be formulated as follows:
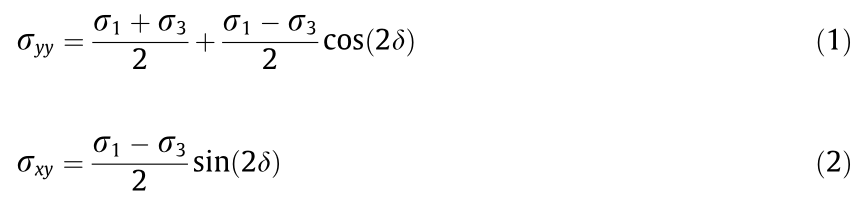
where σ1 and σ3 are the maximum and minimum principal stresses, respectively, which can be exchanged to denote the normal or inverse fault, and δ is the fault dip angle.
According to Coulomb’s friction law [26], the shear strength  of any weak plane can be expressed as follows:

where c is the cohesion of the fault plane,  is the fault friction angle, and p is the pore pressure. If we let
  , the criterion of the fault reactivation can be expressed as follows:
When δ = 90° or 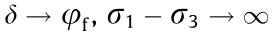 ; thus

If we let  , it can be solved as follows:

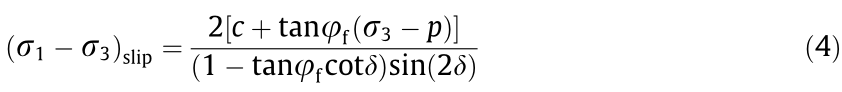
Then, the minimum criterion for fault reactivation can be achieved:
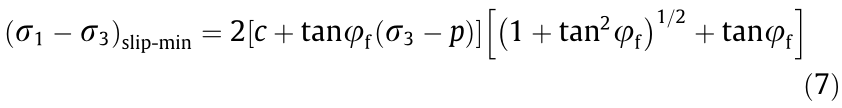
It can be concluded that (σ1- σ3) slip-min is positively correlated with the fault cohesion (c), the minimum principal stress (σ3), and the fault friction angle ( ), since normally σ3 > p, while it is negatively correlated with the pore pressure (p). In other words, fault reactivation will be more easily initiated when p becomes larger and c, σ3, and all become smaller. Moreover, (σ1- σ3)slip will be at a minimum when it satisfies δ = 45° + /2. Therefore, the more the fault dip angle approaches 45° + /2 , the more easily the fault will be reactivated.
In order to further investigate the influence of σ1 and σ3 on fault reactivation, the following numerical simulation model was designed:
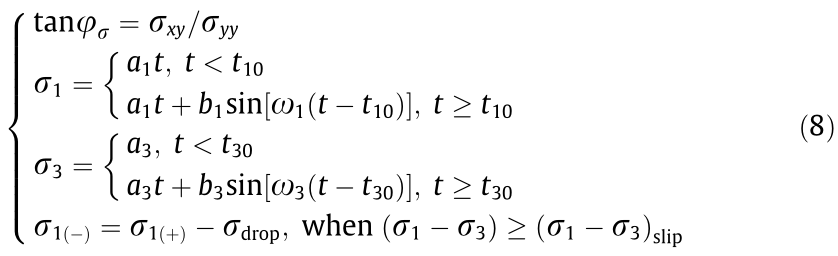
where  is the rate of stress accumulation in MPa·s-1 ;
  is the confining stress in MPa; t is the loading time; b1 and b3 are the amplitudes of the input dynamic loading stresses in the σ1 and σ3 directions, respectively;
  are the angular velocities of the input dynamic loading stresses in the σ1 and σ3 directions, respectively, in rad·s-1 ; t10 and t30 are the times of the input dynamic loading stresses in the σ1 and σ3 directions, respectively, in seconds; and σdrop is the stress drop corresponding to the fault reactivation, which is assumed to affect σ1 only. σ1(+) and σ1(-) are stresses in the σ1 direction before and after the stress drop occurs, respectively. tan
 is the dynamic friction coefficient. The results indicate that tan is closely related to the fault friction coefficient (tan) [27], where tan is controlled by the roughness of the friction plane, the contact time, the slip distance, and other factors, while tan is controlled by the loading regime.
Fig. 2(a) displays the numerical simulation process, where the schematic diagram in the left corner is the biaxial loading test of the fault sample. The whole test process is divided into three stages. In the first stage, a loading with a rate of 0.1 MPa·s-1 is applied in the σ1 direction, while a constant confining stress of 5 MPa is simultaneously maintained in the σ3 direction. In the second stage, an additional sinusoidal dynamic loading of 10sin (0.1t) is superimposed in the σ1 direction at 700 s. In the third stage, with the abovementioned loading conditions remaining unchanged, an additional sinusoidal dynamic loading of 10sin (0.1t) is superimposed in the σ3 direction at 1000 s.
《Fig. 2》
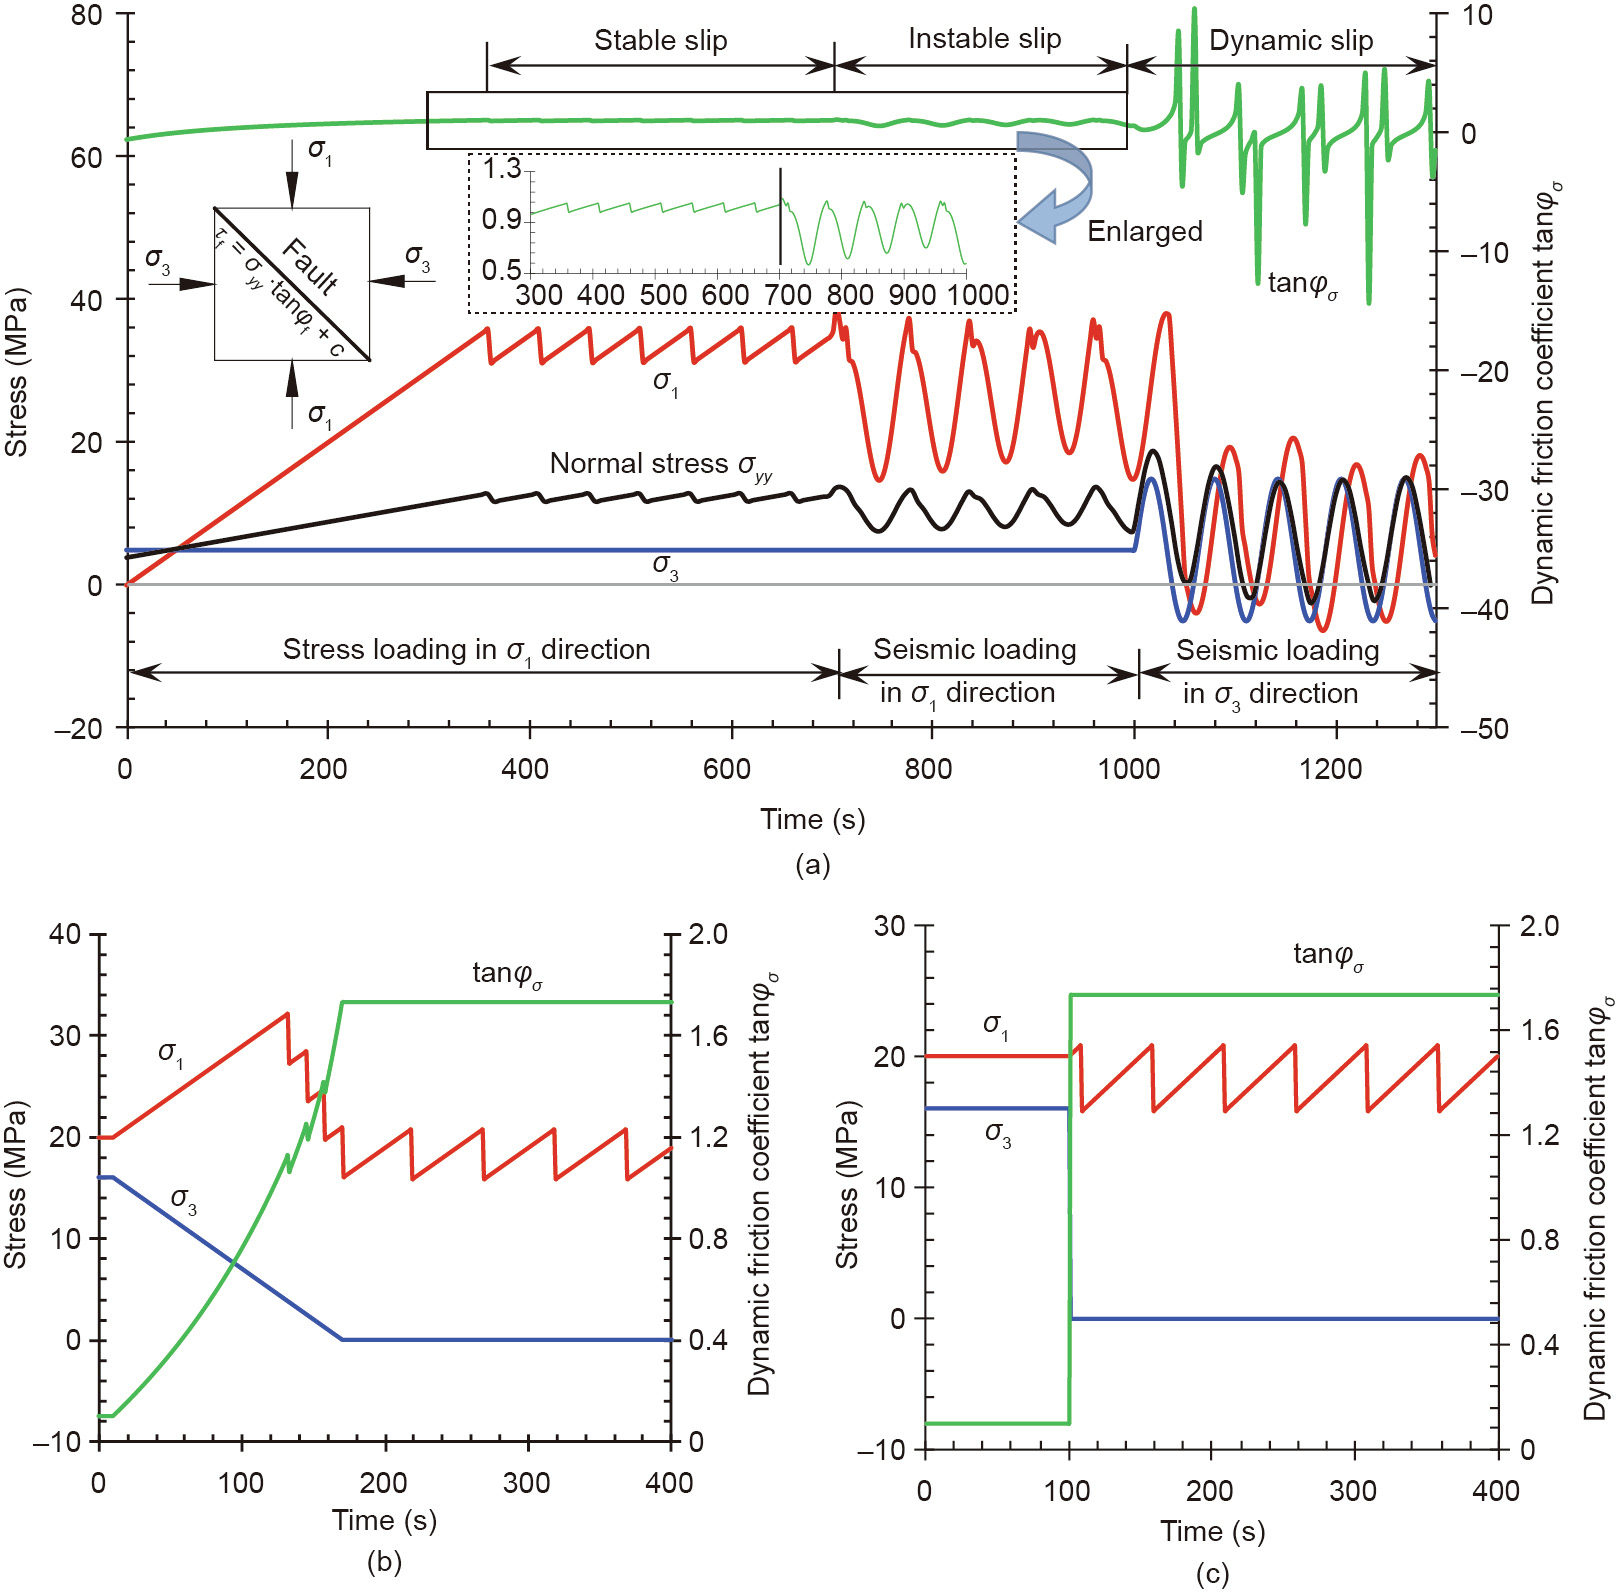
Fig. 2. Simulated tests of fault reactivation under (a) the superposition of static and dynamic stresses loading condition, (b) the condition of vertical loading along with horizontal unloading, and (c) the transient horizontal unloading condition.
It can be seen from the simulation results that under the quasi-static loading condition in the first stage, fault reactivations generate periodic stress drops along with a series of stable stick– slips, as shown in Fig. 2(a). By contrast, fault reactivations are quite different and generate dynamic or even instant instability, under the condition of vertical loading along with horizontal unloading (Fig. 2(b)) and the transient horizontal unloading condition (Fig. 2(c)), which corresponds to the FRMSS described in Figs. 1 (b) and (c), respectively. In the second stage, an additional dynamic loading is applied in the σ1 direction. The stress drops increase slightly along with instable stick–slips but remain in a quasiperiodic perturbation instability. In the third stage, in addition to the application of an additional dynamic loading in the σ3 direction, a sharp increase in the stress drops can be observed, along with dynamic stick–slips. The tan shows many abrupt rises and falls, which are located near the valleys of the dynamic loading applied in the σ3 direction. In this stage, the normal stress in the fault plane even changes to a negative value. This means that tensile stress is generated in the normal direction and, as a result, the relative tightness of the fault plane will disappear or even become contactless. In this context, an ultra-low friction phenomenon is generated, so a small shear stress increment could initiate fault reactivation.
In conclusion, the dynamic loading in the second and third stages has a greater effect on fault stability than the quasi-static stress loading did in the first stage. The dynamic loading in the σ3 direction, albeit with a small value, could change the fault stress state and even its reactivation progress. In particular, the ultra-low friction generated from this dynamic loading could more easily initiate fault reactivation and probably trigger an even larger stress drop from the fault slip. Therefore, ultra-low friction is the essence of the mechanism of the FRSDS.
《2.3. Fault-induced coal burst mechanism》
2.3. Fault-induced coal burst mechanism
As described in Fig. 1, three objects—the roof, coal, and floor— mainly constitute the underground mining space around the fault. The interaction of this roof–coal–floor system essentially controls coal failure processes and further reveals the coal burst mechanism. Therefore, the fault-induced coal burst mechanism model can be depicted as shown in Fig. 3. In this model, coal is assumed to be a fractured or softened material with nonlinear behavior, and the roof and floor are abstracted as the whole surrounding rock and confined as an intact material with linear elastic behavior [28]. As coal mining activities approach the fault, the fault pillar will bear highly concentrated stress (also deemed as static stress (σs)) due to the interaction of the fault and the roof structure [9]. This stress behavior can be described as shown on the right side of Fig. 3, while the stress behavior of the roof and floor under loading is displayed on the left.
《Fig. 3》
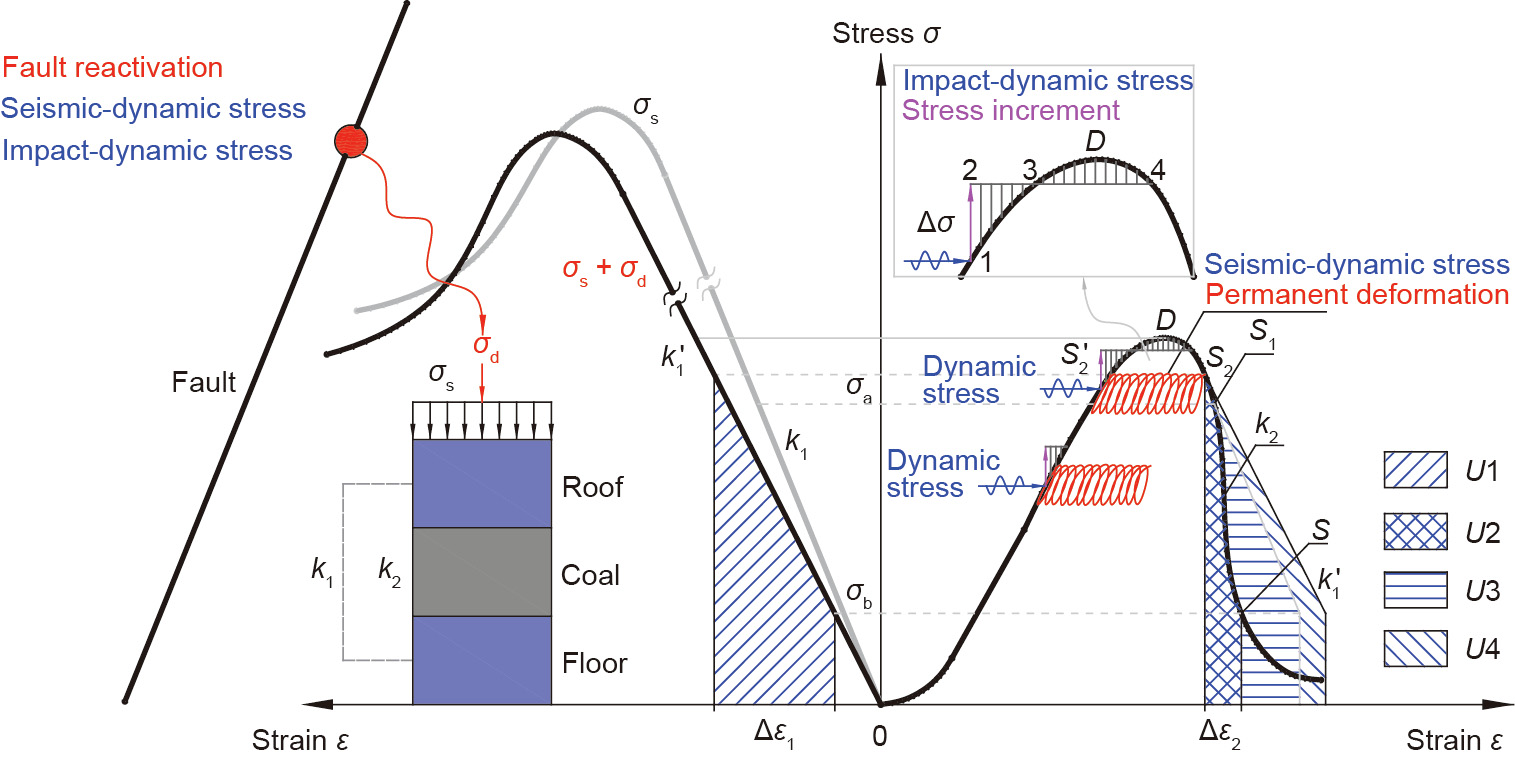
Fig. 3. Schematic diagram of the fault-induced coal burst mechanism model.
It can be inferred from Fig. 3 that a strain change ( ) in the surrounding rock during a coal failure process will be generated once a strain increment (
 ) forms in the coal under quasi-static loading, which can be expressed as follows:

where k1 is the loading stiffness of the surrounding rock, and k2 is the unloading stiffness of the coal. Consequently, the whole strain ( ) of the roof–coal–floor system is
It can be also formulated as follows:
When k1 + k2 = 0, that is,  , corresponding to the point S1 in Fig. 3, the roof–coal–floor system reaches an extremely unstable state. At this moment, the small initial disturbance is greatly amplified and a whole dynamic failure can be induced, which corresponds to coal burst occurrence. Along with the failure process in the coal, which gradually slows down, the whole system tends to reach a new stable state (point S) and the process of coal burst completes, indicating the dynamic failure duration [29]. According to the energy balance principle, the forms of energy in the roof–coal–floor system during the whole coal burst process include released elastic energy (U1) from the surrounding rock, dissipated energy (U2) from U1, and released energy (U3) from the roof–coal–floor system. σa and σb are the initial stress and residual stress before and after the coal burst, respectively.
When the roof–coal–floor system is subjected to the dynamic loading stress (σd) from the fault reactivation, as shown in Fig. 3, the additional input energy (U4) will be imposed into the previous release energy (U3) generated under the static loading condition. As a result, the coal failure process will be more violent. In other words, this dynamic loading could be equivalent to a condition in which the stiffness of the surrounding rock decreases from k1 to k'1. In this context, the position (from S1 to S2) that satisfies the condition k1 + k2 = 0 will be closer to the peak point D and, therefore, the roof–coal–floor system will reach an extremely unstable state () (or initiate the coal burst) earlier. More seriously, this dynamic loading stress (σd) could act as a cyclic loading–unloading with permanent deformation (i.e., seismicdynamic stress) or an impulse loading with transient stress increment (i.e., impact-dynamic stress). Among these, permanent deformation may induce the same dynamic failure as the stress state reaching the point S2, even if the stress state under a static loading condition only reaches to the point S'2. The transient stress increment ( ) could induce the dynamic process from points 1 to 4, although the total stress (
 ) does not yet reach the peak point D, when the area 1-2-3 is greater than the area 3-D-4 with applied at point 1 [30].
In conclusion, fault-induced coal burst is triggered by the superposition of highly concentrated static stress in the fault pillar and dynamic stress resulting from fault reactivation. The high static stress is generated by the interaction of the fault and the roof structure, and the dynamic stress can be ascribed to the fault reactivation (FRMSS or FRSDS).
《3. Validation and discussion》
3. Validation and discussion
《3.1. Experimental validation》
3.1. Experimental validation
3.1.1. Validation of FRMSS
In order to validate the FRMSS, tests were performed on cylindrical sandstone samples collected from an underground coal mine in China. The samples, which were 50 mm in diameter and 100 mm in height, were loaded into a uniaxial apparatus of mechanics testing system (MTS). The sample had a saw cut inclined at an angle of 23.7° to the horizontal axis to simulate a fault, as depicted in Fig. 4. The saw-cut planes were surface ground and then hand lapped with sand granules. In order to simulate the fault friction coefficient and cohesion, different sizes of sand granules, obtained using various sieves, were attached to the cut plane to mimic heterogeneous surfaces with different roughness.
《Fig. 4》
Fig. 4. Saw cut fault sample prepared. (a) Roughness surface. (b) Sample ready for testing.
Fig. 5 displays the test system before the sample was loaded; it includes the loading system, acoustic emission (AE) monitoring system, and digital photogrammetry system. The loading system is an electro-hydraulic servo rock MTS (MTS-C64.106). Displacement control was performed in this experiment and a constant loading rate of 0.18 mm·min-1 was applied until the specimen failed. A PCI-2 AE monitoring system was adopted to record the AE signals during loading, in which a total of eight AE sensors (Nano 30, Physical Acoustics Corporation (PAC), USA, with a frequency domain of 100–400 kHz) were uniformly attached to the upper (three), middle (two), and lower (three) parts of the sample. The sampling frequency of the AE sensors was set at 2 MHz to record the strain energy released by the samples during the test. These recorded AE wave signals were first converted to electrical signals, and then amplified by the pre-amplifier with a gain of 40 decibels (dB). The photogrammetry system used was a Canon TD digital camera, and real-time video was conducted to capture digital images. In the experimental procedure, the stress, strain, AE signals, and digital images were automatically collected.
《Fig. 5》
Fig. 5. Experimental set-up for the validation of FRMSS.
Fig. 6 shows the variation curves of the stress and AE hit count in the initial stage of the fault sample under loading. During the loading process, the test clearly generated the stick–slip phenomenon, but with an aseismic-like slip. This indicates that the sand-type fault gouge cannot easily accumulate shear strain energy or can easily dissipate elastic energy. This kind of stick–slip may pause with the interlocking of asperities, and shear strain energy will therefore accumulate gradually and release until the critical value is reached, along with an inevitable occurrence of higher AE intensity. At the beginning stage before the stick–slip occurs, the fluctuation of stress is very small, but the AE intensity is relatively high. This is because, except for a few small fault stick–slips generated in this stage, there are shear slips and failures in the interactions of the sand granules.
《Fig. 6》
Fig. 6. Relationship between strain–stress and AE hit count during the fault stick–slip.
One digital image from the stick–slip period was extracted and then compared with an image from the initial stage. The results of the displacement and strain were analyzed using PhotoInfor software [31], as shown in Fig. 7. The figure shows that, with the displacement loading, the bottom plate of the MTS loading system moved upward (Fig. 7(a)). In this case, the footwall of the fault sample can be deemed to be the driving plate and the hanging wall can be the passive plate. As a result, the footwall generates a movement to the right along the fault plane and its displacement is obviously larger than that of the hanging wall (Fig. 7(b)). Under the squeezing of the footwall, the hanging wall has a simultaneous tendency to move to the left. This finally generates a significant shear zone in the fault plane (Figs. 7(c) and (d)). The values in this shear zone present a non-uniform distribution; in particular, several strain concentration sub-zones are generated. These are mainly due to the heterogeneous roughness of the surface produced by using sand granules and adhesive, which results in non-uniform distribution of the friction stresses in the fault plane.
《Fig. 7》

Fig. 7. Digital photogrammetry results (unit: pixel): (a) displacement vector; (b) displacement; (c) maximum shear strain; and (d) strain in y direction.
The monitoring results and analyses described above make it possible to conduct a stress analysis for the process of the fault slip, as illustrated in Fig. 8. It can be seen from Fig. 8(a) that a pair of action and reaction stresses (shear stress  and friction stress
  ) is generated in any particle during the fault slip. Due to the heterogeneity of the roughness in the fault plane, the static friction coefficient (
 ) will also be heterogeneous. According to Coulomb’s friction law, the maximum static friction stress in the fault plane can be formulated as
  ; therefore, the friction stress can be expressed as follows:

where μd is the kinetic friction coefficient.
《Fig. 8》
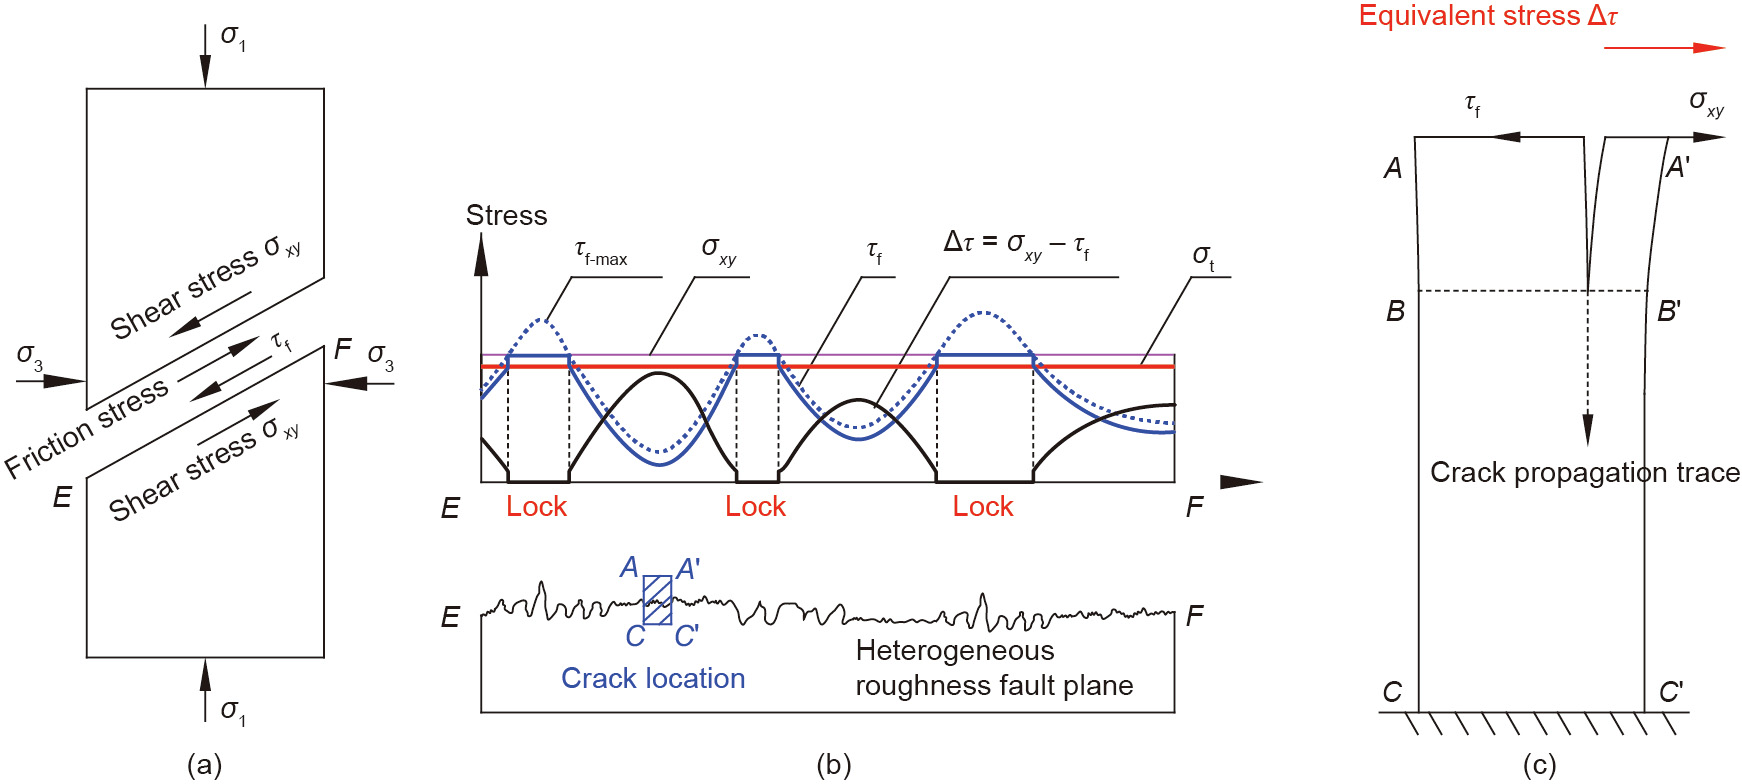
Fig. 8. Stress analysis of the equivalent splitting crack in physical mechanics experiment of fault. Mechanical analysis on (a) fault plane sample, (b) heterogeneous roughness fault plane, and (c) crack propagation trace.
When the stress state reaches a critical point, while σ1 is assumed to be a constant, it is possible to plot the maximum static friction stress ( ) and shear stress (
 ) in a heterogeneousroughness fault plane, as shown in Fig. 8(b). Furthermore, in combination with Eq. (12), the kinetic friction stress (
 ) can be obtained. On this basis, the local fault lock and unlock zones can be mapped, as well as the shear stress difference (
 ) along the fault plane. Once the maximum shear stress difference exceeds the tensile strength of the fault-surrounding rock, that is, max
  , there will be a stress change (
 ) that could be transformed to tensile force and act on the faultsurrounding rock. This stress regime (Fig. 8(c)) is equivalent to the condition of Mode I type crack propagation derived from the theory of fracture mechanics. Consequently, the tensile crack perpendicular to the fault plane will be initiated, and then propagated and extended. It should be noted that this tensile crack trace occurs at the fault unlock zone, as marked with the crack location (AA' C' C) in Fig. 8(b), which also corresponds to the local strain concentration zone (Fig. 7(c)).
To further investigate the characteristics of the shear zone and the equivalent splitting crack in the process of fault slip, AE activities were divided into pre- and post-peak stages, and their spatial distribution was examined, as shown in Fig. 9. It can be seen from Figs. 9(a) and (b) that AE events mainly occurred along the fault plane throughout the whole loading period; they were also nonuniformly distributed, which agrees well with the shear zone along the fault plane (Fig. 7(c)). In addition, another spatial concentration zone of AE events was observed perpendicular to the fault plane. This concentration zone initiates in the pre-peak stage (Fig. 9(a)) and expands in the post-peak stage (Fig. 9(b)), which matches well with the equivalent splitting crack (Fig. 9(c)).
《Fig. 9》
Fig. 9. A photo example for revealing the equivalent splitting crack and the spatial density of AE events. (a) and (b) present the spatial density of AE events occurred during the period of pre- and post-peak, respectively. (c) The tested fault sample after the abrupt failure.
In conclusion, the aseismic or seismic event induced by the fault reactivation can generate directly on the fault or in the surrounding medium with equivalent splitting cracking to accommodate for the main fault displacement. The equivalent splitting crack in the process of fault slip is mainly controlled by the fault friction stress and the tensile strength of the fault-surrounding rock. The fault friction stress here is specifically dominated by the friction coefficient (or roughness) and the fault dip angle. Therefore, four scenarios and associated useful results can be summarized, as below.
(1) When the fault roughness and the fault dip angle are constant, it will be less likely for an equivalent splitting crack to generate when the tensile strength of the fault-surrounding rock becomes larger. Especially in the extreme circumstance that the stress difference () is far less than the tensile strength of the fault-surrounding rock, the energy released by the fault slip will be the main part of the whole energy released. Otherwise, an equivalent splitting crack will generate in the fault-surrounding rock, which constitutes the main part of the released energy.
(2) When the strength of the fault-surrounding rock and the fault dip angle are constant, it will be easier for an equivalent splitting crack to be generated when the fault roughness is greater. In extreme circumstances, the fault will be locked permanently until an equivalent splitting crack occurs. Otherwise, the fault will unlock and slip.
(3) When the fault roughness and the strength of the faultsurrounding rock are constant, it is less likely for the equivalent splitting crack to generate when the fault dip angle is greater. In extreme circumstances, the fault will unlock and slip, and cracks will never be generated in the fault-surrounding rock. In this context, the fault system will be extremely unstable. Otherwise, the fault will be locked until an equivalent splitting crack occurs.
(4) When the fault roughness and the strength of the faultsurrounding rock are greater, and the fault dip angle is smaller, the fault system will neither easily unlock and slip nor generate equivalent splitting cracks. In this case, it is easy for the fault system to accumulate elastic energy, and the released energy will tend to bring about catastrophic accidents once the system unlocks or splits. Therefore, reducing the strength of the fault-surrounding rock could be applicable in order to break the energy accumulation of the fault system, and thereby prevent a fault-induced coal burst.
3.1.2. Validation of FRSDS
Taking the conceptual model (Fig. 1(d)) of FRSDS as the research object, an experimental investigation on fault reactivation under dynamic loading was carried out based on the independently developed pendulum impact test facility. This experimental test mainly consists of the static loading system, the dynamic loading system, a high-speed data-acquisition system, and the stress and AE monitoring system, as displayed in Fig. 10. Dynamic loading was produced by the sudden release of a 20 kg pendulum to hit the slider device, which consists of an outer sleeve and an internal slider bar with an impact plate lying on the wall of the roadway. For more details, please refer to our previous study [32]. Static loading was produced by a hydraulic device on the top beam. A PCI-2 AE monitoring system was employed to record AE signals in this experiment, in which eight AE sensors (with a frequency domain of 1–100 kHz) were uniformly attached to the front and back of the model, as shown in Fig. 11. The sampling rate was set to 1 MHz. It should be noted that the labels (e.g., S1) in the brackets denote the sensors attached to the back of the model with the same locations as on the front. The stress monitoring system includes two groups of stress sensors, which were placed in the coal seam (P3 and P4) and the roof (P1 and P2), respectively. Each group consists of two stress sensors, which were placed on the fault plane and the bedding plane of the stratum nearby. For more details about the model setup parameters and experimental process, please refer to Ref. [33].
《Fig. 10》
Fig. 10. Experimental set-up for the validation of FRSDS. DHDAS: Dong-Hua real time data measurement and analysis software system (Dong-Hua Test Corp., China).
《Fig. 11》
Fig. 11. Design of the physical similar-material model experiment of FRSDS.
Fig. 12 shows the AE monitoring results under dynamic loading in decibels, estimated by the maximum amplitude of all signal waveforms from the recorded AE sensors. This presents a direct relation to the magnitude of the AE events, but the scale is much smaller than the actual value due to the high propagation attenuation of the AE signals in this kind of sand-based similarmaterial media. It can be seen that the dynamic loading has triggered not only a few micro-crack events in the surrounding rocks, but also a fault reactivation event. For this fault reactivation event, the fault shear stress increases to a relatively small amplitude, as shown in Fig. 13, while the normal stress decreases dramatically, and even transforms from the compressive into the tensile stress state. It can be concluded that dynamic loading can make the fault plane bear an instant tension effect, mainly by changing the fault normal stress state. This results in the disappearance of the relative tightness between the fault plates and an ultra-low frictional strength of the fault plane. Consequently, an ultra-low friction phenomenon occurs, and fault reactivation is very easily initiated. In conclusion, dynamic loading can cause an ultra-low friction phenomenon in the fault plane, which is the essence of the FRSDS mechanism.
《Fig. 12》
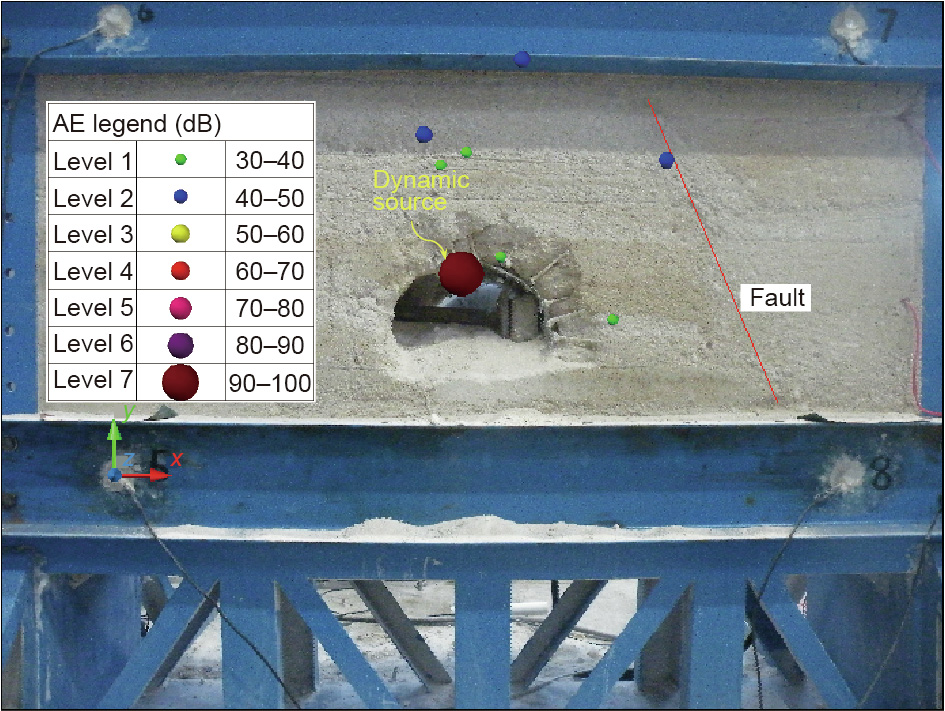
Fig. 12. Experimental process and AE monitoring results.
《Fig. 13》
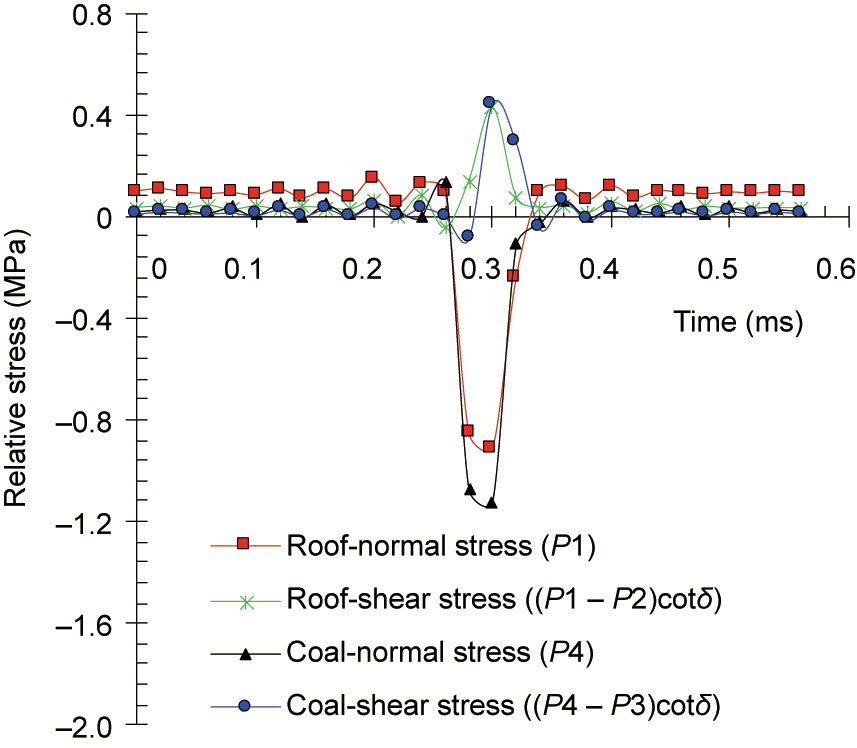
Fig. 13. Mechanical response of fault reactivation under dynamic loading.
《3.2. Numerical modeling and microseismic monitoring》
3.2. Numerical modeling and microseismic monitoring
The Yuejin Coal Mine is located in the city of Yima, Henan Province, China. LW 25110 is the first panel using longwall top coal caving in the Yuejin Coal Mine. The target coal seam that was mainly mined in LW 25110 is buried at about 1000 m in depth and is inclined with an average dip angle of 12°. The coal seam has an average thickness of about 11.5 m, overlain successively by 18 m mudstone, 1.5 m coal, 4 m mudstone, and 190 m glutenite, and underlain successively by 4 m mudstone and 26 m sandstone. Its mining height is 11 m, including 3 m in cutting and 8 m in caving. LW 25110 is adjacent to the goaf in the north, as shown in Fig. 14, with the F16 thrust fault in the south and a solid coal seam in the east and west. Under horizontal compression stress, the strata in the hanging wall of F16 are approximately sub-vertical, thrusting northward along the coal layer. The fault is formed in a listric shape, steeply dipping (75°) at shallow depths and gently dipping (15°–35°) as it deepens further. The fault throw of F16 is 50–450 m and the horizontal dislocation is 120–1080 m. In 2011, when the longwall panels LW 25010, LW 25030, LW 25050, LW25070, and LW 25090 had been mined out, in situ stress measurement was carried out in this research region. The result is annotated in Fig. 14 as follows: σ1 = 25.28 MPa in the vertical direction, σ2 = 17.92 MPa at N82°W in the horizontal direction, and σ3 = 10.31 MPa at N8°E in the horizontal direction.
A microseismic monitoring system developed by the Engineering Seismology Group (ESG) of Canada was installed, which includes 11 sensors (red triangles) assembled on the decline and main entries and four sensors (blue squares) on the track and belt gateways, which can be moved as the working face advances. The spatial distribution of seismic events with an intensity larger than 105 J during the development of the belt gateway is displayed in Fig. 14. It can be seen that seismic events are mainly distributed around the belt gateway. In the cross-section view, most of the events appear to be concentrated along the fault plane or clustered in the hanging wall perpendicular to the fault plane, which agrees well with the experimental results in Fig. 9. Therefore, the seismicity induced by the fault slip can occur directly on the fault or in the surrounding medium.
《Fig. 14》
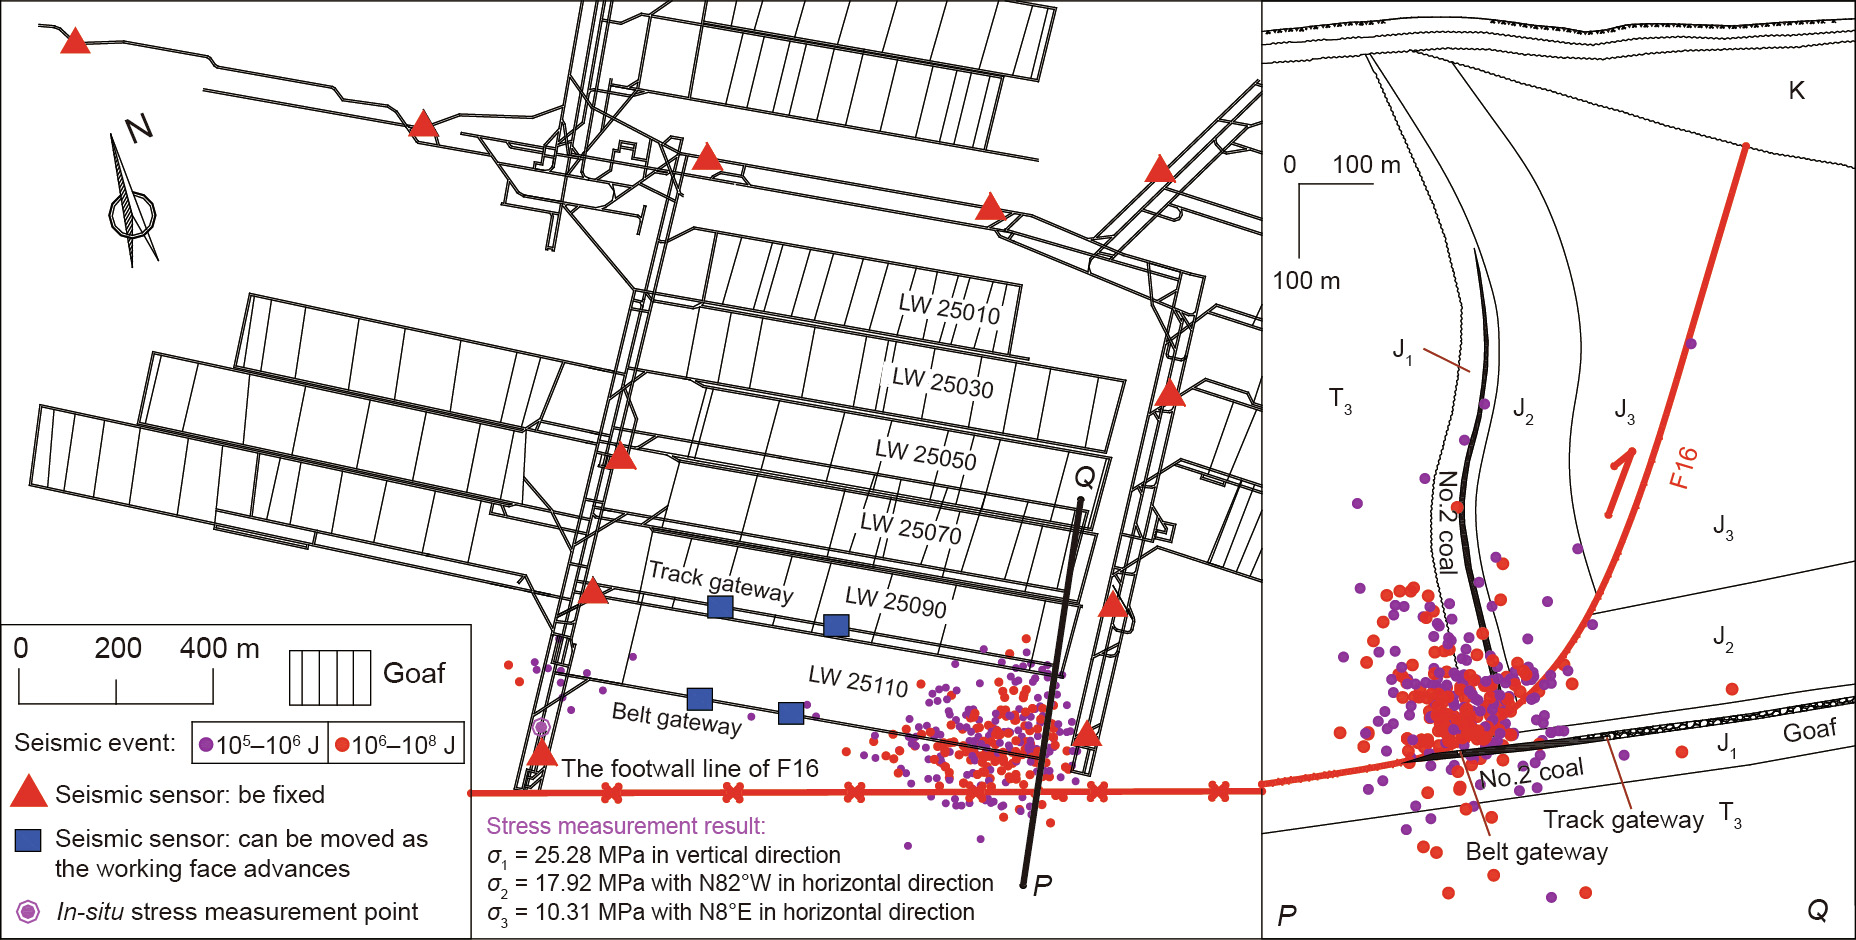
Fig. 14. Mining plan at Yuejin Coal Mine and its geological section. The layout of the microseismic monitoring system and the spatial distribution of seismic events with an intensity larger than 105 J during the belt gateway developing were also marked. For the geological time symbols: K is Cretaceous, J3 is Upper Jurassic, J2 is Middle Jurassic, J1 is Lower Jurassic, and T3 is Upper Triassic. Reproduced from Ref. [2] with permission of Springer Nature Switzerland AG, ©2015.
FLAC3D numerical modeling was performed by simplifying the No. 25 mining district of the Yuejin Coal Mine. Fig. 15 demonstrates a numerical model that contains 267 936 units with the size of 1365 m × 1050 m × 350 m. It should be noted that the focus region was processed with fine grids. The physical properties and thickness (Table 1) of the coal and the coal measure strata were determined based on field geological and experimental investigations.
《Fig. 15》
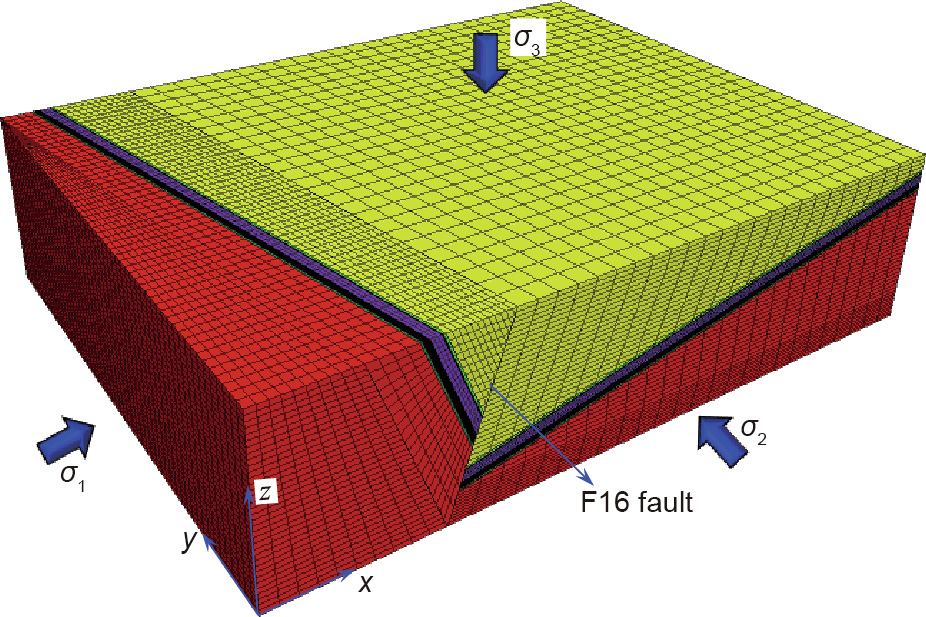
Fig. 15. Numerical modelling for the No. 25 mining district of Yuejin Coal Mine.
《Table 1 》
Table 1 Mechanical properties of the fault and strata in the numerical model.
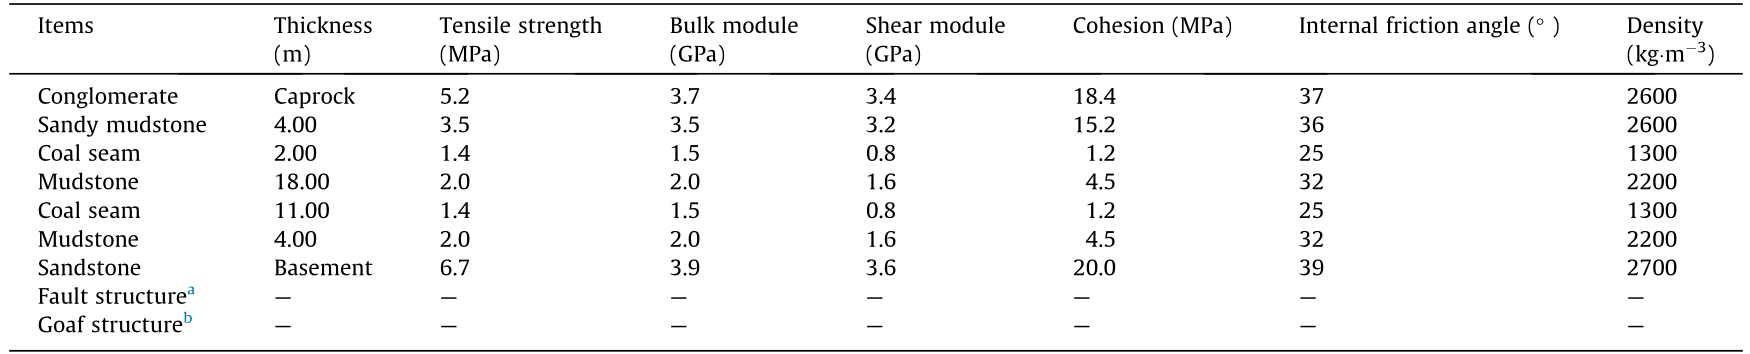
a Interface element in FLAC3D: interfacial cohesion = 2.0 MPa, interfacial friction angle = 30°, normal stiffness = shear stiffness = 9.0 × 10¹¹ Pa·m-1 .
b Null model represented. The associated roof was weakened into 0.2 times the initial input values, and the floor was strengthened into 5 times.
In this paper, the fault was modeled using the interface element. Since the mechanical properties of the fault cannot really be measured, they were determined by trials in a reasonable range, so as to match with the in situ stress measurement condition. They are as follows: interfacial cohesion = 2.0 MPa, interfacial friction angle = 30°, and normal stiffness (kn) = shear stiffness (ks) = 9.0 × 10¹¹ Pa·m-1 , as shown in Table 1. Among these, kn and ks were primarily estimated to be greater than ten times the equivalent stiffness of the stiffest neighboring zone, as suggested in the Fast Lagrangian Analysis of Continua (FLAC) manual:
where K and G are the bulk and shear moduli, respectively, and  is the smallest width of a zone in the normal direction of the interfacing surface.
In addition to matching the in situ stress measurement condition, the stress regime of the thrust fault region before the extraction of the coal should be initiated, according to the Anderson fracture mechanism [34], by considering the minimum principal stress (σ3) in the vertical direction and the maximum (σ1) and intermediate (σ2) principal stresses in the horizontal direction (Fig. 15). It should be noted that the principal stresses (σ1, σ2, and σ3) initiated along the axes (x, y, and z) in the modeling approximately correspond to the in situ stress measurement orientations (N8E in the horizontal direction, N82W in the horizontal direction, and the vertical direction), respectively. Therefore, the boundary conditions of the numerical model were assumed by trials: fix the bottom boundary, apply σ1 = 29.0 MPa and σ2 = 24.0 MPa in the horizontal direction and both with the gradient 0.025 MPa in the vertical direction, and apply σ3 = 20.5 MPa in the vertical direction.
Depending on the in situ mining schedules, the longwall panels LW 25010, LW 25030, LW 25050, LW 25070, and LW 25090 were mined successively in the numerical modeling. In this procedure, at each excavation step, the elements in the grid representing the coal blocks of the current longwall panel to be extracted were removed by arranging them into the null model. The associated roof was weakened by altering the bulk module, shear module, cohesion, and tension to 0.2 times the initial input values, and the floor was strengthened by 5 times accordingly. These changes are considered to simulate the behaviors of roof caving and goaf compaction, respectively.
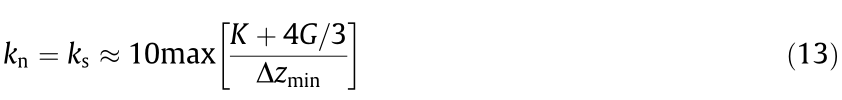
Fig. 16 shows the spatial distributions of the vertical stress (SZZ), the horizontal stress in the x direction (SXX), the horizontal stress in the y direction (SYY), and the lateral stress coefficient (λ = SXX/SZZ) in the fault plane before mining starts at LW borehole blasting, borehole slotting, and water injection [44–46]. Roof blasting and hydraulic fracturing [47] can be adopted to change the roof structure, which can reduce the concentrated stress in the fault pillar by weakening the interaction between the fault and the roof structure. In addition, the layout of the longwall panel can be designed to oblique-cross the fault in order to avoid sudden instability; otherwise, the width of the fault pillar at some point will decrease completely or even disappear, causing a destructive coal burst.
《Fig. 16》
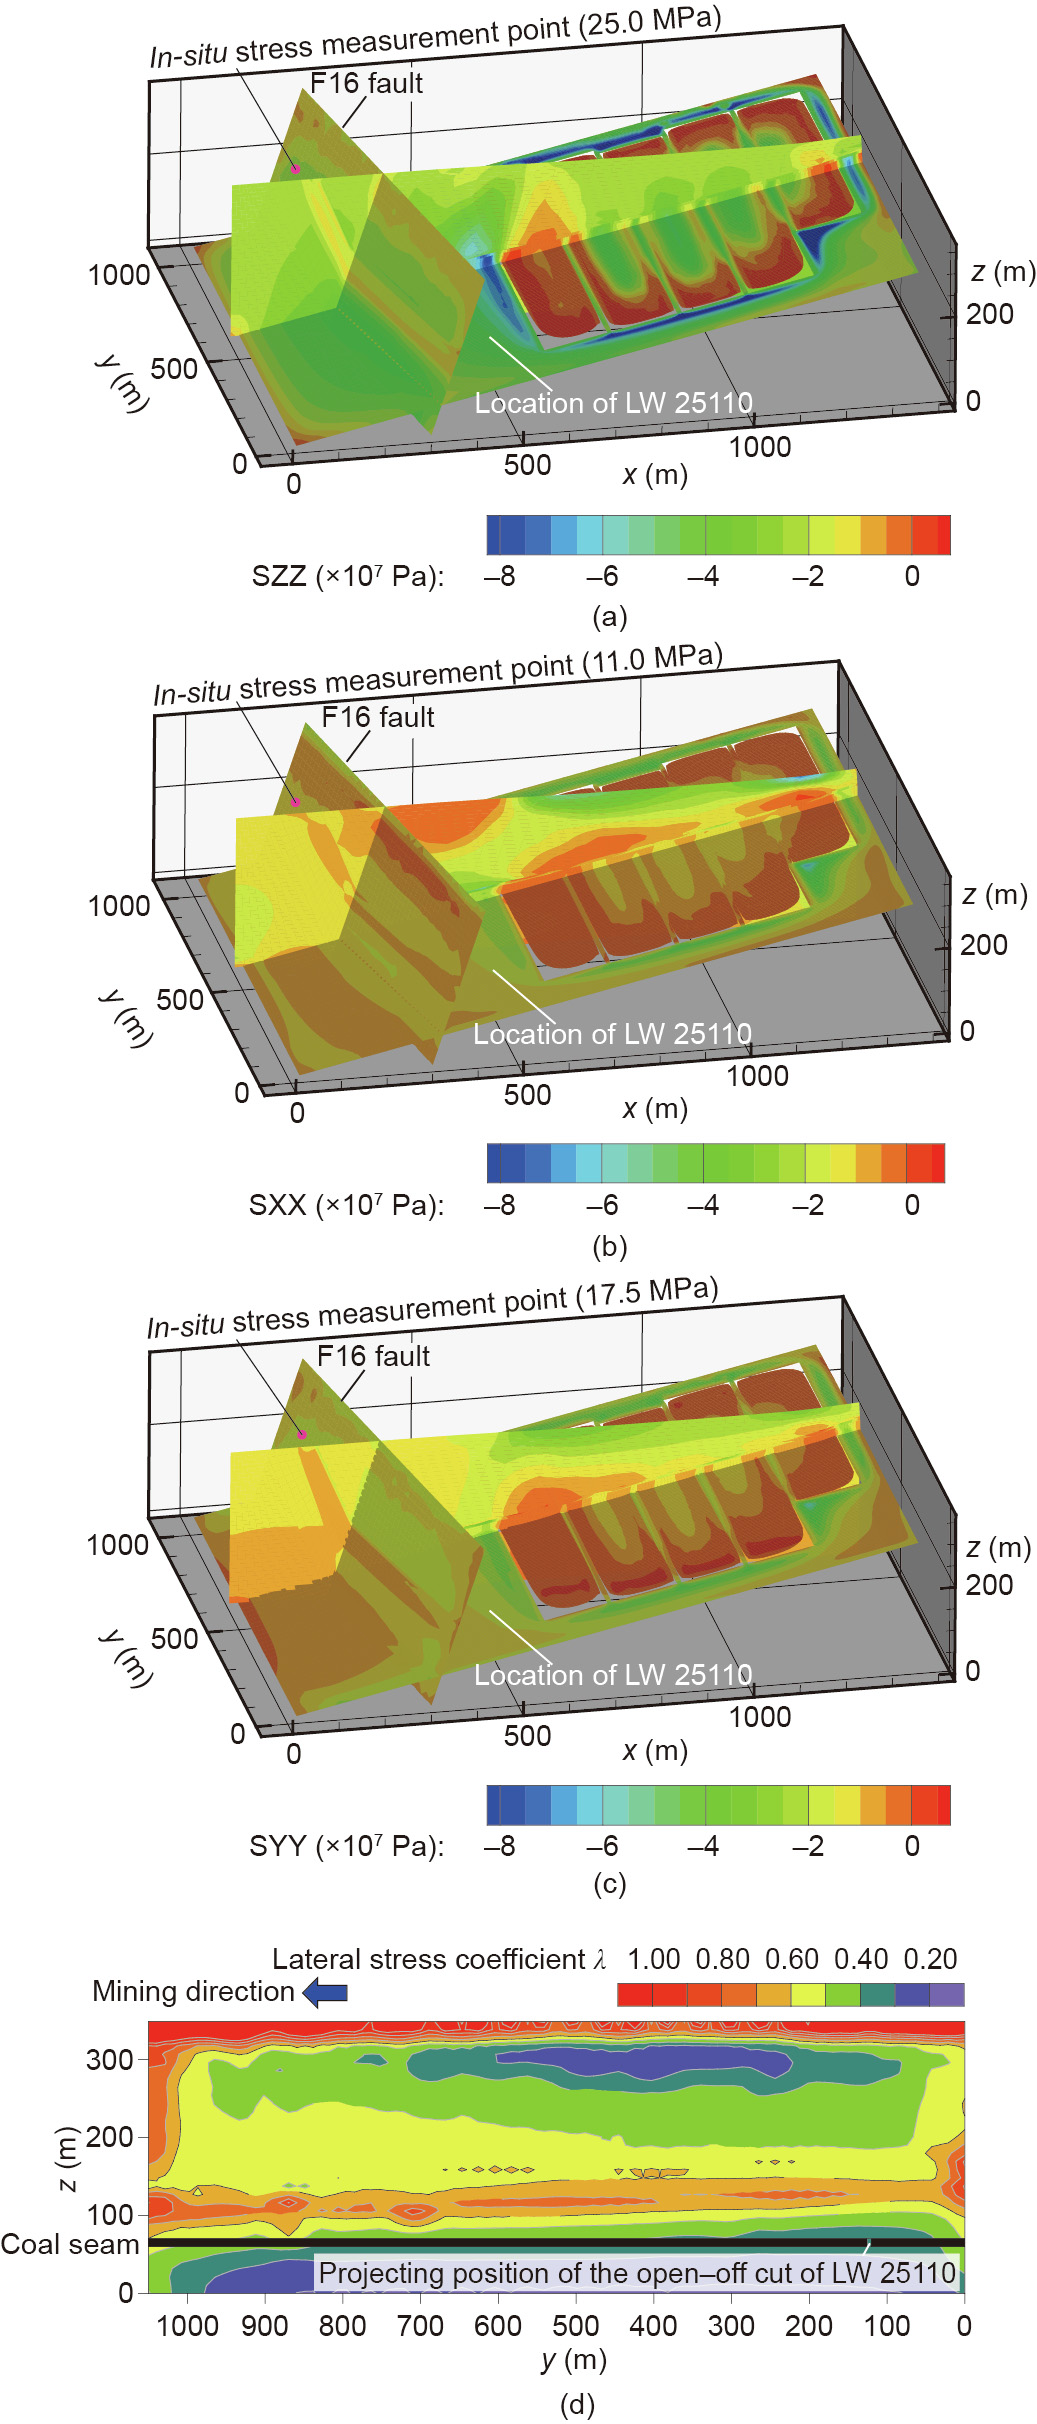
Fig. 16. Distributions of (a) the vertical stress SZZ, (b) the horizontal stress in x direction SXX, (c) the horizontal stress in y direction SYY, and (d) the lateral stress coefficient (λ = SXX/SZZ) of the fault plane before longwall panel LW 25110 mining.
《3.3. Monitoring and prevention strategies for fault-induced coal burst》
3.3. Monitoring and prevention strategies for fault-induced coal burst
According to the fault-induced coal burst mechanism described above, monitoring and prevention strategies for fault-induced coal burst should be implemented based on monitoring and characterizing the highly concentrated static stress in the fault pillar and the dynamic stress from fault reactivation (Fig. 17), and accordingly controlling and relieving them (Fig. 18).
《Fig. 17》

Fig. 17. Monitoring methods of the fault-induced coal burst.
《Fig. 18》

Fig. 18. Prevention strategies of the fault-induced coal burst.
To monitor the highly concentrated static stress in the fault pillar, conventional monitoring methods can be used to capture the stress information in the fault pillar directly, such as coal drilling cuttings [35], relative borehole stress [36], electromagnetic emission [37], AE [38], and displacement. Microseismic monitoring [39–41] and seismic velocity tomography [42] can be utilized to characterize the distribution of fractures and estimate the stress distribution in the fault pillar. Hydraulic support pressure monitoring [43] can be adopted to infer the roof activities and structure, in order to further capture the stress in the fault pillar indirectly, based on the interaction between the fault and the roof structure.
To monitor the dynamic stress from the fault reactivation, microseismic monitoring and roof separation monitoring are mainly used in response to fault reactivation.
To prevent dynamic stress due to fault reactivation, deep borehole blasting and water injection can be used to directly reduce the fault cohesion (c) and the friction angle ( ) and simultaneously increase the pore pressure (p). The aim of these strategies is to weaken the intensity of the fault reactivation or even induce a controllable fault reactivation event and then release the accumulative energy around the fault. In addition, the advancing rate of the longwall face can be optimized to avoid dynamic fault slip due to a sudden decrease of the minimum principle stress (σ3), and the mining activities can be reduced to alleviate the influence of FRSDS.
It should be noted that although these general prevention strategies are proposed based on the conceptual and analytical modeling results described herein, the application of borehole blasting to relieve the accumulative stress around a fault and the strategies to relieve the high stress in a fault pillar have been successfully demonstrated in the Chaoyang [17] and Yuejin [5] Coal Mines, respectively.
《4. Conclusions》
4. Conclusions
Building upon investigations on the relationships between underground coal mining layouts and fault occurrences, mechanisms of fault reactivation and its induced coal burst were proposed, and then validated by the results of experimental investigations, numerical modeling, and in situ microseismic monitoring. Accordingly, monitoring methods and prevention strategies for fault-induced coal burst were discussed and recommended. Four main conclusions were drawn:
Two kinds of fault reactivations were proposed: FRMSS and FRSDS. Fault reactivation is mainly related to the cohesion, friction angle, and dip angle of the fault plane, as well as the minimum principal stress and the pore pressure. In particular, the redistribution of mining-induced stress within the increase of vertical stress and the decrease of horizontal stress, corresponding to a decrease in the lateral stress coefficient, is the essence of the FRMSS mechanism. The generation of an ultra-low friction phenomenon in the fault plane while it is subjected to seismic-based dynamic loading is the essence of the FRSDS mechanism.
Fault-induced coal burst is triggered by the superposition of high static stress in the fault pillar and dynamic stress from fault reactivation. High static stress is generated by the interaction of the fault and the roof structure, and dynamic stress can be ascribed to FRMSS and FRSDS. On this basis, monitoring methods and prevention strategies for fault-induced coal burst were discussed and recommended, with a focus on how to monitor and characterize the highly concentrated static stress in the fault pillar and the dynamic stress from the fault reactivation, as well as how to control and relieve them.
The validation of FRMSS indicated that mining-induced quasistatic stress can cause a fault slip by changing the fault stress state, primarily with a decrease in the lateral stress coefficient. In the process of fault slip, equivalent splitting cracks perpendicular to the fault plane can be produced, which is mainly controlled by the fault friction stress and the tensile strength of the faultsurrounding rock. The in situ microseismic monitoring results show that seismic events induced by fault slip occur in the fault plane and the surrounding medium; this is consistent with fault slip zones and the equivalent splitting crack locations, respectively. The aseismic or seismic events induced by fault reactivation can generate directly on the fault or in the surrounding medium with equivalent splitting cracks to accommodate for the main fault displacement.


 京公网安备 11010502051620号


