
《1. Introduction》
1. Introduction
The concept of flexible manufacturing factories has been developed to allow multi-variety and small-batch production modes of future factories. However, isolated factories with limited resources have difficulty in meeting the continuously changing requirements and demands of production modes and customers alike. To tackle these challenges, and because of current industrial agglomeration and supply chain status, industrial parks have come into practice. Industrial parks, which are composed of clustered manufacturing factories and complementary services, significantly promote economic growth through resource sharing, mutual assistance, and complementary production capacities [1].
In current industrial parks, many operational tasks, including logistics tasks, are permanently integrated and executed synchronously, and continuously affect each other. In broad-area and busy industrial parks, a large amount of data is generated and exchanged, leading to increased communication and computing complexities. Many studies have assessed these communication and computation complexities for improved management efficiency of industry parks. Furthermore, some researchers have explored collaboration schemes to improve the operating performance of industrial parks. Qiu et al. [2] presented a Supply Hub in Industrial Park (SHIP), which interacts with manufacturers inside industrial parks, to build a bi-level model to address their storage pricing, replenishment, and delivery problems. Moreover, some researchers have proposed integrating advanced technologies inside industrial parks, including the Internet of Things (IoT), cloud computing, and edge computing. Cloud computing [3] technology allows data to be uploaded to a cloud server, where the interaction between the cloud control center and underlying equipment occurs. As the performance of the network deteriorates with an increase in data volume [4], edge computing is combined with cloud computing to alleviate network workload. Edge computing is a technology that provides information technology (IT) services and cloud computing environment abilities at the edge of the network [5]. These two technologies can co-exist and have a complementary relationship [6]. Ha et al. [7] proposed a collaboration architecture supported by cloud computing, where optimal solutions can be obtained. Zhao et al. [8] integrated the IoT and edge computing technologies and presented a collaborative tracking architecture for distributed decision-making in industrial parks. Qi et al. [9] presented a family energy system based on multi-access edge computing technologies. In this study, we also applied the integration concept, which can optimize the performance of industrial parks.
At present, the following challenges remain in the pursuit of optimal logistics schemes in industrial parks:
• Interconnections: As a large number of operational vehicles and equipment are involved, managing these massive objects and their interconnections presents a major challenge.
• Multi-factory integration: Several factories may connect with others for complete logistics tasks. Although many studies on internal factories have proposed optimization algorithms independently, achieving integrated schemes in industrial parks is very complicated.
• Real-time responses: Achieving real-time responses is desired, as it can improve the operational efficiency of industrial parks. One example is how vehicles respond after encountering an obstacle without impacting the overall processes.
In this study, we aim to address the aforementioned challenges in industrial parks. The remainder of this paper is organized as follows. Section 2 describes the problem from the perspective of an industrial park scenario. Section 3 introduces the fifth-generation (5G) vehicle-to-everything (V2X) network deployment in industrial parks and related technologies. Section 4 presents the overall collaboration architecture for industrial parks with 5G V2X networks. Section 5 describes the multi-functions that can be arranged rationally based on the device–edge–cloud collaboration. Section 6 presents the configuration and evaluation method—that is, the analytical target cascading (ATC) method—and applies it to the proposed collaboration framework. Section 7 demonstrates the proposed framework through a logistics analytical case study of industrial parks with 5G V2X networks and evaluates the integrated schemes. Finally, our main conclusions and directions for future research are outlined in Section 8.
《2. Problem description》
2. Problem description
The purpose of this study is to define collaboration schemes for logistics tasks in industrial parks, without researching the internal manufacturing operations of particular factories. Accordingly, we will design a collaboration framework for this scenario. To begin, some descriptions and considerations are needed to quantify the requirements for integrated schemes.
First, the components of the logistics scenario in industrial parks are categorized to be sensors, vehicles, edge servers, and the cloud server. The vehicles are regarded as connected vehicles with no drivers, and are likely to be affected by other components such as edge servers, the cloud server, and road obstacles. These components can form complex operational connections [10], influencing each other once changes take place. Consequently, an extensive range of data, information, and knowledge needs to be processed in real time [11].
Second, during the logistics operations in industrial parks, we mainly consider the following functions: environmental perception and map construction (E), task allocation (T), path planning (P), and vehicle movement (V) (referred to as ETPV functions for short). Fig. 1 shows the ETPV workflow in a typical industrial park. The sensors installed on the roads and vehicles collect data to achieve environmental perception and update the data in the cloud server. Then, the cloud server allocates tasks for vehicles, and edge servers plan local paths within their supervising area. Barrier-free path segments can be obtained by combining the obstacle information perceived by the sensors. Finally, the vehicles execute their logistics tasks on a segment-by-segment basis until the vehicles reach their corresponding destinations.
《Fig. 1》

Fig. 1. Typical logistics workflow in an industrial park.
Third, the main objective of the scenario is to complete logistics tasks and obtain optimally integrated schemes. From a global viewpoint, the cloud server plays the role of allocating tasks, and the vehicles are supposed to travel from supply points to destination points. From a local viewpoint, while the vehicles are traveling within each sub-area, the corresponding edge server plans the local path segments within its supervising range. Meanwhile, sensors perceive the environment and provide this information to the servers, helping to plan the barrier-free path segments. Therefore, an integrated solution is required for effective coordination and collaboration among these interacting functions.
Finally, it should be noted that we do not focus here on determining the optimization algorithm for each function, as this paper presents the analytical validation of the proposed collaboration framework. In our future work, we will design and implement the optimization algorithms for the validated framework and apply them in real-world scenarios.
《3. 5G network deployment for logistics in industrial parks》
3. 5G network deployment for logistics in industrial parks
Several requirements are identified below for the logistics in industrial parks: ① As the logistics operations in industrial parks can be regarded as mobility services [12], road-user safety should be considered. Although our scenario focuses on industrial parks, which contain fewer pedestrians or vulnerable users than urban scenarios, the safety issue still lays the foundation for other processes. Therefore, extreme requirements exist for the efficiency of the perception, decision-making, and controlling processes. ② The operational status of industrial parks is constantly changing as the popularity of customized production modes increases. Furthermore, frequent data transmission is likely to cause packet loss. These two trends may result in low industrial park reliability. Therefore, it is necessary to handle the flexible connections of physical devices and the large-scale transmission of generated data.
Deploying high-performance equipment to manage various connections and developing intelligent algorithms to enable high computing power are two potential solutions to these requirements, and have been applied by many researchers and companies [12,13]. However, integrating them on individual vehicles seems to be difficult to realize, and problems such as high-precision map updating in real time must be addressed. Thus, it is necessary for vehicles to collaborate with road users for a more comprehensive perception range and accurate navigation, and to share computing power with cloud and edge servers. Therefore, deploying 5G networks in industrial parks can be of great use, by applying the 5G slicing technology and combining it with V2X networks. Existing fourth-generation (4G), wireless fidelity (WiFi), and other wireless communication technologies cannot meet the above requirements.
《3.1. 5G slicing technology accelerating efficiency》
3.1. 5G slicing technology accelerating efficiency
As expected, the deployment of 5G networks can increase the operational performance of industrial parks, especially real-time feedback abilities for a quicker response to accidents [14]. The advantages of 5G networks can be described from two perspectives, as follows:
From the first perspective, 4G networks currently cannot support low latency and high efficiency of services. For instance, it would take about 1.5 m for a vehicle with 4G to apply its brakes. In contrast, a vehicle with 5G would only require 2.5 cm to do so, which would help to prevent accidents [15]. Similarly, if a vehicle enters an area that has low coverage or is highly populated, a 4G connection would fail. However, a 5G connection will theoretically always have good coverage, allowing a stable connection anywhere and anytime [16].
From the other perspective, the widely used 4G core network (CN) and radio access network (RAN) are integrated with the same architecture, without much flexibility. However, 5G networks can support a vital technology called network slicing, which can decouple the user plane (UP) and control plane (CP) functionalities by displacing them in different positions [17]. This way, their functions can be implemented at desired and convenient locations, saving management and operation time.
To achieve these superiorities, three typical 5G slices are deployed:
• Enhanced mobile broadband (eMBB), which is appropriate for applications that require a seamless user experience, so this 5G slice has significantly higher requirements for data and user experience rates;
• Massive machine type of communication (mMTC), which always includes extensive terminal equipment, resulting in a high demand for connection density, as well as high energy consumption and operational equipment costs;
• Ultra-reliable and low latency communications (uRLLC), which have strict requirements for latency and reliability capabilities. The potential of 5G networks in uRLLC applications has been well documented [18]. For example, the latency of 5G is approximately 1 ms, which is expected to be 10–100 times faster than 4G. Moreover, 5G exhibits better performance stability, whereas WiFi connections are easily disturbed and broken [10].
• Therefore, 5G slicing technology can accelerate the efficiency of logistics operations in industrial parks, either by specifically dividing the uRLLC slice for low latency performance or by decoupling UP and CP to save management and operation time. Furthermore, in terms of the eMBB and mMTC slices, 5G is expected to perform better than other existing wireless communication technologies, as the requirements of our scenario include high-precision record communication and extensive data transmission [10].
《3.2. 5G V2X networks enabling massive connections》
3.2. 5G V2X networks enabling massive connections
IoT technology plays an essential role in connecting physical devices and coordinating operations over the Internet [19]. Furthermore, the Internet of Vehicles (IoV) is specifically developed to connect vehicles for large-scale communication over the Internet, enabling them to gather and exchange information, surveillance, and localization [20–22]. As a primary technology, V2X communications [23,24] is composed of vehicle-to-vehicle (V2V), vehicle-to-infrastructure (V2I), vehicle-to-pedestrian (V2P), and vehicle-to-network (V2N) communications [25]. Implementing V2X communications enables diverse types of connections.
V2X communications consist of two modes: cell-V2X (C-V2X) and dedicated short-range communications (DSRC), where C-V2X outperforms DSRC in terms of link speed, interference decease, and non-line-of-sight (NLOS) capabilities. As our study involves the logistics operations in industrial parks, C-V2X application is suitable for the proposed framework because it provides the PC5 interface for direct communication between the underlying road users and the LTE-Uu interface for communication through the CN. According to the 3rd Generation Partnership Project (3GPP) Release 16, PC5 and LTE-Uu interface enhancements, as well as new radio (NR) standardization, are considered to be the first phase of 5G technology for enhancing C-V2X [26], where 5G NR supports the ultra-high capacity connectivity of vehicular communications [27].
Therefore, 5G V2X, located at the intersection of C-V2X and 5G networks, is viewed as a potential trend to enable massive communications between moving vehicles and other work equipment in a logistics scenario. As shown in Fig. 2, the local clouds are allocated near the moving vehicles, the remote clouds are distributed near the users, and the edge clouds located between them are actually closer to the local clouds. In our scenario, the local clouds correspond to the devices and edge servers, while the edge clouds correspond to the cloud servers. Remote clouds are not considered, as they are outside of industrial parks and mostly controlled by terminal clients.
《Fig. 2》
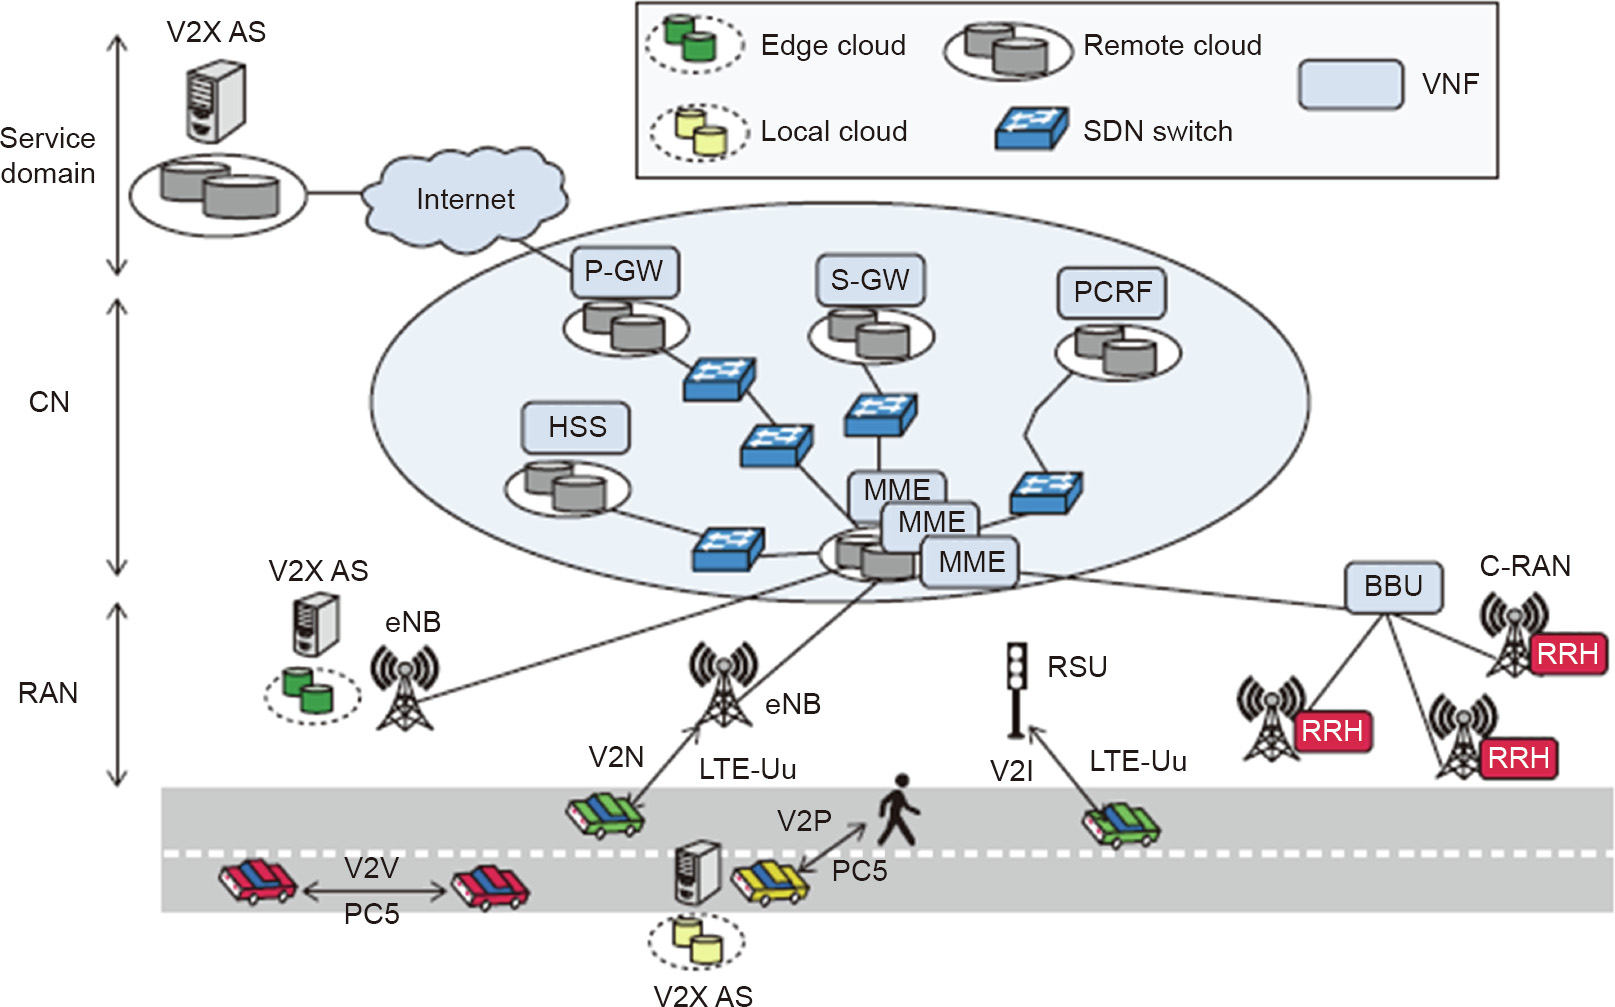
Fig. 2. V2X communication modes and 5G slicing concept in the device, RAN, and CN for V2X services. MME: mobility management entity; S-GW: serving gateway; P-GW: packet data network gateway; HSS: home subscriber system; PCRF: policy and charging rule function; BBU: baseband unit; RRH: remote radio head; C-RAN: cloud-RAN; eNB: eNodeB; RSU: road-side unit; AS: application server; SDN: software-defined network; VNF: virtualized network functions. Reproduced from Ref. [17] with permission of IEEE, © 2017.
Despite their many advantages, 5G networks have some shortcomings: ① 5G is developed and applied in the millimeter-wave spectrum with a short coverage distance, which results in an increased number of 5G base station (BS, also called gNB) deployments; and ② the expenses of 5G deployments will increase to a certain degree, considering the energy consumption and costs of gNBs. Hence, to address these drawbacks, two trends have emerged: ① assigning 5G spectrums more reasonably, which is outside of the scope of this paper, as different countries may have different solutions; and ② finding the optimal logistics schemes in industrial parks to compensate for these shortcomings, which is the focus of this paper.
《4. A multi-layer collaboration framework for industrial parks with 5G V2X networks》
4. A multi-layer collaboration framework for industrial parks with 5G V2X networks
As shown in Fig. 3, we propose a multi-layer collaboration framework with 5G V2X networks, including the perception and execution, configuration, and logistics layers. It enables collaborative work between ETPV functions. The novelty of this collaboration framework is manifested in two aspects: ① The ETPV functions are managed through the device–edge–cloud collaboration; and ② the ATC method is applied for configuration and evaluation. These two aspects are described in detail in Sections 5 and 6.
《Fig. 3》

Fig. 3. A multi-layer collaboration framework in industrial parks with 5G V2X networks. USB: universal serial bus; LIDAR: light detection and ranging; HPC: high performance computing; OBU: on-board unit.
《4.1. 5G communications for the framework》
4.1. 5G communications for the framework
The 5G network is applied to support the communication of the collaboration framework, which benefits the connection of components in the framework—that is, the cloud server, edge servers, onboard units (OBUs), and road-side units (RSUs), as shown in Fig. 4. First, the OBUs communicate with each other via V2V technology and send messages to the RSUs via V2I. Then, the RSUs transfer the collected data over the Internet to the cloud servers for storage. At the same time, the OBUs deliver data directly to the edge servers via a 5G network. Deployed by the gNBs in industrial parks, 5G can provide private networks. The small cells, which are installed independently from other equipment and do not disturb data transmission and calculations, provide effective data security. Therefore, 5G communications for the proposed framework enable low-latency and safe transmission, as well as efficient framework collaboration.
《Fig. 4》
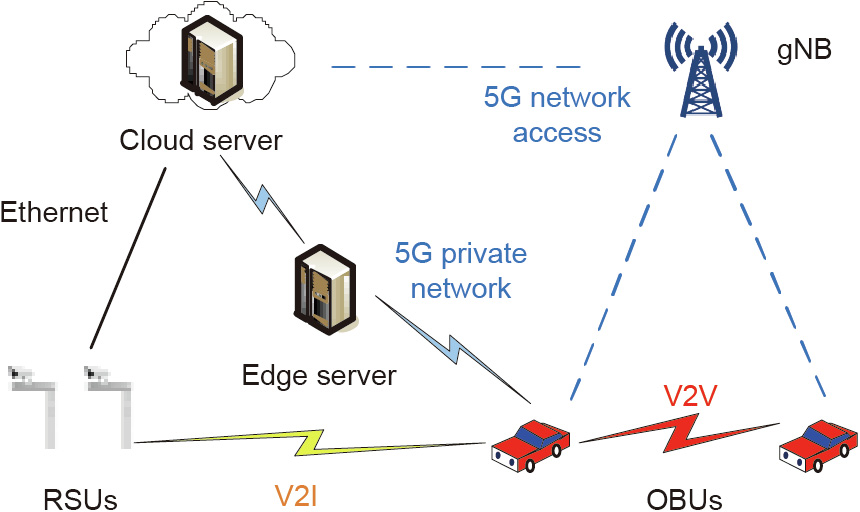
Fig. 4. 5G communications for connections between components in the proposed framework.
《4.2. Perception and execution layer》
4.2. Perception and execution layer
In the perception and execution layer, the connected vehicles achieve self-perception based on the OBUs and environmental perception based on the RSUs. These sensors operate in different sub-areas and receive distributed tasks from their edge servers for management. Devices such as underlying cameras, light detection and ranging (LIDAR) sensors, high-performance computers, and inertial navigation sensors are connected with the OBUs and RSUs through network cables, universal serial bus (USB) cables, and serial port cables. This layer belongs to the physical domain, revealing the real-time operational status of industrial parks with 5G networks.
《4.3. Configuration layer》
4.3. Configuration layer
The configuration layer plays a vital role in the platform domain. As shown in Fig. 5, once the logistics tasks are released, the sensors, edge servers, and connected vehicles respond. However, the aforementioned functions affect each other and form flexible constraints. For example, the environmental perception function is implemented by the sensors in different sub-areas, influencing the path-planning function schemes, and the cloud server triggers the tasks for vehicles and collects their real-time status, based on which path-planning decisions are made. Accordingly, the extensive input and output variables can be divided into the device, edge, and cloud sides, where the evaluation processes are operated by the ATC method, as shown in Fig. 6. After that, the multifunction integrated schemes are coordinated in real time through responses and feedbacks.
《Fig. 5》

Fig. 5. Partitioning status of the proposed collaboration framework. l: the number of environmental perception schemes; k: the number of task allocation schemes; m: the number of path schemes; a: the number of sensors; b: the number of edge servers; c: the number of vehicles.
《Fig. 6》

Fig. 6. Evaluation and configuration processes based on the ATC method.
《4.4. Logistics layer》
4.4. Logistics layer
The logistics layer is established on the application domain, and some decisions and controls can be made on the underlying equipment. To alleviate the burden on the cloud server, the entire zone is divided into several sub-areas, each of which stands with an edge server that targets the vehicles and other road users within its limits. Thus, the logistics layer assigns real-time tasks from cloud servers to underlying devices, where some decisions and controls can be made. The logistics layer workflow is shown in Fig. 1 and in the top layer of Fig. 3. More details are given in Section 5.
《5. Device–edge–cloud collaboration for the ETPV functions》
5. Device–edge–cloud collaboration for the ETPV functions
This section describes the logistics of industrial parks with 5G V2X networks, where the ETPV functions are coordinated to obtain integrated schemes. First, data are collected from sensors and transmitted to the edge servers for environmental perception after some preprocessing. Then, this environmental information is delivered and saved on the cloud server, which also allocates the tasks to vehicles. Afterward, the cloud and edge servers are responsible for vehicle path planning from global and sub-area perspectives, respectively. Finally, vehicles can realize segmentbased movements until they reach their corresponding destinations. The ETPV functions can be characterized as  , where
  indicates the logistics task.
《5.1. Device–edge–cloud collaboration in 5G V2X networks》
5.1. Device–edge–cloud collaboration in 5G V2X networks
To manage the complex calculations associated with the ETPV functions, this study applies a device–edge–cloud collaboration, which separates the functions to work at three potential locations: the device, edge, and cloud sides. The device side includes vehicles, sensors, and other underlying equipment, while the edge side includes the edge servers, which can manage the computations and operations within their corresponding sub-area. The cloud side is often a cloud server at the control center, which has the capability of not only controlling and managing industrial parks, but also storing operational information and updating it frequently. By integrating the 5G V2X networks, the device–edge–cloud collaboration will be useful for connected equipment and servers. It can link cloud platforms with edge points, so the computing resources are moved into the facilitates, which can alleviate resource congestion and provide quicker accident responses [28,29].
After introducing the workplaces of the ETPV functions in our scenario, the following subsections demonstrate the models built for each function, which will be applied for the integrated schemes. The function indexes ID, S, C, J, and t are extracted for consistency; where ID indicates the function scheme number; S is the selected scheme of the functions; and C, J, and t indicate the schemes’ installation costs, energy consumption, and execution time, respectively.
《5.2. E function》
5.2. E function
The modeling of the E function is shown in Fig. 7. The sensors are installed on the OBUs and RSUs, where data is collected and sent to the cloud and edge servers. The operational status of this function includes vehicle information, such as running time, energy consumption, driving speed, and driving lanes, while the environmental information includes static and dynamic obstacles, traffic status, and other parameters. After the necessary information is obtained, the modeling can be executed and drivable areas can be determined. A great deal of research effort has been devoted to these fields. Schreiber et al. [30] achieved robust localization and environmental perception with the help of cameras, an inertial measurement unit (IMU), and a global navigation satellite system (GNSS). Combining the GNSS-generated maps, cameras, and IMU on running vehicles can allow them to perceive obstacles and lane messages, which in turn are used to determine drivable areas via evaluations and markings. Liu et al. [31] designed a method that can fuse the pixel information from a monocular camera with the spatial information from a LIDAR scanner. In this way, the feasible area for self-driving cars can be perceived, and the contents of the global map can be further improved. Currently, related studies tend to combine advanced sensors and apply localization, mapping, data fusion, synchronization, and other technologies to achieve environmental perception and map construction.
《Fig. 7》
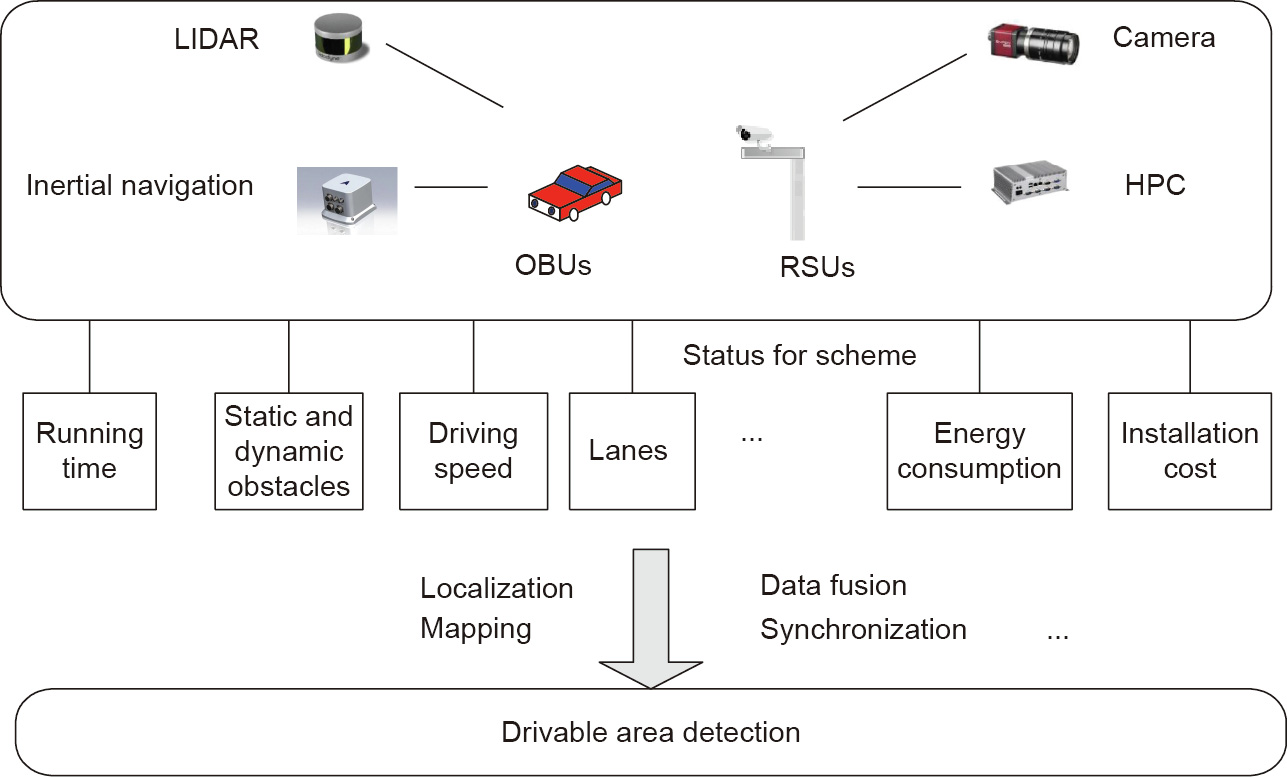
Fig. 7. Modeling of the environmental perception and map construction function.
However, the directions for function optimization are varied, so comparisons between them become difficult. In this study, we selected the installation cost and energy consumption of the sensor deployment, along with execution time, as the indexes to be evaluated. Then, the scheme identifies one of the optimization goals of the integrated schemes with ETPV functions, that is the environmental perception scheme, and the status information of it is stored in the matrix SE.

where EIDl denotes the scheme number for environmental perception and map construction;  denotes the lth scheme of the model in sub-area j ;
  denotes the installation cost associated with scheme , including the operational costs of the sensors and servers; and
  and
and  denote the energy consumption cost and execution time of scheme , respectively. Each matrix line indicates all the indexes of one scheme, while the column number l indicates the available choices of one index.
《5.3. T function》
5.3. T function
ased on the environmental information obtained with the previous function, the cloud server is supposed to allocate the logistics tasks to be completed by the vehicles. These tasks, which are released from factories in different sub-areas, may have different destination points and resource requirements. Some related ongoing projects are focusing on these T functions. Xu et al. [32] abstracted an allocation model with fuzzy resources from a multi-task assignment problem, and then designed a multiobjective scheme to minimize the total logistics cost and execution time. Shriyam and Gupta [33] expanded the multi-robot task allocation problem by considering contingency tasks, and then designed a multi-heuristic scheduling framework to prune the decision search space and reduce the running time.
During the T function implementation, the cloud server is responsible for allocating tasks to vehicles from a global perspective, so improving the cloud server performance can be considered as a potential direction for optimizing this problem, and thereby positively impacting the execution efficiency. As a response to the allocated tasks, the vehicles drive to their destination points and travel through different sub-areas. The traveling processes can be seen as sub-task-allocation problems, where vehicles are assigned sub-destinations. After linking the sub-destinations, a complete traveling sequence for each vehicle can be formed. During this process, the status of the moving vehicles (e.g., maximum speed, acceleration, and energy consumption) can affect the optimality of the schemes. In addition, as the edge servers supervise the moving vehicles in each sub-area, the indexes of the edge servers (e.g., affordable workloads and remaining resources) could affect the schemes.
To achieve integration with other functions, we take the installation costs, energy consumption, and execution time of the cloud server, edge servers, and vehicles as indexes for the schemes. Thus, optimizing the assignment scheme is the second goal of the integrated schemes with ETPV functions, which is the task allocation scheme, its status information is stored in the matrix ST.
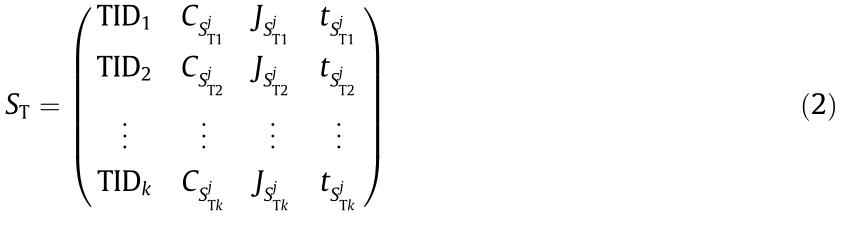
where TIDk denotes the number of task allocation schemes;  denotes the kth assignment scheme, indicating its predecessors in sub-area j;
  denotes the installation cost of assignment scheme , namely the operational cost of the servers and vehicles; and
  and
and  denote the energy consumption cost and execution time of scheme , respectively.
《5.4. P function》
5.4. P function
After the cloud server decides the sub-area traveling sequences for the vehicles, the edge servers in the different sub-areas plan the local route schemes while the vehicles are within the edge servers’ supervising areas. This function can be modeled as a multi-agent path-planning (MAPF) problem [34–36], which considers the occurrence of dynamic and emergency events such as obstacles or pedestrians. Thus, while the vehicles are traveling segment by segment, they can be safe and avoid accidents in the subsequent segments. To solve the MAPF problem, several algorithms, including the enhanced A* [37,38], increasing cost tree search [39], and conflict-based search [40], have been developed for optimizing the path-planning schemes.
However, sub-optimal solutions are also proposed to address this problem, which improves algorithm efficiency by appropriately sacrificing optimality. Jiang et al. [41] proposed a sevenlayer map structure to support path planning, where each layer plays a different role and contributes to optimizing the solutions. Their method is similar to our device–edge–cloud collaboration, where the calculations can be implemented in convenient places, so the schemes can be executed faster and in a more flexible manner. As the P function pursues quick responses, the execution time can affect the schemes. Accordingly, the edge servers are selected for implementation, instead of the remote cloud server; this not only saves total execution time, but also alleviates the workload and consumption of the cloud server. As a result, the schemes of this function are mostly determined by vehicle and edge server conditions. After extracting the consistent indexes with the previous functions, the state information of the path-planning scheme is stored in the matrix SP.

where PIDm denotes the number of the path-planning scheme;  denotes the mth path scheme in sub-area j;
  denotes the installation cost of path scheme
  , where the moving vehicles, edge servers, and other operational equipment are involved; and
  and
and  denote the energy consumption cost and execution time of path scheme , respectively.
《5.5. V function》
5.5. V function
Finally, the vehicles are supposed to execute the logistics tasks segment by segment. However, the obtained results often deviate from the planned schemes. This function could be regarded as the operation scheme of the first three functions; therefore, the indexes of this function should be the same as those of the previous three functions. This scheme is the fourth optimization objective, which is the vehicle movement scheme, and its state information is stored in the matrix SV.
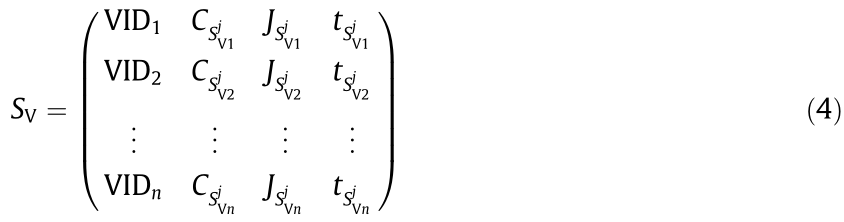
where VIDn denotes the number of operation schemes;  denotes the nth operation scheme in sub-area j;
  denotes the installation cost of scheme
  ; and
; and  and
and  denote the energy consumption cost and execution time of scheme , respectively.
The integrated schemes 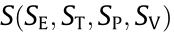 can be obtained based on the mathematical models with unified indexes. Meanwhile, the device–edge–cloud collaboration with 5G V2X networks is applied, effectively coordinating these functions and integrating the advantages of transmission speed and computational efficiency. In this way, the workflow and data transmission of logistics tasks in industrial parks can become more efficient, and latency and collision accidents can be reduced.
《6. ATC method for the collaboration framework》
6. ATC method for the collaboration framework
This section introduces the ATC method and demonstrates the configuration processes. Originating from the optimization design field, ATC [42] is a hierarchy optimization method with the basic principle of decomposing an entire framework into distributed elements. Based on the obtained independent decisions, an integrated solution is achieved.
After extracting the unified indexes from the ETPV functions and applying the device–edge–cloud collaboration, the functions are arranged at the cloud, edge, and device sides. Based on the extracted indexes from the ETPV functions, we evaluated and further configured the optimally integrated schemes through the ATC method, whose process is illustrated in Fig. 8. The ATC elements are marked as 1–6, divided into the cloud, edge, and device sides. In this way, our problem is converted from to S (Scloud, Sedge, Sdevice ), and the integrated schemes can be obtained.
《Fig. 8》

Fig. 8. Evaluation and configuration processes based on the ATC method. TT: total execution time; TC: total installation cost; TJ: total energy consumption cost.
Furthermore, the objective functions are established to minimize all the index values: installation cost, execution time, and energy consumption, which are obtained from the cooperation companies and converted proportionally from a cost perspective. Execution time represents the cost associated with the overall spending time, including the calculation and transmission time, while installation cost represents the cost of implementing the schemes. Energy consumption indicates the expenditure paid for equipment operation. Thus, these three objectives have the same units, and the targets can be obtained by weighting them.
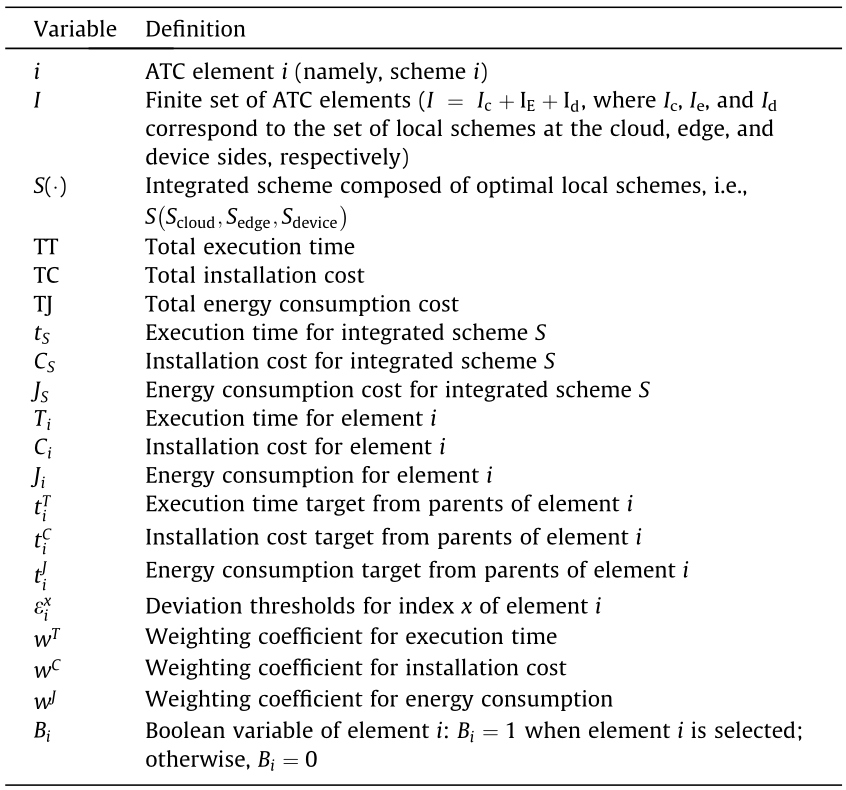
The notations for the ATC method are as shown in Table 1.
《Table 1》
Table 1 The notations for the ATC method.
《6.1. Objective of the collaboration framework》
6.1. Objective of the collaboration framework
The objective of the collaboration framework is to find the optimal integrated scheme with the ETPV functions presented in Section 5. The overall goal of the framework is to minimize the sum of the weighted total execution time, installation, and energy consumption costs, where the ATC method is built from the cloud, edge, and device sides, and modeled as follows:

Eq. (5) explains the targets of the overall collaboration framework: namely, minimizing the objective values at the cloud, edge, and device sides.
《6.2. Objective of the ATC elements at the cloud side》
6.2. Objective of the ATC elements at the cloud side
The cloud server implements the T function and decides the sub-area sequences for vehicles. The objective at the cloud side is the optimal sum values of the cloud server, where
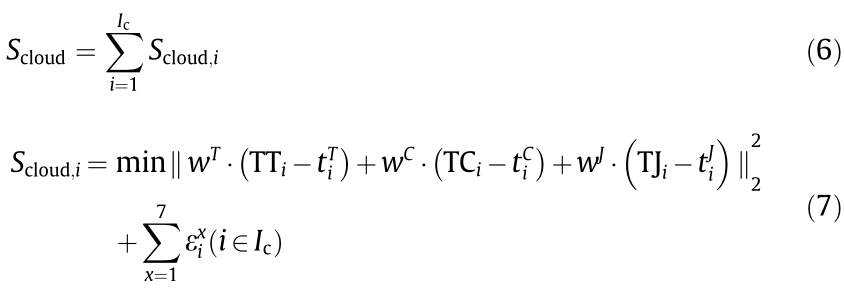
If i = 1, that is, if cloud server 1 in Fig. 8 is considered, and its offspring ATC nodes are nodes 2, 3, and 4 at the edge side, then the cloud side scheme is shown as follows:

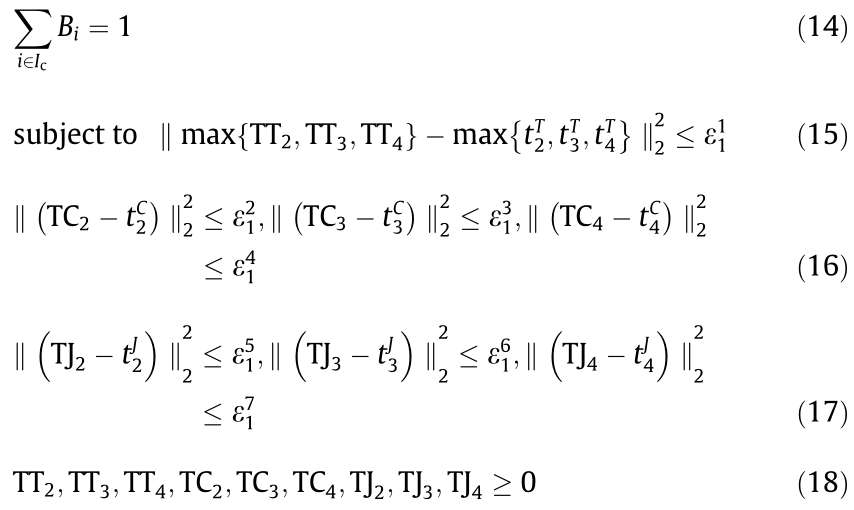
Eqs. (8)–(10) indicate the three indexes to optimize, where the total execution time index is obtained from the maximum value between the self-time and the sums of its offspring’s, and the total installation cost and total energy consumption indexes are calculated from the sum of their self-values and all their offspring’s together. Eqs. (11)–(13) are used to obtain the index values of the selectable schemes, while Eq. (14) shows that only one scheme can be selected at one cloud server. Eqs. (15)–(17) indicate the deviations between the theoretical targets and the practical responses, which can be used to evaluate and configure the operational conditions. Eq. (18) indicates that all the index values should be equal to or greater than 0.
《6.3. Objective of the ATC elements at the edge side》
6.3. Objective of the ATC elements at the edge side
Based on the calculated traveling sequence, the edge servers are supposed to plan paths for vehicles within their areas. In addition, they consider the surrounding environment while the vehicles are traveling segment by segment. Within each area, vehicle movement must be coordinated in order to avoid deadlocks and collisions. The calculations of this local scheme are demonstrated in Eqs. (19)–(31), and the objective function is shown as follows:

If i = 3, that is, if edge server 3 in Fig. 8 is taken into consideration, then
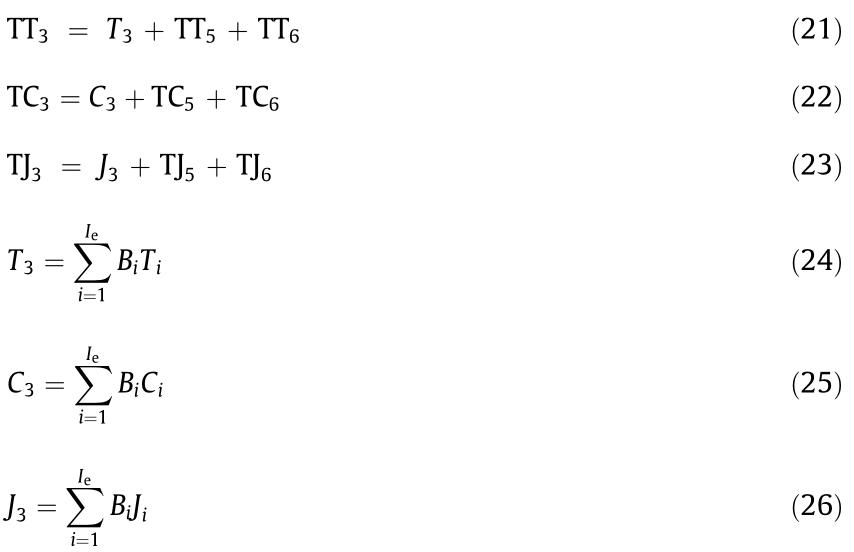
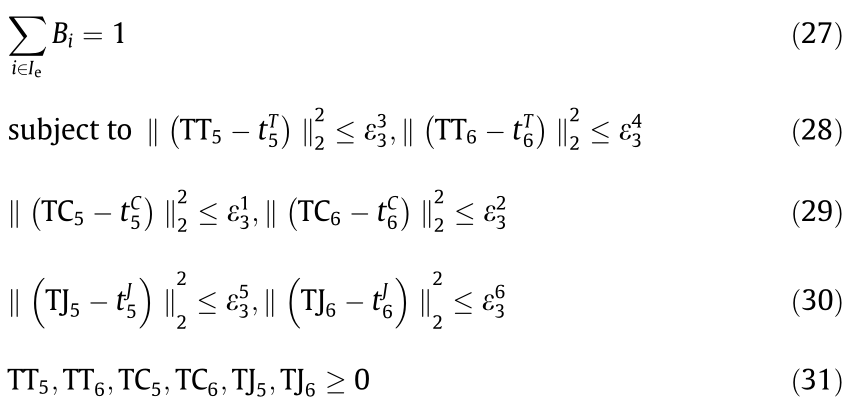
Eqs. (21)–(31) can be explained in a similar manner as the explanation provided in Section 6.2.
《6.4. Objective of the ATC elements at the device side》
6.4. Objective of the ATC elements at the device side
The device side includes the operational vehicles and sensors on OBUs and RSUs, where the objective of one device is demonstrated by the following equations. Because the number of devices is greater than one, the objective is indicated as follows:
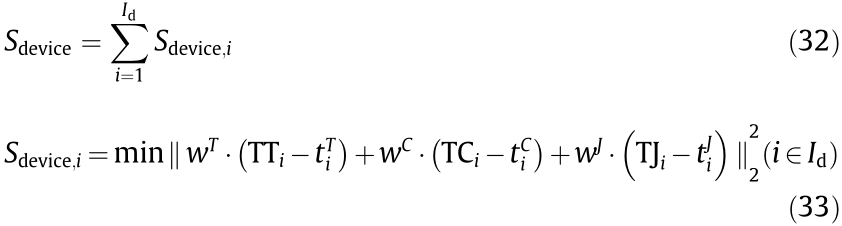
Taking vehicle 6 in Fig. 8 as an example, we obtain
To improve transparency and productivity, a knowledge base containing possible behaviors and rules must be established for configuration. The knowledge base is supposed to be filled automatically using advanced machine learning and artificial intelligence algorithms.
《7. A logistics case study in industrial parks with 5G V2X networks》
7. A logistics case study in industrial parks with 5G V2X networks
This section verifies the feasibility of the proposed collaboration framework. We applied an analytical case of an industrial park with 5G V2X networks, whose components include connected vehicles, sensors on OBUs and RSUs, edge servers, a cloud server, and gNBs. The gNBs provide 5G NR access. To determine the optimal schemes in industrial parks with 5G V2X networks, the vehicles are requested to deliver several cargos.
As shown in Fig. 9, the 5G network is designed to be applied in the logistics scenario of industrial parks, where V2X communications are involved. The 5G V2X networks can be used in a traffic accident or for congestion prediction, speed guidance, dynamic target localization, and other services. The details are shown in Fig. 10 and described in the following section.
《Fig. 9》

Fig. 9. Communications diagram of the logistics scenario of an industrial park.
《7.1. Operations and deployments in the application scenario》
7.1. Operations and deployments in the application scenario
This subsection describes the operations and deployments of the logistics scenario of an industrial park with the ETPV functions based on the device–edge–cloud collaboration, as shown in Fig. 10.
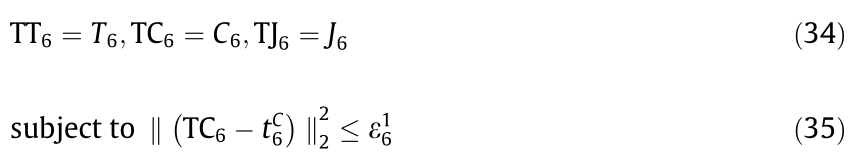
(1) Device side: The device side includes vehicles and sensors on OBUs and RSUs. Sensors first perceive the surrounding environment, and then transfer the information to the cloud and edge servers. As shown in Fig. 10, there are nine sub-areas in this industrial park, and the successor rules are shown in Table 2.
《Fig. 10》

Fig. 10. Operations and deployments in the logistics scenario of an industrial park.
《Table 2》
Table 2 Sub-areas and their successors according to the map.
(2) Cloud side: At the cloud side, the cloud server considers the environment from a global perspective. After obtaining vehicle and demand point conditions, the objective on the cloud side is to determine the optimal traveling sequences in sub-areas from a global point of view.
(3) Edge side: Based on the obtained traveling sequence, the edge servers plan paths for vehicles within their areas, such as the two route schemes in sub-area 5 shown in Fig. 10. Within each sub-area, the vehicle movement must be coordinated in order to avoid deadlocks and collisions. On the border of sub-areas 2 and 6, according to the obstacle perceived by the sensors, the edge servers will design barrier-free path segments.
《7.2. Comparison analysis for the ATC and All-in-One (AIO) methods in the application scenario》
7.2. Comparison analysis for the ATC and All-in-One (AIO) methods in the application scenario
The ATC method can be applied to evaluate and further configure the integrated schemes. To demonstrate the feasibility of ATC application, we will discuss the AIO method for comparison. The AIO integrates all the sub-schemes and treats the entire analysis process as a black box [43,44]. In our scenario, the AIO method indicates that the multifunction integrated schemes should be calculated together at the cloud server, whereas in the ATC method, the processes can be executed separately based on a hierarchical structure
According to the environmental perception and map construction function, the sub-area predecessors and successors can be obtained, as listed in Table 2. In Table 3, the unitless values of each ATC element are given. They are all relevant to the expense and are converted from the data obtained from the cooperation companies, where the ranges of the execution time, installation cost, and energy consumption are 0–80, 0–700, and 0–500, respectively.
《Table 3》
Table 3 Information on scheme options.

CLS: cloud-side set; ELS: edge-side set; DLS: device-side set; SA: the scheme from the departure point A to the next area; SB: the scheme from the last area to the destination point B.
The comparison experiments take the weighted indexes as the objective. The variables (tT , tC , tJ ) are presented and then adjusted by applying the configuration process. According to different application requirements, cost-, time- and energy-saving scheme patterns are tested, while setting the mid-level weight coefficient variables as (0.50, 0.25, 0.25), (0.25, 0.50, 0.25), and (0.25, 0.25, 0.50), respectively. Then the variables are changed from higher level to mid- and lower level.
The ATC and AIO simulations were carried out in MATLAB 2018b (MathWorks, USA) for comparison. The results were obtained by adapting an advanced intelligent algorithm, namely, the genetic algorithm. However, the encoding and evolution processes of the AIO and ATC methods are different. As shown in Fig. 11, the AIO method encodes the chromosome as a long one, which consists of the environmental perception and map construction, task allocation, and path-planning schemes. The vehicle movement scheme will be inserted in the actual scenario in future research. Then, the crossover, mutation, and selection processes of the long chromosome should be operated in a serial method. However, the ATC method encodes the chromosomes for schemes separately. Their evolving processes can be executed hierarchically, connecting each other through targets and responses. As the computing locations are different, the 5G V2X networks will play a vital role in saving the transmitting information. For better comparison, we set the population number as 50 and the number of iterations as 100 for both methods. In addition, the objective value of Eq. (5) is considered to be the fitness value; that is, the lower the values are, the better the obtained schemes are.
《Fig. 11》

Fig. 11. Encodings of the AIO and ATC methods.
As shown in Fig. 12, from a mid-level time-saving point of view, the task allocation scheme for the ATC and AIO methods show the same pattern, while the environmental perception and pathplanning schemes are different. The results in the second row of Table 4 show that the fitness value of the ATC method is not as optimal as that of the AIO method, which means that the latter is more suitable for the mid-level time-saving scheme. Furthermore, the weight coefficient variables of the mid-level patterns are selected as 0.50, 0.25, and 0.25 for this comparison, meaning that half the concerns will be on one index, and 25% will be on each of the other two.
《Fig. 12》

Fig. 12. Integrated schemes (mid-level time-saving pattern) for (a) the ATC method and (b) the AIO method.
Table 4 also shows the results of the two methods under three different patterns. For most conditions, the results of the ATC method are better than those of the AIO method. However, the higher and mid-level results of the time-saving pattern are the opposite. Here, ‘‘level” means the percentage of concerns on this index. For example, ATC has better performance on the lower level time-saving pattern, indicating that the ATC method finds the optimal integrated scheme without more time-saving concerns. In addition, as the levels decline, the deviations between the ATC and AIO methods decrease as well.
Table 4 also presents the mean runtime and mean deviation rate of the ATC and AIO methods. As the analytical case experiments are executed, the simulations are performed on a computer running Windows 7 (64 bit) with an Intel Core i7 processor and 16 GB random access memory (RAM). These results indicate that the ATC method can operate faster, but the results are not as stable as those obtained by the AIO method. These trends demonstrate the feasibility of applying the ATC method in the logistics scenario of an industrial park, where speed is important. Therefore, this method would be beneficial to future scenarios with response and feedback requirements. In addition, the results of the different scheme patterns and levels in ATC remain relatively stable, indicating that the three patterns with different level requirements can obtain their schemes through the ATC method without priority, from the mean runtime and mean deviation rate perspectives.
《Table 4》
Table 4 Comparison of the ATC and AIO methods under three patterns.

The bold format is to show the best scheme of this row.
Moreover, applying the ATC method for configuration and evaluation has the following advantages: ① Integration of the ETPV functions can be done for the collaboration schemes and to achieve hierarchical optimizations. The AIO method optimizes objectives in series; hence, the modeling is complex when considering the constraints between each method. Consequently, the total response time of the ATC method is shorter than that of the AIO method. ② Applying the ATC method in our proposed framework allows a dynamic and efficient configuration and evaluation of the integrated schemes, which are based on 5G V2X communication and device–edge–cloud collaboration. Although the AIO method could be applied for the same operations, it would require recorded data or previous calculations, which may not be able to keep up with the constant changes occurring in a real-world scenario. Once a disruptive event occurs, the AIO method must recalculate, so the efficiency of AIO is not as convenient or efficient as that of ATC. In summary, the ATC method is more suitable for the proposed framework with 5G V2X networks.
《8. Conclusions》
8. Conclusions
In this paper, a framework that integrates 5G V2X network communications with ETPV functions is proposed in order to increase the efficiency of logistics tasks in industrial parks. Furthermore, the proposed framework is designed as a collaboration framework, in which integrated schemes with better organization, adjustment, and flexibility can be obtained.
Device–edge–cloud collaboration is applied in the proposed collaboration framework, effectively managing the ETPV functions and achieving a rational workflow. Related functions are implemented in their most convenient servers, which saves transmission time and improves operational efficiency. Moreover, the objectives are designed for integrated schemes in the collaboration framework, where the ATC method is applied internally for configuration and evaluation.
The feasibility of the proposed framework is demonstrated through an analytical case study of the logistics scenario in an industrial park. We compared the ATC method with the traditional AIO method in terms of their time-, cost-, and energy-saving performance. The results showed that the objective values and mean runtime performance of the ATC method are superior to those of the AIO method. These results also reveal that the proposed collaboration framework could be configured for appropriate schemes with different requirements.
In our future work, we will include additional intelligent algorithms to optimize the functions and configuration of the framework; we will also assess the implementation of the proposed framework in real-world industrial park scenarios.
《Acknowledgements》
Acknowledgements
This research was supported by the China National Key Research and Development Program (2018YFE0197700).
《Compliance with ethics guidelines》
Compliance with ethics guidelines
Yanjun Shi, Qiaomei Han, Weiming Shen, and Xianbin Wang declare that they have no conflict of interest or financial conflicts to disclose.


 京公网安备 11010502051620号


