
《1. Introduction 》
1. Introduction
Given the recent rapid economic development in many emerging countries, including China, industrialization and urbanization processes are accelerating [1]. Meanwhile, the conflict between environmental pollution and economic growth has become increasingly problematic and, if not resolved, could retard the pace of both economic development and environmental protection in China [2,3]. After decades of rapid expansion, resulting in contaminated soil and water and severe haze, China is now steadily transforming its development philosophy from gross domestic production (GDP)-oriented growth to a tradeoff approach that puts greater effort into environmental protection. In recent years, China has been emphasizing high-quality green development [4]. Principles for an ecological civilization have been incorporated into the national constitution as the ideological concept for China’s environmental laws and regulations [5,6], substantially influencing the structure of Chinese society. A decade after its first survey [7], China’s Ministry of Ecology and Environment (MEE) released the Bulletin on the second national general survey of pollution sources (for fiscal year 2017) on 10 June 2020 [8,9]; this step can be taken as strong supporting evidence of the ecological civilization approach.
In 2010, China released the results of the first national general survey (for the fiscal year 2007), which focused on six million stationary pollution sources from the industrial, agricultural, and residential sectors and from centralized pollution control facilities, by gathering over one billion pieces of primary data. Seven years after the results of the first national general survey, the government launched a second survey (a once-a-decade event) to investigate the structure, scale, and distribution of pollution sources. Financed by a large grant (approximately 350 million USD), the second survey was jointly conducted by 15 state ministerial departments and was aimed at uncovering pollution threats in Chinese mainland. After three years’ efforts, the survey was completed by over 10 000 survey takers, with full cooperation from a vast number of respondents. The survey targeted nearly 3.6 million stationary (plus 300 million mobile) pollution sources. Over 150 million pieces of primary data on pollution generators were carefully gathered, 44% of which came from the main industrial sectors and approximately 53% of which came from five eastern provinces in China. The investigation revealed that environmental pollution, as indicated by several critical wastewater and air emission pollutants, has decreased with the steady growth of economic activities, and at a noticeably fast pace (Table 1) [7,8,10].
《Table 1》
Table 1 Comparison of total pollutants discharged or indicator versus economic indicators and population changes subject to the second national general survey of pollution sources in Chinese mainland between 2007 and 2017a .
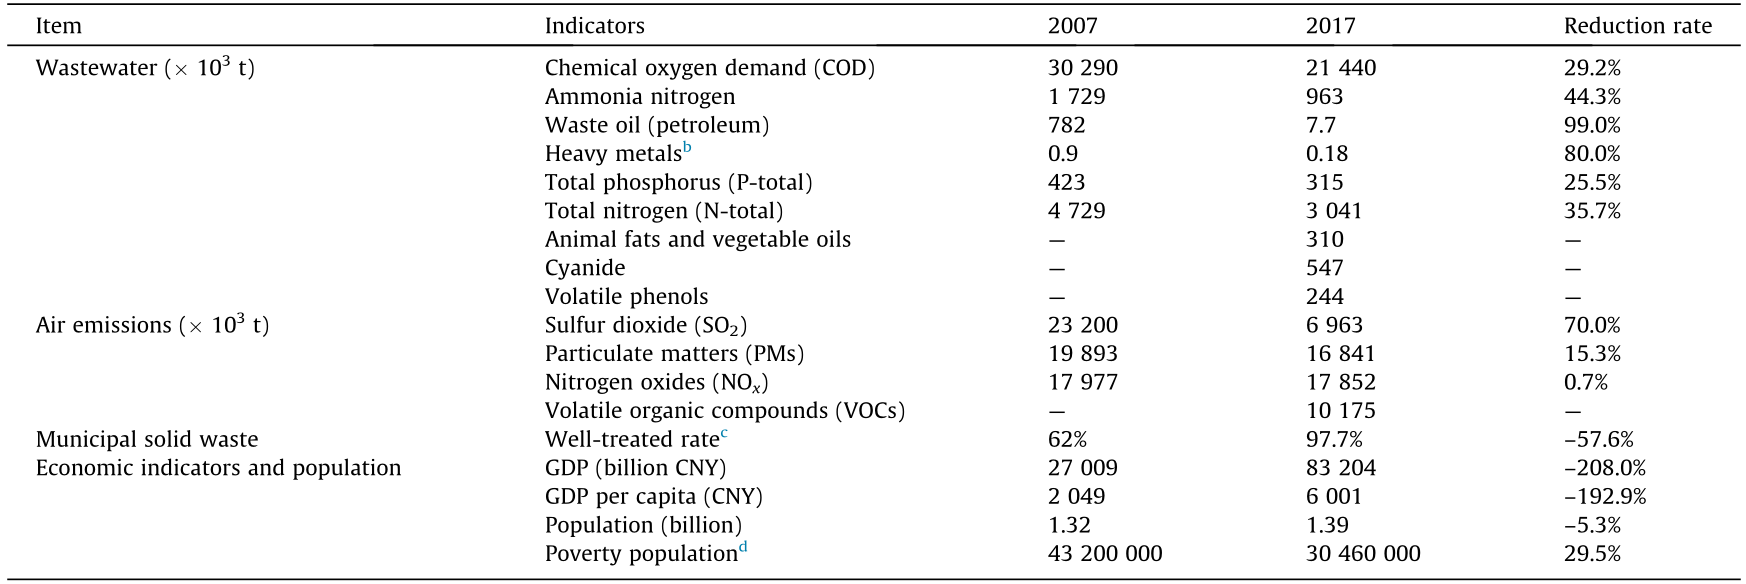
a Data sources: pollutant discharge data for 2007 and 2017 are from the bulletins of the first and second National General Surveys of Pollution Sources, respectively [7,8]; data on municipal solid waste, economic indicators, and population are cited from the National Statistical Yearbook in China [10].
b Includes only Cd, Cr, As, Hg, and Pb.
c Means by well-managed sanitary landfill and incineration.
d Poverty population in rural area, with an annual income lower than 2300 CNY per person after 2011, but lower than 1067 CNY in 2007 [10].
Wastewater pollutants mainly come from municipal sewage (residential sources) and agricultural practices (excluding heavy metals) (Fig. 1(a)). When examining the relationship between changes in typical wastewater pollutant discharges and pollution sources across Chinese mainland from 2007 to 2017, the decreasing rate of industrial sources has been rapid and significantly greater than those of agricultural and residential sources (Fig. 1(b); also see Section 2 below).
《Fig. 1》

Fig. 1. (a) Contributions of wastewater discharges or indicators (by fractions); (b) reduction rates for industrial (Ind), agricultural (Agri), and residential (Res) sources in Chinese mainland between 2007 and 2017. No survey data was available for P-total and N-total from industrial sources in 2007. * Cd, Cr, As, Hg, and Pb.
《2. Industrial sources》
2. Industrial sources
The second survey covered 2.5 million industrial enterprises or units engaged in industrial activities. As shown in Fig. 2(a), there were significant changes between 2007 and 2017 in the wastewater discharges in terms of chemical oxygen demand (COD) levels, ammonia nitrogen, waste, oil, and volatile phenol from the top three industrial generators (it is noted that the top three wastewater source of these pollutant indicators is different, and also may be not consistent in 2007 and 2017 of the same indicator). Although industrial restructuring was a major factor in this improvement, efforts toward cleaner production and environmental pollution discharge treatment also made significant contributions (Fig. 2(b)).
More specifically, the total production outputs of the pulp and paper, iron and steel, and cement manufacturing industries completed increases of 61%, 50%, and 71% from 2007 to 2017, and most enterprises have continued to lower their pollution outputs rapidly. Meanwhile, COD levels in the discharge from the pulp and paper industry, sulfur dioxide (SO2) discharge from the iron and steel industry, and nitrogen oxides (NOx) discharge from the cement industry have decreased by 84%, 54%, and 23%, respectively. Certainly, significant improvements in environmental pollution treatment capacity have helped to achieve these reduction targets [11] (Fig. 2(c)). China has made unremitting efforts toward environmental protection, including industrial structure adjustments, cleaner production, and environmental pollution discharge treatment.
We further examined the correlations among industrial pollution and socioeconomic factors, which were definitive (Fig. 3). Consistently positive correlations were found among industrial structures, industrial waste gas treatment facilities, and investment in industrial pollution control. A negative correlation was found between industrial structure and four indicators of industrial pollution (water consumption, COD levels, ammonia nitrogen, and SO2), indicating that industrial structure optimization can reduce the production of industrial pollutants. The correlation between environmental protection (i.e., exhaust gas treatment facilities or investment) and environmental discharges (COD levels, ammonia nitrogen, and SO2) was negative. With societal and economic development, the state has increased its investment in environmental protection; thus, good performance has been achieved in the treatment of industrial pollutants.
《Fig. 2》

Fig. 2. (a) Comparison of pollutant indicators (COD level, ammonia nitrogen, waste oil (petroleum), and volatile phenols) from the top three industrial wastewater source changes in 2007 and 2017; (b) industrial structure and scale versus typical wastewater and air pollution discharge changes; (c) growth rate of wastewater treatment capacity for all industries subject to the second national general survey of pollution sources in China between 2007 and 2017. Mft: manufacturing.
《Fig. 3》
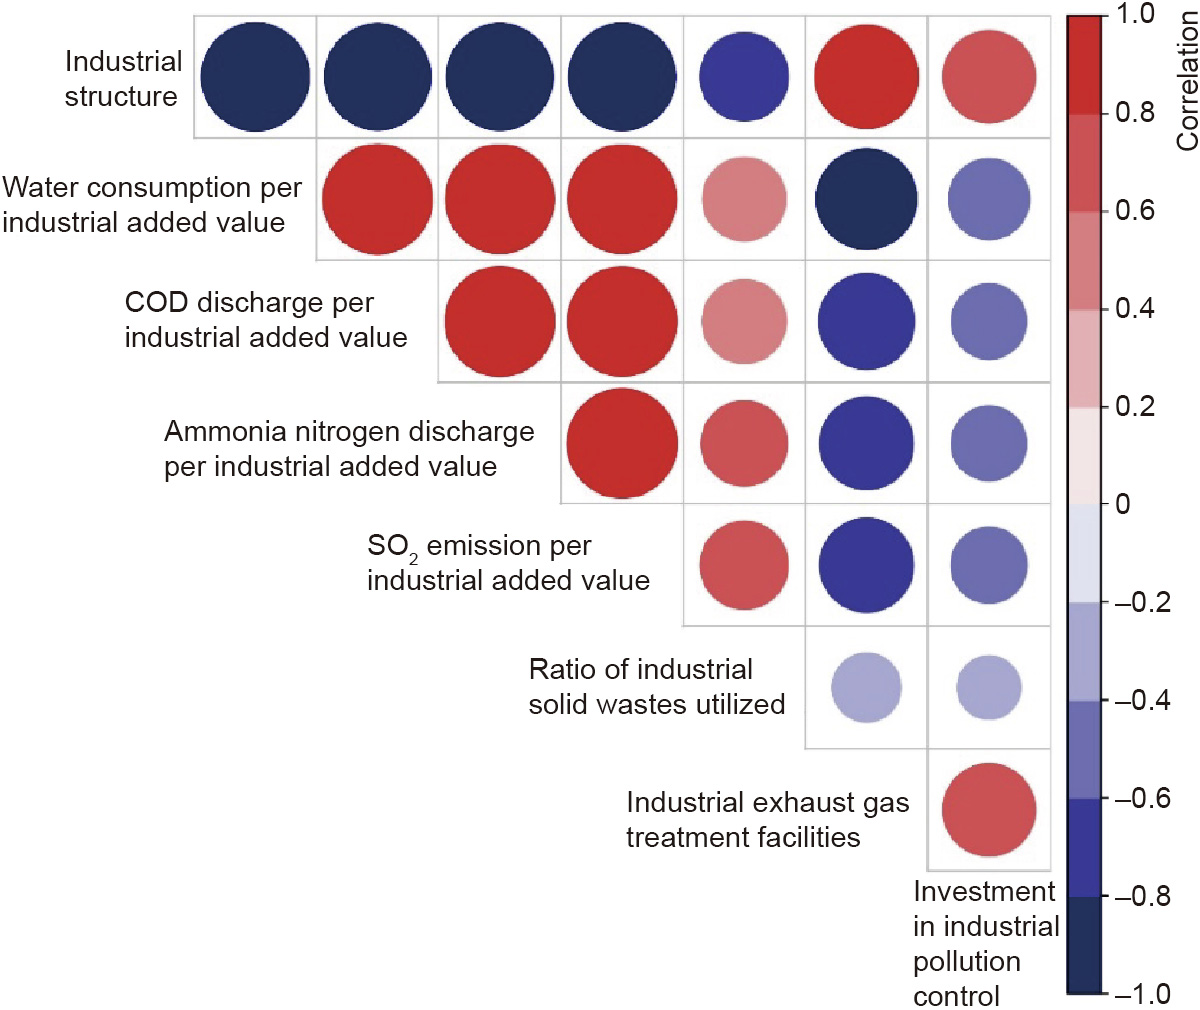
Fig. 3. Correlation analysis among industrial pollution and socioeconomic factors. The size of the circle means the intensity of the value.
《3. Agricultural sources》
3. Agricultural sources
The survey covered 3061 districts and counties involving the plantation industry, 2843 districts and counties involving the aquaculture industry, and 2981 districts and counties involving livestock and poultry husbandry. A household survey was conducted over 379 000 scaled livestock and poultry husbandry farms. Runoffs contaminated with agricultural pollutants flow into lakes, rivers, and oceans, resulting in water pollution and water shortages.
Although the total product outputs of grain, meat and eggs, and aquaculture (Fig. 4(a)) and the population of livestock husbandry (heads of pig equivalent; Fig. 4(b)) exhibited production increases of 32%, 17%, 52%, and 21%, respectively, the COD, P-total, and Ntotal nevertheless decreased significantly, with decreases ranging from 21% to 42% (Fig. 4(c)). Great improvements in environmental pollution treatment capacity helped to meet these reduction targets (Section 5). In fact, China has embarked on the road to establishing food security in its own way by: ① steadily increasing grain production capacity by improving the quality of arable land and protecting the environment and the efficiency of water resource utilization; ② increasing the public’s enthusiasm for farming; and ③ establishing a comprehensive food science and technology innovation system [12].
《Fig. 4》

Fig. 4. Agricultural development versus wastewater discharge from agricultural sources subject to the second national general survey of pollution sources in Chinese mainland between 2007 and 2017: (a) outputs of grain, meat & eggs, and aquaculture; (b) livestock population (pig equivalent (eq)); and (c) reduction rate of typical water pollutant indicators.
《4. Air pollution from mobile sources》
4. Air pollution from mobile sources
Mobile source survey subjects included automobile and offroad mobile sources (i.e., construction machinery, diesel-fueled agricultural machinery, shipping vessels, railroad diesel locomotives, and civil aviation aircraft). NOx, particulate matters (PMs), and volatile organic compounds (VOCs) from automobile sources accounted for 55.9%, 27.4%, and 82.1% of the total emissions of all mobile sources, respectively [8]. Alongside significant growth in the numbers of both private and public vehicles, and in the turnover capacities of road freight and passengers (Fig. 5(a)) of 544%, 380%, 95%, and 52%, respectively, PMs exhibited a sizeable reduction of 84% (Fig. 5(b)). However, there has been a minor increase in NOx of 8.3%. Both the increase in the electrification ratio (from almost zero in 2007 to 2.7% in 2017 and continuing to grow rapidly) and the regulated improvement of emission standards (from Euro 3 in 2007 to Euro 5 in 2017 for cars and light trucks) have helped achieve these ambitious goals. For example, higher electrification fractions can synergistically generate better air quality, as well as other ecological and health benefits. Sales of China’s electric vehicles have already achieved an approximately 50% share of the global output [13]. Higher automobile electrification proportions can synergistically contribute to better air quality, climate change mitigation, and health benefits. For example, a 27% electrification of private vehicles and a greater share of certain commercial vehicles have been estimated to significantly decrease the number of annual premature deaths nationwide by 17 456 by 2030 [12]. Moreover, a study by Peng et al. [14] implied that although coal-intensive electrification (i.e., 75% coal) would hardly mitigate greenhouse gas (GHG) emissions, it could still result in significant benefits in air quality and human health (41 000– 57 000 deaths avoided per year) in China. However, a relatively carbonized power supply (~50% coal) for electrification can achieve 14%–16% mitigation in GHGs emissions in comparison with a coal-intensive scenario. In addition, China’s efforts to promote emission-controlling technologies on new vehicles and to substitute old- and low-emission-standards private cars, buses, and trucks with new vehicles that meet the new standards have significantly decreased the emissions from mobile sources.
《Fig. 5》
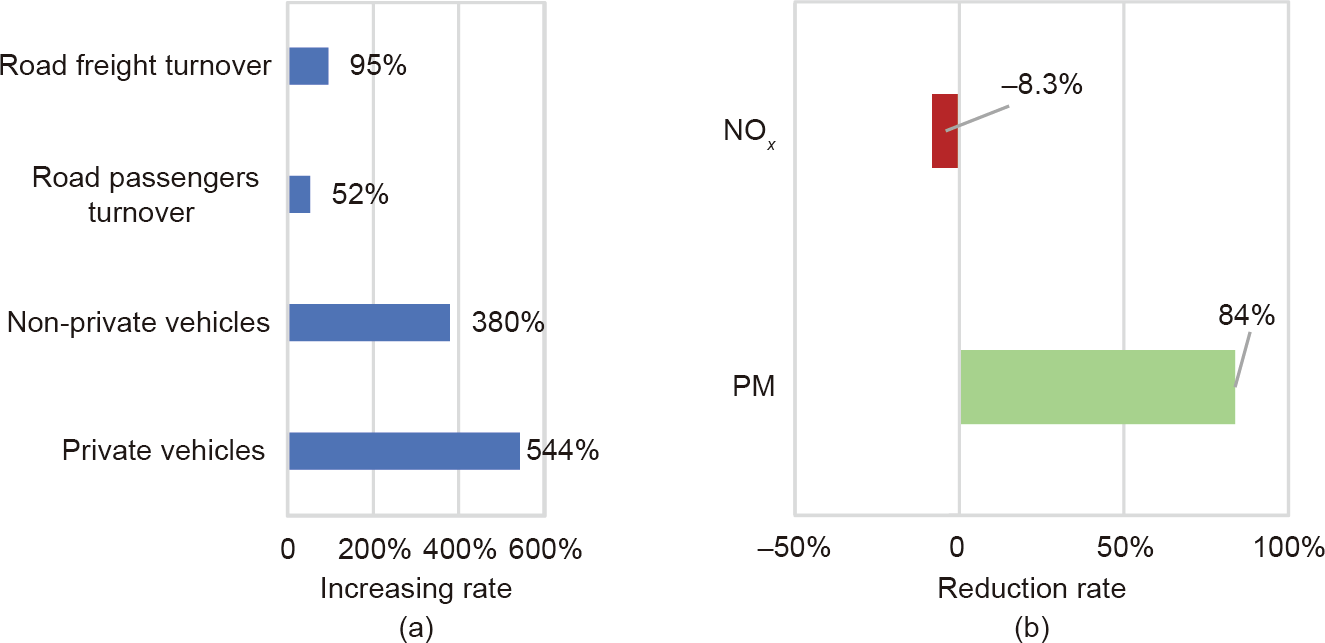
Fig. 5. Changes in the numbers of vehicles and road turnovers (freight and passengers) versus typical air pollutants from automobile sources subject to the national general survey of pollution sources in Chinese mainland between 2007 and 2017: (a) the increasing rate of vehicle numbers and road turnover; and (b) the reduction rate in typical air pollutants (NOx and PMs) from automobile sources. The 2007 survey only targeted automobile sources.
《5. Residential sources》
5. Residential sources
Both urban and rural areas were included in the second National General Survey of Pollution Sources, but rural pollution sources were excluded in 2007. The subjects of the survey in 2017 numbered 640 000, and included 446 000 administrative villages, 96 000 public boilers in non-industrial enterprises, 1 400 oil storage depots, and 96 000 gas stations. The surveys indicated that the COD level, ammonia nitrogen, P-total, and N-total discharges from wastewater in 2017 exhibited reduction rates of 11%, 53%, 31%, and 28%, respectively, in comparison with those in 2007— results attributable to the increase in municipal wastewater treatment capacities (more than double) and large growth in centralized wastewater treatment facilities for rural areas (from almost zero in 2007 to 67 000 in 2017). Meanwhile, China has made great efforts to promote treatment technologies for further improving the water quality of sewage treatment plant effluent discharge. In addition, China has emphasized the treatment of ‘‘black and smelly rivers” according to the Water Cleanup Plan released by the State Council Information Office of China in 2015. Almost 94.3% of these rivers have been treated since 2017, significantly improving the surface water quality in China. For example, the proportion of major rivers in China whose water quality (subjected to scientific surface water sampling) can be classified into Levels I–III (high quality, according to the Environmental Quality Standards for Surface Water of China (GB 3838-2002) has increased from 49.9% in 2007 to 71.7% in 2017. In contrast, the proportion of the water (rivers) classified as Level V (or below) has decreased from 23.6% in 2007 to 8.5% in 2017 [15].
《6. Implications and challenges》
6. Implications and challenges
The relationship between environmental quality and economic growth has been an international hot topic for decades. In terms of the Environmental Kuznets Curve (EKC) first put forward by Grossman and Krueger [16] and Panayotou [17], the relationship between economic development (income level) and environmental impact (degradation) follows an inverted U shape. The two rounds of surveys discussed herein found that China’s development mode has basically followed this curve. After years of heavy industrialization and urbanization, China’s environmental challenges are approaching a turning point.
While China has made great achievements in environmental protection, significant challenges remain [9], including the following: ① The annual discharge quantity of major indicators and pollutants, such as COD levels in the discharges, NOx, PMs, and VOCs, is still very high (between 10 and 20 Mt), which will inevitably hinder water and air quality improvement over the long term. ② Agricultural and residential sources are becoming the dominant contributors of COD, ammonia nitrogen, and waste oil (petroleum) discharge, while NOx discharge is mainly due to mobile sources. These pollutants are difficult to mitigate since a greater number of subjects (i.e., generators or spread sources) are involved in comparison with industrial sources. ③ Although the generation of industrial solid waste was maintained at the same level (3.8 × 10⁹ t) between 2007 and 2017, there has been almost no improvement in utilization rate (only approximately half of the total). In addition, the growth rate of industrial hazardous waste generation is approaching 44%, while the accumulated storage volume (as of the end of 2017) has reached 88.81 Mt, which certainly poses high risks to eco-environmental and human health. ④ Most importantly, there has been no fundamental change in China’s industrial structure, which is dominated by the heavy chemicals industry, or in its energy structure, which is dominated by coal (approximately 70%) [10]. The trend of emergency environmental pollution incidents has not fundamentally changed.
《7. Perspectives》
7. Perspectives
China is on its way to maintaining high-quality economic growth and will achieve zero absolute poverty (with an annual income higher than 4000 CNY per person) by the end of 2020. China will continue to push for sound coordination between social and economic development and ecological civilization, and will continually adjust the nation’s economic and energy structures, improve the use of national territorial space, optimize the industrial layout in different regions and economic zones subject to clean production and clean energy consumption, and encourage green and low-carbon ways of life. More specifically, greater efforts will be continually made toward the construction of an ecological civilization by adopting a series of far-sighted concrete measures, such as a greener economy incentive plan (costing an estimated 6–19 trillion USD) financed through the collection of an environmental tax [18], a Yangtze River protection plan, a ‘‘zero waste” cities program, and economic demonstration zones, thereby implementing the United Nations 2030 Sustainable Development Goals (SDGs).
In every location and at every level of development, countries are required to make choices between the conflicting goals of development and environmental sustainability. In terms of China’s experience, technological advancement and institutional innovation are extremely important in order to reduce pollution discharges and build an ecological civilization, rather than decreasing the pressures of industrialization and urbanization. These achievements will affect not only China, but the whole world [3]. Other national and local governments can adopt some of China’s ecological civilization practices within their own individual contexts.
《Acknowledgements》
Acknowledgements
Huabo Duan acknowledges financial support from the China National Key Research and Development (R&D) Plan (2018YFB1502804) the Scientific Research Fund of Introduced High Talent of Shenzhen University (827-000044), China.
《Authors’ contribution》
Authors’ contribution
Qi Qiao conceived the idea, Minghui Xie, Huabo Duan, and Lu Bai conceived the paper and collected the data, and Huabo Duan and Peng Kang drew the figures. All authors contributed to discussing the results and writing the paper.
《Compliance with ethics guidelines》
Compliance with ethics guidelines
Minghui Xie, Huabo Duan, Peng Kang, Qi Qiao, and Lu Bai declare that they have no conflict of interest or financial conflicts to disclose.


 京公网安备 11010502051620号


