
《1. Introduction》
1. Introduction
Investigations into the human gut microbiome have revealed the pivotal role of microbial communities in host health and disease [1]. However, most studied microbiomes are from defecated feces. Although this source provides powerful representations of gastrointestinal (GI) microbial ecosystems, it also has limitations. The fecal microbiome largely represents the final stage of transition of microbial communities along the GI tract, and numerous biogeographical analyses have revealed the distinction of the fecal microbiome when compared with those of different GI sections [2] where important biological processes take place. For example, the ileocecal microbiome, which is positioned in the middle part of the GI tract, has a relatively higher diversity than the fecal microbiome, although the two share almost all major taxa [3–5]. Since most bacteria and archaea in feces are from the lumen contents, the fecal microbiome is also a poor indicator of the mucosal microbiome— that is, the community that is positioned at the intimate interface of crosstalk with the host and that specifically interacts with the immune system [6,7]. In addition, continual fecal samples are rarely taken within short intervals; instead, such samples tend to be sampled daily due to human physiology. This prevents investigations into community dynamics with finer resolution, such as the diurnal cycles that have been observed in mouse models and have been shown to be closely linked to host physiological homeostasis [8–10].
Most time-series studies of the human gut microbiome avoid intentional challenges or stress, but perturbations in human gut microbiomes are common and impact their composition and functions [11,12]; furthermore, the ensuing shifts and dynamics are common indicators of community robustness under environmental stress. Extreme dietary changes have been linked to rapid changes in the human gut microbiome of healthy individuals [11,12], while longer term dietary habits have been associated with more generalized microbiome clusters known as enterotypes [13,14]. Gut microbiomes respond distinctively to many classes of antibiotics [15,16], and the effects may be detectable for months or years after the last drug administration, although such studies are usually retrospective [17–19]. Continuously monitoring the human gut microbiome after infection or medical treatment has been achieved for an interval of days after an event or intervention [20]. A study on fecal microbiota transplantation (FMT), which is one type of large-scale replacement of the gut microbiome, demonstrated that a foreign microbiome can partially establish and replace the original gut microbiome, resulting in a mosaic of the original and new gut microbiome [21]. Osmotic laxatives, which are widely used for treating constipation but are also administered before a colonoscopy, can remove large portions of the GI microbiome [22,23] They have also been linked with long-term alterations of the gut microbiota after a week of continuous administration in mice, with negative consequences on host intestinal and immunological homeostasis [8].
In clinical practice, the fecal microbiome usually recovers to the previous physical state within days after the cessation of osmotic laxatives in healthy individuals. Such a reconstruction process provides an opportunity to examine the dynamics and robustness of a healthy human gut microbiome and to quantify changes in the microbiome after a strong perturbation [24,25]. Colonic transendoscopic enteral tubing (TET) is a technique in which a tube is placed through the anus into the cecum or terminal ileum under endoscopy for the repeated administration of FMTs or medications [26,27]. However, the TET tube also allows the sampling of fluid in the intestine, and might facilitate analyses of the fecal microbiome after osmotic laxatives and of the ileocecal microbiome in situ. In the current study, we invited healthy volunteers who were administered with osmotic laxatives; we then examined the dynamics of reconstruction in the fecal microbiome on a daily basis and in the ileocecal microbiome at 12 h intervals by means of TET sampling and subsequent metagenomic, metatranscriptomic, and metabolomic analyses. This method also facilitated an investigation into fine-resolution dynamics that might contribute to host circadian rhythms.
《2. Material and methods》
2. Material and methods
《2.1. Preparation and procedure of TET》
2.1. Preparation and procedure of TET
For the duration of this study, the volunteers were asked to remain in Nanjing and were asked to continue eating their normal diet. All individuals had a mixed diet containing meat, vegetables, and carbohydrates. The volunteers were instructed to drink 2000 mL of polyethylene-glycol electrolytes osmotic laxatives solution for bowel preparation the night before the colonoscopy. A regular colonoscopy was performed under anesthesia. After an assessment of the whole colon, the TET tube (diameter 2.7 mm; FMT-DT-F-27/1350; FMT Medical, China), which is a device that is available on the market, was inserted into the cecum through an endoscopy channel. Two endoscopic clips (ROCC-D-26-195-C; Micro-Tech, China) were used to attach the loops of the TET tube to the cecum wall. The TET procedure was described in detail for the first time in our previous report in 2016 [26]. The distal TET tube was fixed onto the skin of the volunteer’s left hip with medical tape. Colonic TET has been recommended for the delivery of washed microbiota transplantation in clinical practice [28].
《2.2. Sample collection》
2.2. Sample collection
A flow chart of the sample collection is depicted in Fig. 1. Defecated feces and urine samples were collected before the administration of osmotic laxatives and then daily after the colonic TET until the TET tube fell off. All samples were stored at –80 °C before sequencing. Cecum fluid samples were collected twice daily (10:00 am and 10:00 pm) via the TET tube using a syringe. The volunteers were instructed to lie in the right lateral position when sampling was performed through the colonic TET tube. A total of 10–20 mL of 37°C normal saline (the standard for intravenous injection use) was quickly injected into the cecum through the TET tube for rapid flushing of the cecum wall. A 5 mL syringe was then used to suction the liquid from the cecum. The liquid was then retained for further processing in order to obtain the microbiome. This process was repeated as needed to collect a sufficient number of samples. The cecal fluid samples were stored at –80 °C within 30 min of collection.
This study was approved by the Institutional Review Board of the Second Affiliated Hospital of Nanjing Medical University ([2018]-IIT-004-LP-01). Written informed consent was obtained from all the volunteers.
《Fig. 1》
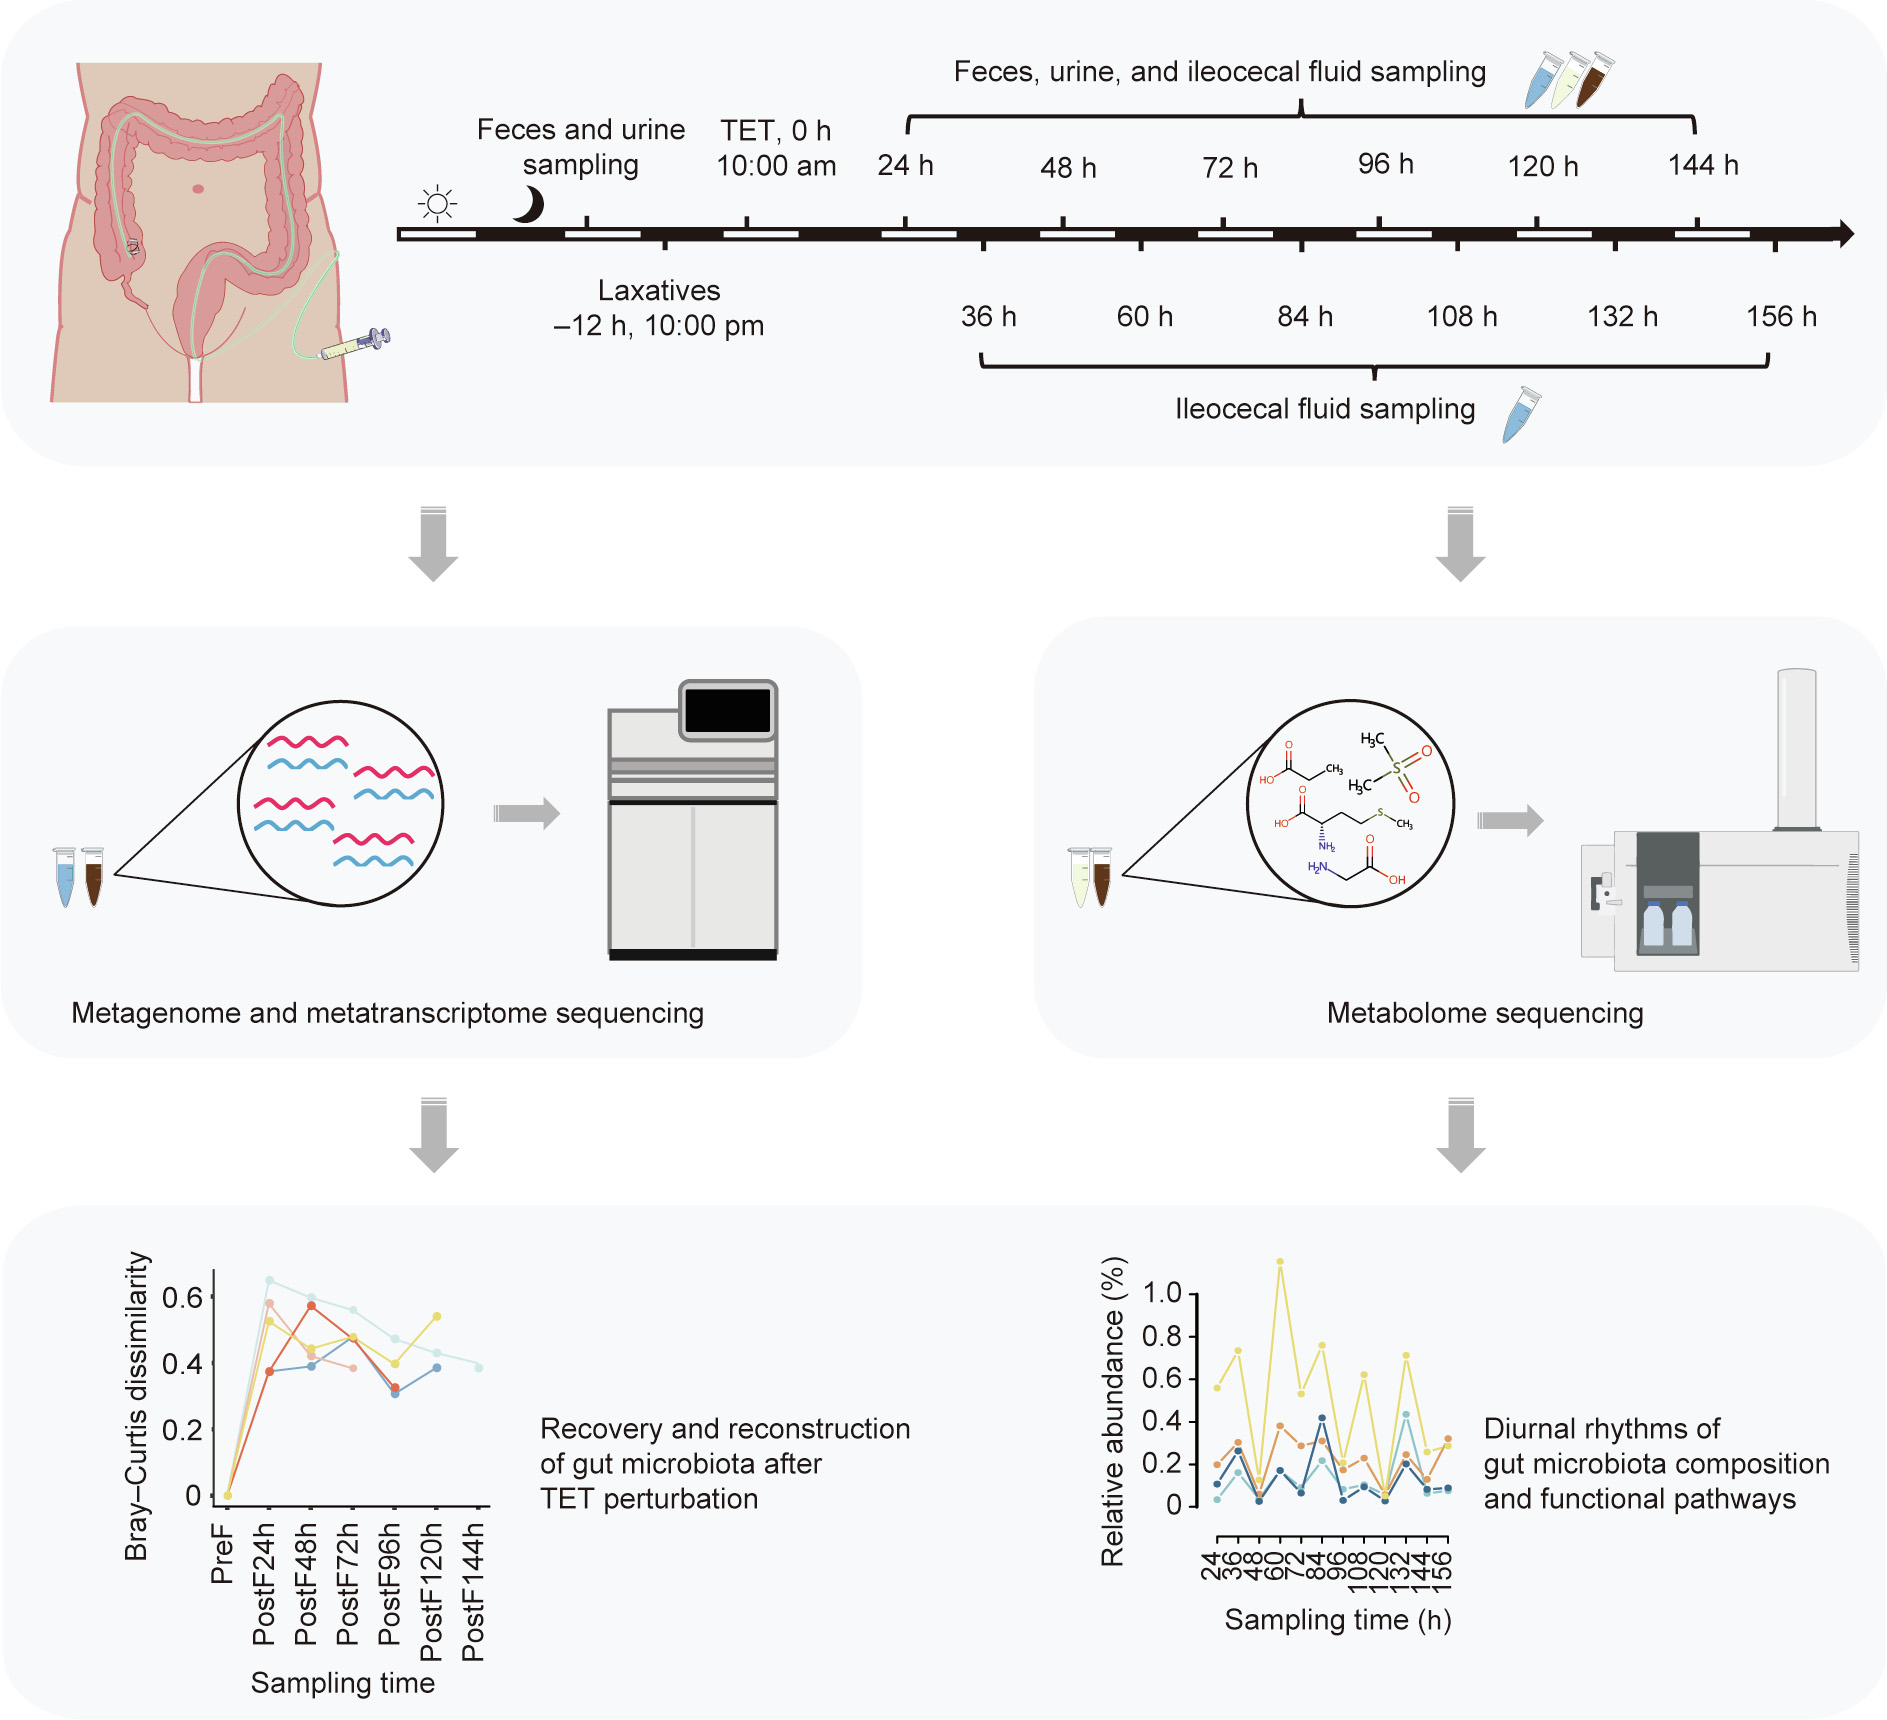
Fig. 1. Flow chart of sample collection, sequencing, and analysis. Blue: ileocecum; yellow: urine; brown: feces. PreF: fecal samples before osmosis; PostF: fecal samples after osmosis.
《2.3. Metagenomic and metatranscriptomic sequencing》
2.3. Metagenomic and metatranscriptomic sequencing
For metagenomic sequencing, the total gut microbiota genomic DNA was extracted from 28 thawed fecal samples and 43 ileocecal samples spanning all five healthy volunteers using the QIAamp PowerFecal DNA Kit (Qiagen, Germany) according to the manufacturer’s instructions. For metatranscriptomic sequencing, extraction and separation of the total RNA from the samples was performed with a RNeasy PowerMicrobiome Kit (Qiagen), in which ribosomal RNA (rRNA) was depleted using a RiboMinu Transcriptome Isolation Kit (Thermo Fisher Scientific, USA) that utilizes rRNAcomplementary probes to bind and remove rRNA. The extracted DNA and RNA were respectively sequenced using the Illumina NovaSeq PE150 platform.
《2.4. Taxonomic and functional profiling》
2.4. Taxonomic and functional profiling
The obtained raw sequencing reads were subjected to quality control by KneadData 0.7.2↑ , utilizing Trimmomatic 0.36 software to filter and remove low-quality reads and a decontamination algorithm to remove host reads [29]. After quality control, the samples averaged 29 million reads in metagenomic and metatranscriptomic data. For metagenomic analysis, a total of 121 million reads were used for all samples, subsetting to the same sampling depth; 70 million reads were used for metatranscriptomic analyses, with the same sequencing depth for each sample.
↑ http://huttenhower.sph.harvard.edu/kneaddata
Taxonomic and functional profiling were performed utilizing MetaPhlAn2 2.0 and HUMAnN2-0.11.2. Integrated reads were analyzed using HUMAnN2-0.11.2, following the metagenomic and metatranscriptomic analysis method reported by Franzosa et al. [30]. MetaPhlAn2 2.0 was used to perform species annotation and species abundance calculations for intermediate files generated by Bowtie2 comparison during functional and compositional analysis [31,32]. Datasets generated by HUMAnN2 and MetaPhlAn2 were combined for species composition and metabolic pathways; all of the 28 fecal samples and 43 ileocecal samples were used for downstream analyses.
In brief, 220 and 245 bacterial species and 445 and 411 identified pathways were obtained from the metagenomic data of ileocecal and fecal samples, respectively. For the metatranscriptomic data, 78 and 84 bacterial species and 269 and 231 identified pathways were discovered in the ileocecal and fecal samples, respectively.
《2.5. Identification and quantification of metabolites in fecal and urinary samples》
2.5. Identification and quantification of metabolites in fecal and urinary samples
The metabolites in the feces and urine samples were identified and quantified by referring to the published studies of Dunn et al. [33] and Hou et al. [34]. ACQUITY UPLC HSS T3 1.8 μm (2.1 mm ×100 mm; Waters, Ireland) chromatographic columns and an Agilent 1290 II UPLC-Sciex QTOF 5600 PLUS (USA) liquid chromatograph–mass spectrometer was used, with all analyses being performed in electrospray ionization (ESI) mode under the following conditions: curtain gas, 35; ion spray voltage, 5500 V (positive ion mode); ion spray voltage, –4500 V (negative ion mode); temperature, 450 °C; ion source gas 1, 50; and ion source gas 2, 50.
《2.6. Statistical analysis》
2.6. Statistical analysis
2.6.1. Metagenomic and metatranscriptomic analysis
Principal coordinate analysis (PCoA) of the composition and function datasets of the fecal and ileocecal samples was conducted using vegan 2.5-6↑ , an R package for ecological data analysis. Bray– Curtis dissimilarities between the fecal samples taken after osmotic laxatives treatment and that taken before the treatment were calculated separately for each volunteer and visualized using ggplot2 3.2.1 , an R package for the visualization of long matrix data. For the ileocecal samples, due to certain similarities between the microbiome diversities and the fecal samples, the fecal samples taken before treatment were used as probable substitutes for ileocecal samples taken before the osmotic laxative treatment.
↑ https://cran.r-project.org/web/packages/vegan/
https://cran.r-project.org/web/packages/ggplot2/
2.6.2. Profiling the diurnal rhythm of the human gut microbiome
In the ileocecal samples collected every 12 h, metabolic pathways with diurnal oscillations were selected by monitoring changes in relative abundance with a specific strategy. First, the values for the relative abundance of each metabolic pathway at each sampling time minus that at the previous sampling time were calculated, and signs of all the values as an array for each pathway in every individual were extracted. Two arrays with the same length were then generated by assigning alternative signs—that is, ‘‘+, –, ...” or ‘‘–, +, ...”—as reference arrays. Finally, sample arrays were compared with the reference arrays. Those that matched exactly (100%) with either of the two reference arrays were selected, and the pathways they represented were also selected.
Bacterial species with a diurnal rhythm were selected using this strategy and supplemented with additional statistical tests aimed at detecting rhythmic oscillations. Box–Pierce and Ljung– Box tests were performed on the species and metabolic pathways with strict diurnal fluctuations in relative abundance selected previously in order to check whether these data had lagged autocorrelation. Autocorrelation coefficients were calculated and visualized for the metabolic pathways or species with significance using the autocorrelation function (ACF). Thereafter, external regressors were calculated using the Fourier function in the R package forecast 8.13, and the autoregressive integrated moving average (ARIMA) model was constructed using the arima.auto function and used to predict the changes in the following two days. In addition, the volatility was decomposed into rhythmic and trending fluctuations using the stl() function in R.
2.6.3. Metabolome analysis and correlation to the metagenome/ metatranscriptome
The obtained metabolomics datasets were analyzed by partial least squares discriminant analysis (PLS-DA) to identify metabolites dissimilated by osmotic laxatives treatment in the fecal and urinary samples, with a variable important in projection (VIP) bigger than 1 and a p value of less than 0.05 (VIP > 1, p < 0.05). PLS-DA was performed using mixOmics 6.6.2 [35], an R package for omics data analysis. The corr.test function in R package psych 1.8.12↑ was used to calculate correlation coefficient matrices between omics, including the correlation between species and metabolic pathways in the metagenome and metatranscriptome with metabolites in feces or urine. Intersected pairs with the same correlation in fecal and urinary samples were then selected, and these correlation coefficient matrices were visualized using cytoscape 3.7.2 [36]. To investigate the reconstruction state at the metabolite level, a dynamic analysis of the metabolome of the feces and urine samples was also performed using the Bray– Curtis distances of the metabolome, taking the pre-laxative sample as the reference point. Furthermore, using Mantel tests for the Bray–Curtis dissimilarities of the metabolites in the fecal and urinary metabolomes and those of the species and pathways in the fecal metagenomes and metatranscriptomes, the correlations between the omics data were respectively evaluated. Enrichment analysis of the metabolites that differed in the fecal metabolome after osmotic laxatives was performed using the enrichment analysis model of MetaboAnalyst .
↑ https://cran.r-project.org/web/packages/psych/
https://cran.r-project.org/web/packages/psych/
《3. Results》
3. Results
Five healthy volunteers underwent osmotic laxatives treatment, colonoscopy, and colonic TET. Fecal samples were collected before laxative treatment as well as every day while the TET remained in place (Fig. 1). Ileocecal fluid was sampled twice daily at 10:00 am and 10:00 pm, by washing off with normal saline solution and collecting through the TET using a syringe. Metagenomic DNA and RNA were extracted from a total of 28 fecal samples and 43 ileocecal samples across the five volunteers and were subjected to metagenomic and metatranscriptomic sequencing and analysis [37,38] on an Illumina NovaSeq platform. Urine samples were also collected from each volunteer and, together with fecal samples from the same sampling time, were subjected to metabolomic analysis.
《3.1. Fecal and ileocecal microbiomes are distinct in composition and functionality》
3.1. Fecal and ileocecal microbiomes are distinct in composition and functionality
The analysis of the standing (DNA-based) and active (RNAbased) microbial communities revealed their distinct features, both in the defecated fecal samples and in the ileocecal samples. In the fecal samples collected before the osmotic laxative treatment, the standing communities were largely dominated by the species Alistipes putredinis, Bacteroides stercoris, Prevotella stercorea, Faecalibacterium prausnitzii, and Bacteroides massiliensis, among others. However, these microbial species/genera were not always the majority in the RNA reads; rather, the species/genera Ruminococcus torques, Methanobrevibacter, Subdoligranulum, Faecalibacterium prausnitzii, and Ruminococcus obeum were more prominent in the RNA-based surveys (Fig. 2(a) and Figs. S1 and S2 in Appendix A). This observation was extended with the functional pathway analysis. The most abundant pathways in the metagenomic DNA were adenosine ribonucleotides de novo biosynthesis, uridine monophosphate (UMP) biosynthesis, uridine diphosphate(UDP)-N-acetylmuramoyl-pentapeptide biosynthesis II (lysine-containing), UDP-N-acetylmuramoyl-pentapeptide biosynthesis I (meso-diaminopimelate containing), and peptidoglycan biosynthesis I (meso-diaminopimelate containing) (Fig. 2(a) and Figs. S1 and S2). Adenosine ribonucleotides de novo biosynthesis remained the highest in abundance in the metatranscriptomes, but glycolysis IV and III, starch degradation V, and gluconeogenesis I were also present among the pathways with the highest RNA reads (Fig. 2(a) and Figs. S1 and S2). A similar distinction was observed in the ileocecal samples and the post-colonoscopy fecal samples. DNA-based profiling of microbial composition or functionality, although widely used, does not represent the actual status of the microbial communities in terms of activity. Many of the abundant taxa in the DNAbased profiling were less active in terms of RNA transcription, while many metabolic pathways with high expression in the metatranscriptomic analysis had very low expression in the metagenomic (DNA) reads (Figs. 2(b) and (c)). The reverse was also true for many bacterial species as well as metabolic pathways.
The ileocecal microbiome collected in situ revealed essential differences in taxonomy and functional pathways compared with the fecal microbiome, and these differences were mainly embodied by the actively transcribed genes (metatranscriptome). At the DNA level, the species composition and pathways were very similar between the ileocecal samples and the defecated fecal samples, with no significant differences (Figs. 2(d)–(g)). However, at the transcriptome level, the fecal and ileocecal samples displayed marked differences. Species such as Collinsella_unclassified, Bifidobacterium longum, Bifidobacterium adolescentis, and Ruminococcus obeum were highly active in the ileocecal microbiome, while Parabacteroides_unclassified, Subdoligranulum_unclassified, Faecalibacterium prausnitzii, Bacteroides uniformis, and Bacteroides vulgatus were extremely active in the fecal materials (Figs. 2(d)–(g) and Fig. S3 in Appendix A). In terms of functional pathways, adenosine ribonucleotides de novo biosynthesis, glycolysis IV and III, and guanosine ribonucleotides de novo biosynthesis were enriched in the fecal microbiome RNA, suggesting high metabolic activities, while gluconeogenesis I, the superpathway of β-D-glucuronide and D-glucuronate degradation, the superpathway of sulfur amino acid biosynthesis, transfer RNA (tRNA) processing, and deoxythymidine diphosphate (dTDP)-N-acetylthomosamine biosynthesis were potentially the most active in the ileocecal samples (Fig. S3).
《Fig. 2》
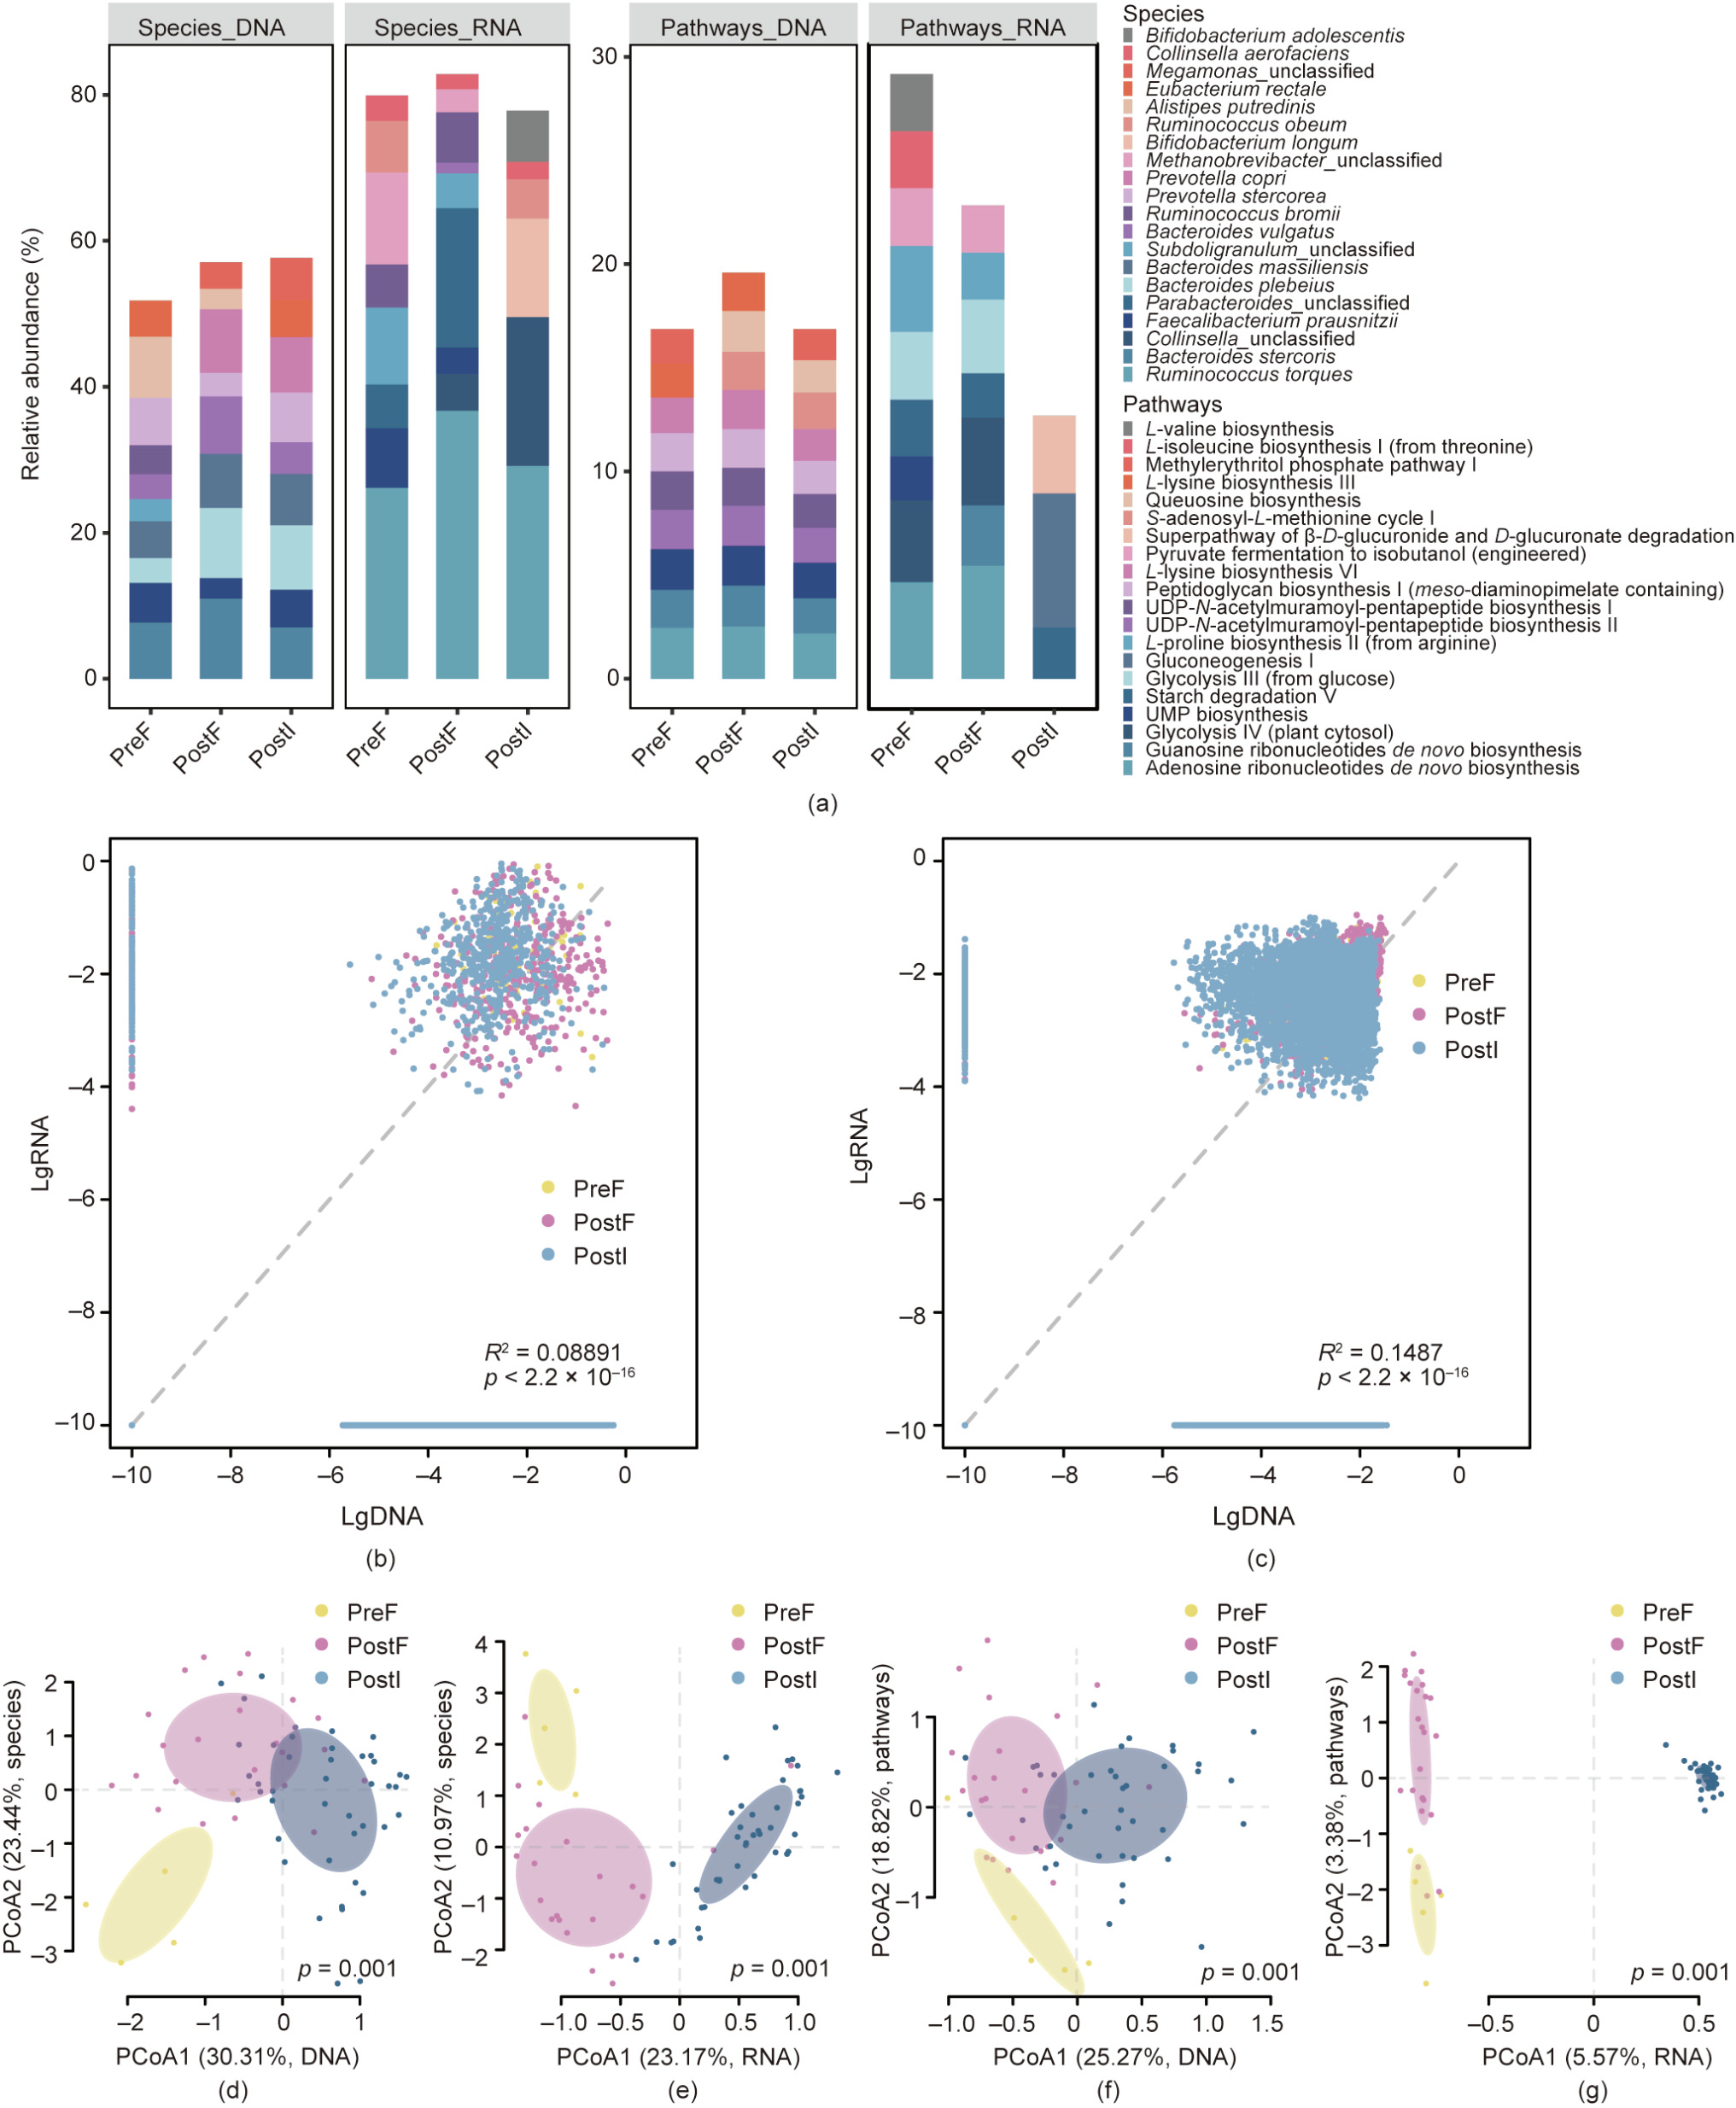
Fig. 2. The fecal and ileocecal microbiomes are distinct in composition and functionality. (a) Overview of the relative abundance of composition at the species and functional pathway levels (different colors represent different species or pathways). Relative abundances are the average of individuals in the three groups: fecal samples before osmosis (PreF, n = 5), fecal samples after osmosis (PostF, n = 23), and ileocecal samples after osmosis (PostI, n = 43). The four panels show the species composition from the metagenome (species DNA) and metatranscriptome (species_RNA), and functional pathways from the metagenome (pathway_DNA) and metatranscriptome (pathway_RNA), respectively. Contributions of species and pathways were scaled to sum to 1 respectively within each group. Comparison of metagenome- vs metatranscriptome-derived species (b) composition and (c) functionality. The x-axis and y-axis show the decadic logarithm of the relative abundance of species and pathways in the metagenome (lgDNA) and metatranscriptome (lgRNA); a tiny number (10–10) was added before in order to avoid negative infinite values. (d)–(g) Dissimilarity between defecated feces and ileocecal samples in species composition and functional pathways. PCoA of metagenomic (DNA) and metatranscriptomic (RNA) composition at the (d, e) species and (f, g) functional pathways levels. Samples were grouped by sampling time and location (PreF, PostF, PostI), with ellipses showing 95% confidence intervals (CI). UMP: uridine monophosphate; UDP: uridine diphosphate.
《3.2. The fecal microbiome dynamically reconstructs after osmotic laxatives treatment》
3.2. The fecal microbiome dynamically reconstructs after osmotic laxatives treatment
After strong perturbation with osmotic laxatives, the fecal microbiome of each volunteer (H1, H2, H3, H4, and H5) showed dynamic recovery or reconstruction in the days following colonoscopy. The earliest fecal samples taken after laxative treatment displayed differences in bacterial composition compared with the pre-treatment samples at both the DNA and RNA levels. In the DNA-based analysis, the predominant taxa in the earliest postlaxative fecal samples were Bacteroides plebeius, Bacteroides massiliensis, Bacteroides stercoris, Bacteroides vulgatus, and Megamonas_unclassified, compared with Alistipes putredinis, Bacteroides stercoris, Prevotella stercorea, Faecalibacterium prausnitzii, and Bacteroides massiliensis in the pre-treatment fecal samples (Fig. 3(a)). This finding indicates either different sensitivity to laxatives among the different species in the process of being washed out, or variations in growth or recovery within the short period between laxative treatment and the next episode of defecation. According to the active members suggested by the RNA analysis, the most active species in the fecal samples changed from Ruminococcus torques, Methanobrevibacter_unclassified, Subdoligranulum_unclassified, Faecalibacterium prausnitzii, and Ruminococcus obeum before the laxative treatment to Parabacteroides_unclassified, Ruminococcus torques, Collinsella_unclassified, Collinsella aerofaciens, and Dorea longicatena immediately after the laxative treatment (Fig. 3(a)). The laxatives also caused shifts in the abundances of metabolic pathways in the DNA- and RNA-based analyses. The most abundant pathways changed immediately after the cessation of laxative treatment to adenosine ribonucleotides de novo biosynthesis, UDP-N-acetylmuramoyl-pentapeptide biosynthesis II (lysine-containing), queuosine biosynthesis, guanosine ribonucleotides de novo biosynthesis, and S-adenosyl-L-methionine cycle I in DNA, and to adenosine ribonucleotides de novo biosynthesis, guanosine ribonucleotides de novo biosynthesis, glycolysis IV and III, and starch degradation V in RNA (Fig. 3(a) and Fig. S1).
In the subsequent days, the fecal metagenomes and metatranscriptomes showed trends of recovery in four out of five volunteers, as demonstrated by the tendency of the metagenomic and metatranscriptomic dissimilarities with the original profiles to decrease with time, especially in terms of species (Figs. 3(b)–(e)). However, the recovery was not significantly improved in the RNA compared with the Bray–Curtis dissimilarity. This finding might be due to the greater change in the RNA and to a certain lag in RNA recovery, which resulted in the recovery not being as obvious as that observed in the DNA (Figs. 3(b)–(e)). Both PCoA and compositional analysis demonstrated that, after drifting further from the pre-laxative fecal microbiome at certain time points, the postlaxative fecal microbiome tended to become more similar to the pre-laxative microbiome (Figs. S1 and S4 in Appendix A). Interactions between the members of the microbiome, as well as host physiological factors, could contribute to the recovery of the microbiome after perturbation, and could confer individualized resilience to the microbial communities.
《Fig. 3》
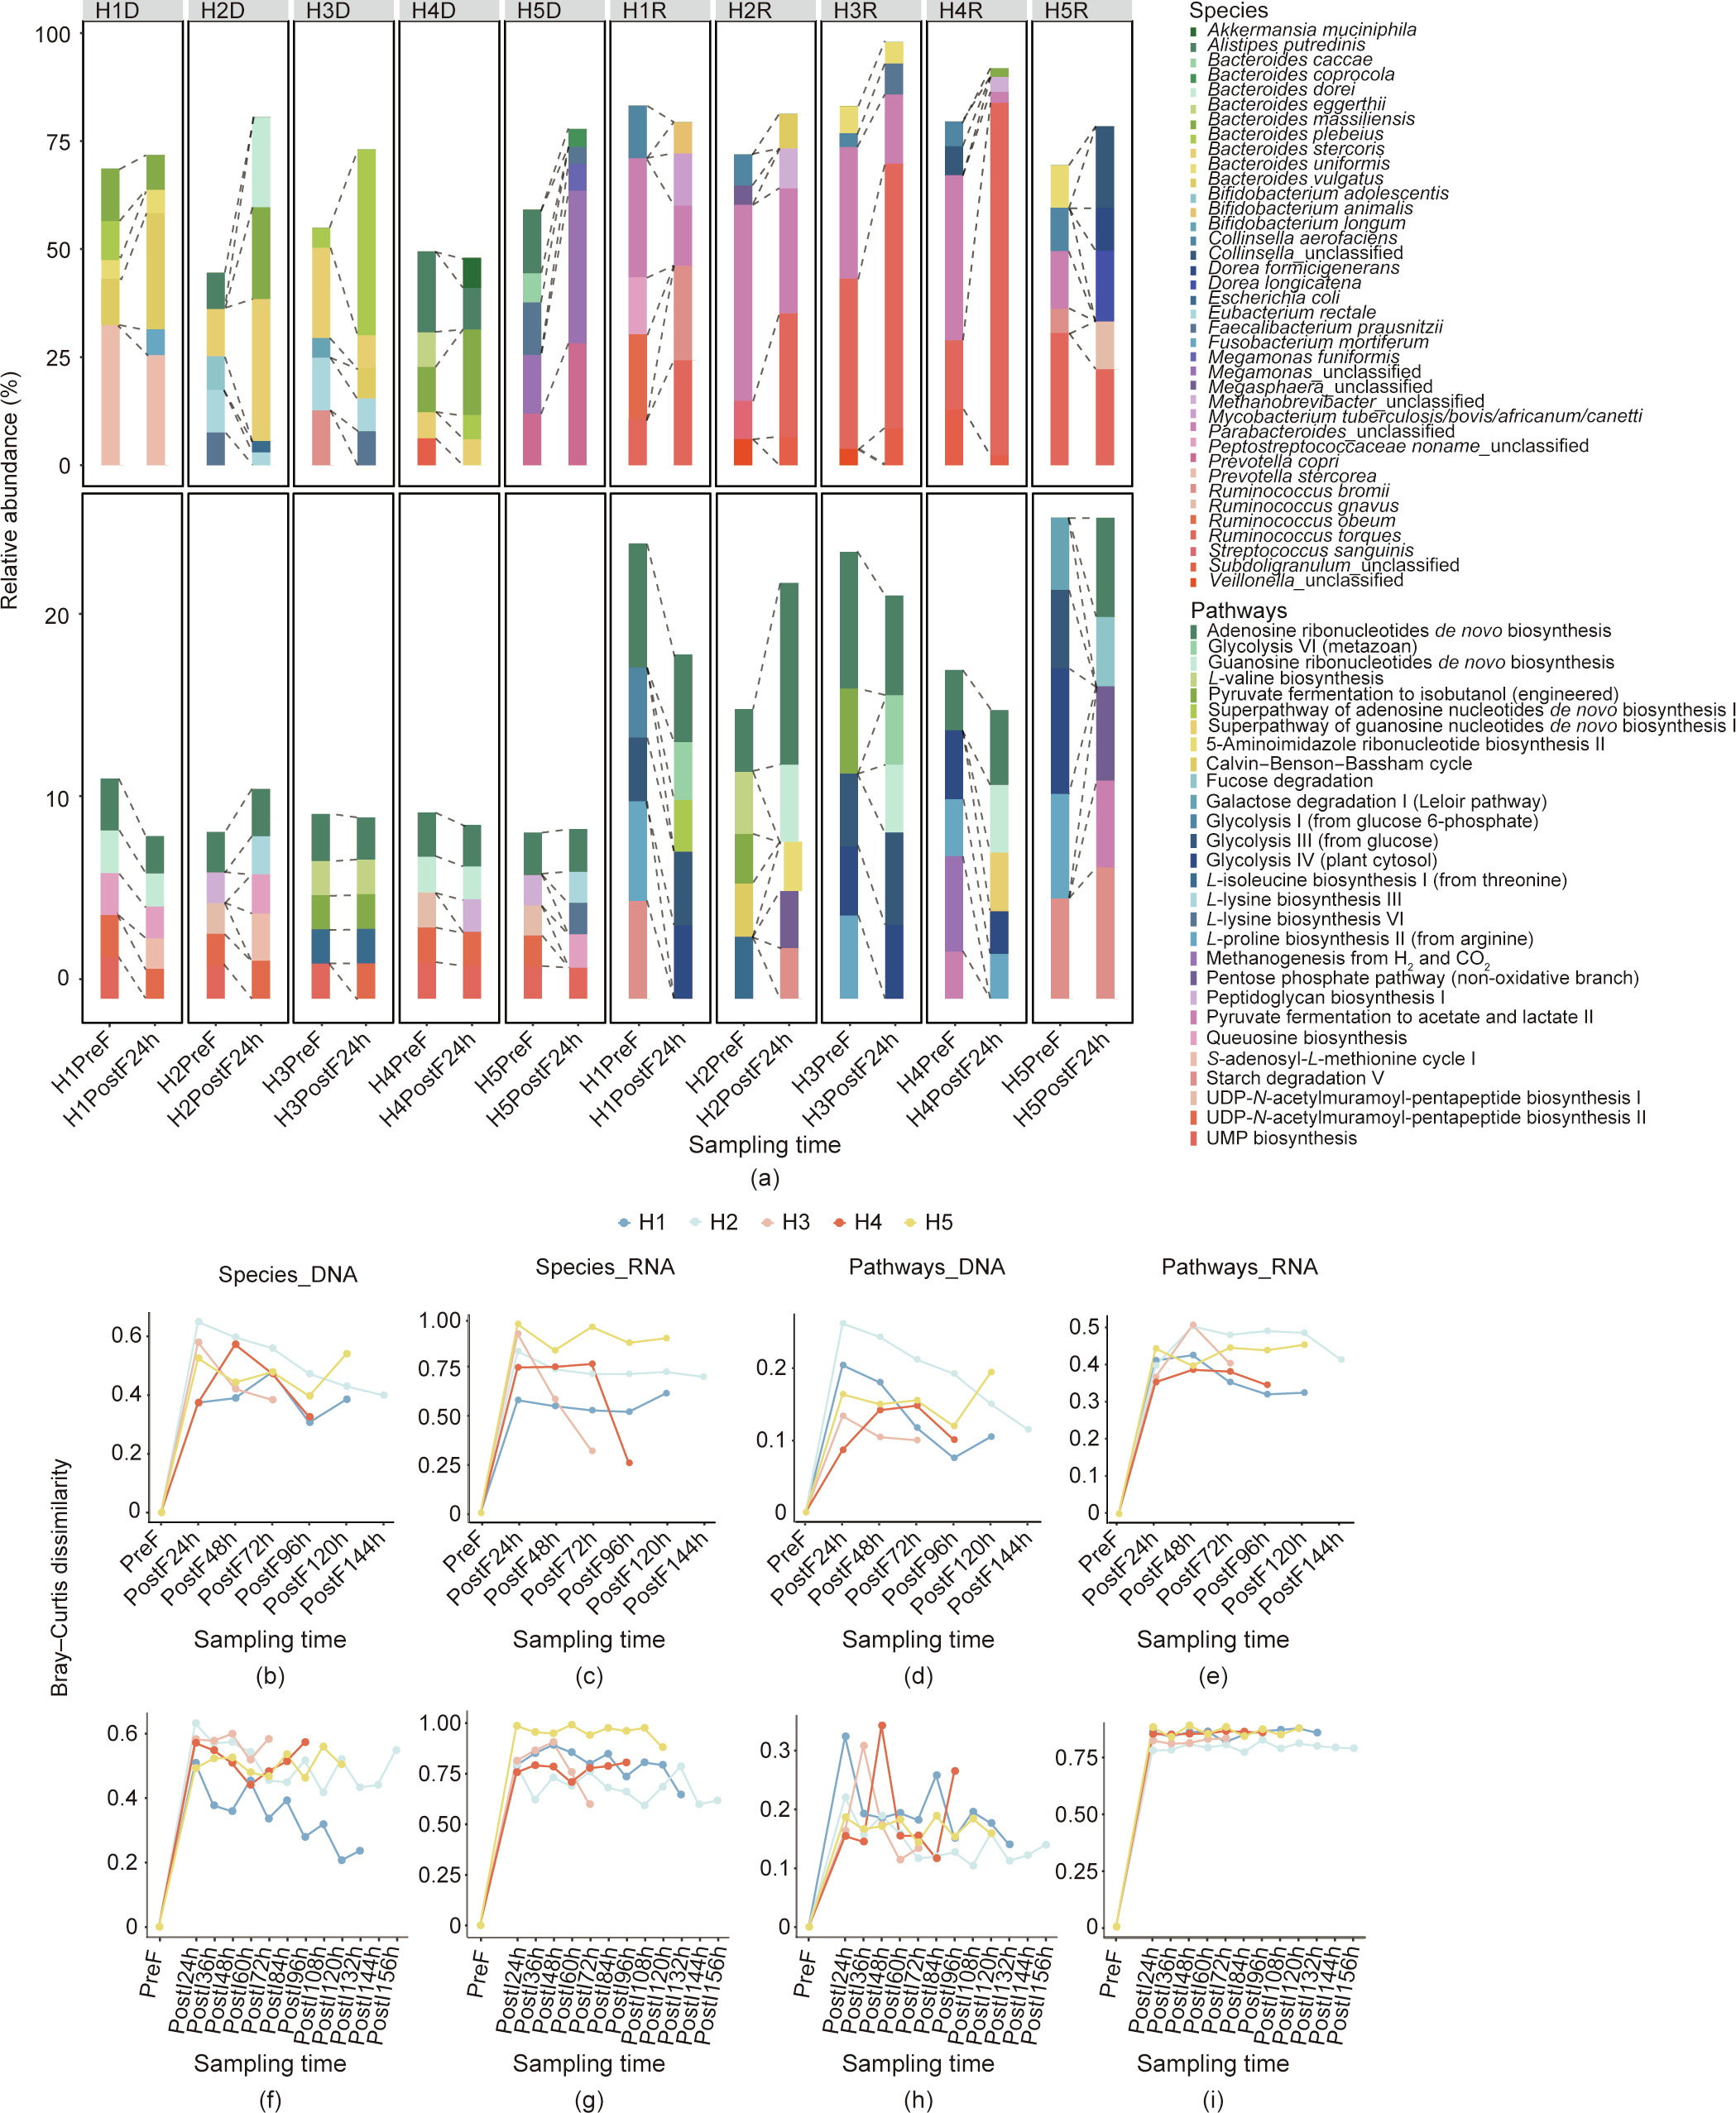
Fig. 3. Dynamic reconstruction of the composition and function of fecal and ileocecal samples after exposure to osmotic laxatives. (a) The fecal microbiome before osmosis was distinct from those early after laxative treatment at the species and functional pathway levels. Different colors represent different species/pathways in each volunteer (H1, H2, H3, H4, and H5) in two groups: before osmosis (PreF) and 24 h after colonoscopy (PostF24h), based on four datasets comprising the species of the metagenome (species_DNA) and metatranscriptome (species_RNA) and the pathways of the metagenome (pathway_DNA) and metatranscriptome (pathway_RNA). The HnD and HnR represent DNA and RNA of individual n, respectively. (b–i) Bray–Curtis dissimilarities of the (b–e) fecal and (f–i) ileocecal samples after osmotic laxatives (PostF, PostI) compared with the fecal samples before interference (PreF) in each individual. The HnD and HnR represent DNA and RNA of individual n, respectively.
As the ileocecal microbiome could not be analyzed without colon cleaning and the TET tube remaining, there was a possibility that measuring the recovery of the microbiome using the ileocecalcontent samples might not be feasible. However, the dynamics of the ileocecal microbiome were prominent. Furthermore, the shorter sampling intervals meant that the dynamics of the ileocecal microbiome could be studied with finer temporal resolution than the fecal samples. Although distinctions in composition and functionality were observed within different sample types (i.e., ileocecal contents and fecal samples) within the same individual and the same day, the ileocecal microbiome mirrored the dynamics of the fecal microbiome to a large extent. This finding indicates that the shifts in the ileocecal microbiome eventually contribute to the dynamics observed in fecal samples (Figs. 3(f)–(i)). The major species determined by DNA and RNA analysis, as well as the dominant metabolic pathways, showed comparable changes in the ileocecal samples and defecated fecal samples. Examples of major species included Bacteroides plebeius, Bacteroides stercoris, and Faecalibacterium prausnitzii in the metagenomic reads, and Collinsella aerofaciens and Ruminococcus torques in the metatranscriptomic reads (Fig. S2). Examples of dominant metabolic pathways included the pathway of adenosine ribonucleotides de novo biosynthesis, S-adenosyl-L-methionine cycle I, UDP-N-acetylmuramoyl-pentapeptide biosynthesis II, and L-lysine biosynthesis VI in the metagenomic reads and starch degradation V in the metatranscriptomic reads (Figs. S1 and S2). The relative dissimilarity between the ileocecal samples and the pre-laxative defecated feces samples of each volunteer showed decreasing trends in three out of five individuals in at least one of the metagenomic/metatranscriptomic measures, mirroring those of the fecal samples collected after laxatives treatment (Figs. 3(f)–(i) and Fig. S5 in Appendix A). It can therefore be assumed that the ileocecal microbiome was also recovering to a similar taxonomical/functional composition as that before the laxative treatment, thus demonstrating its own resilience toward perturbations [24].
《3.3. Bacterial composition and functional pathways show diurnal rhythms in the cecum》
3.3. Bacterial composition and functional pathways show diurnal rhythms in the cecum
The ability to collect human ileocecal microbiome samples at 12 h intervals provided a unique opportunity to investigate the diurnal rhythms of the GI microbiome in situ. Using the ileocecal samples collected at 10:00 am and 10:00 pm each day through the TET tube, the dynamics of the species composition and metabolic pathways at both the DNA and RNA levels could be investigated. First, based on a taxonomical estimation of the different bacterial species in the metagenomic and metatranscriptomic analyses, the overall community structure had detectable differences between the samples collected during the day and those collected in the evening (Figs. 4(a)–(d) and Fig. S2). Furthermore, different species showed regular oscillations in terms of DNA abundances in each volunteer, among which a few were shared by two or more individuals, including Streptococcus parasanguinis, Dorea longicatena, Propionibacterium acnes, Ruminococcus lactaris, Lachnospiraceae bacterium_5_1_63FAA, and Haemophilus haemolyticus. While the DNA-based abundance estimation revealed cellnumber shifts of different taxa, the RNA-based analysis demonstrated that many bacterial species had a diurnal rhythm in terms of overall gene expression (or transcription activities): namely, Coprococcus comes, Bifidobacterium pseudocatenulatum, Ruminococcus lactaris, Ruminococcus gnavus, Ruminococcus torques, Subdoligranulum_unclassified, and Mitsuokella_unclassified. The bacteria with circadian rhythms had some differences among the volunteers; for example, a relatively low number was found in H2, probably because the greatest number of ileocecal samples was collected from this individual. This finding also indicated a personalized trait of microbiome dynamics in the ileocecal microbiome, as well as different reproduction rates/metabolic activities of various taxonomical groups.
《Fig. 4》
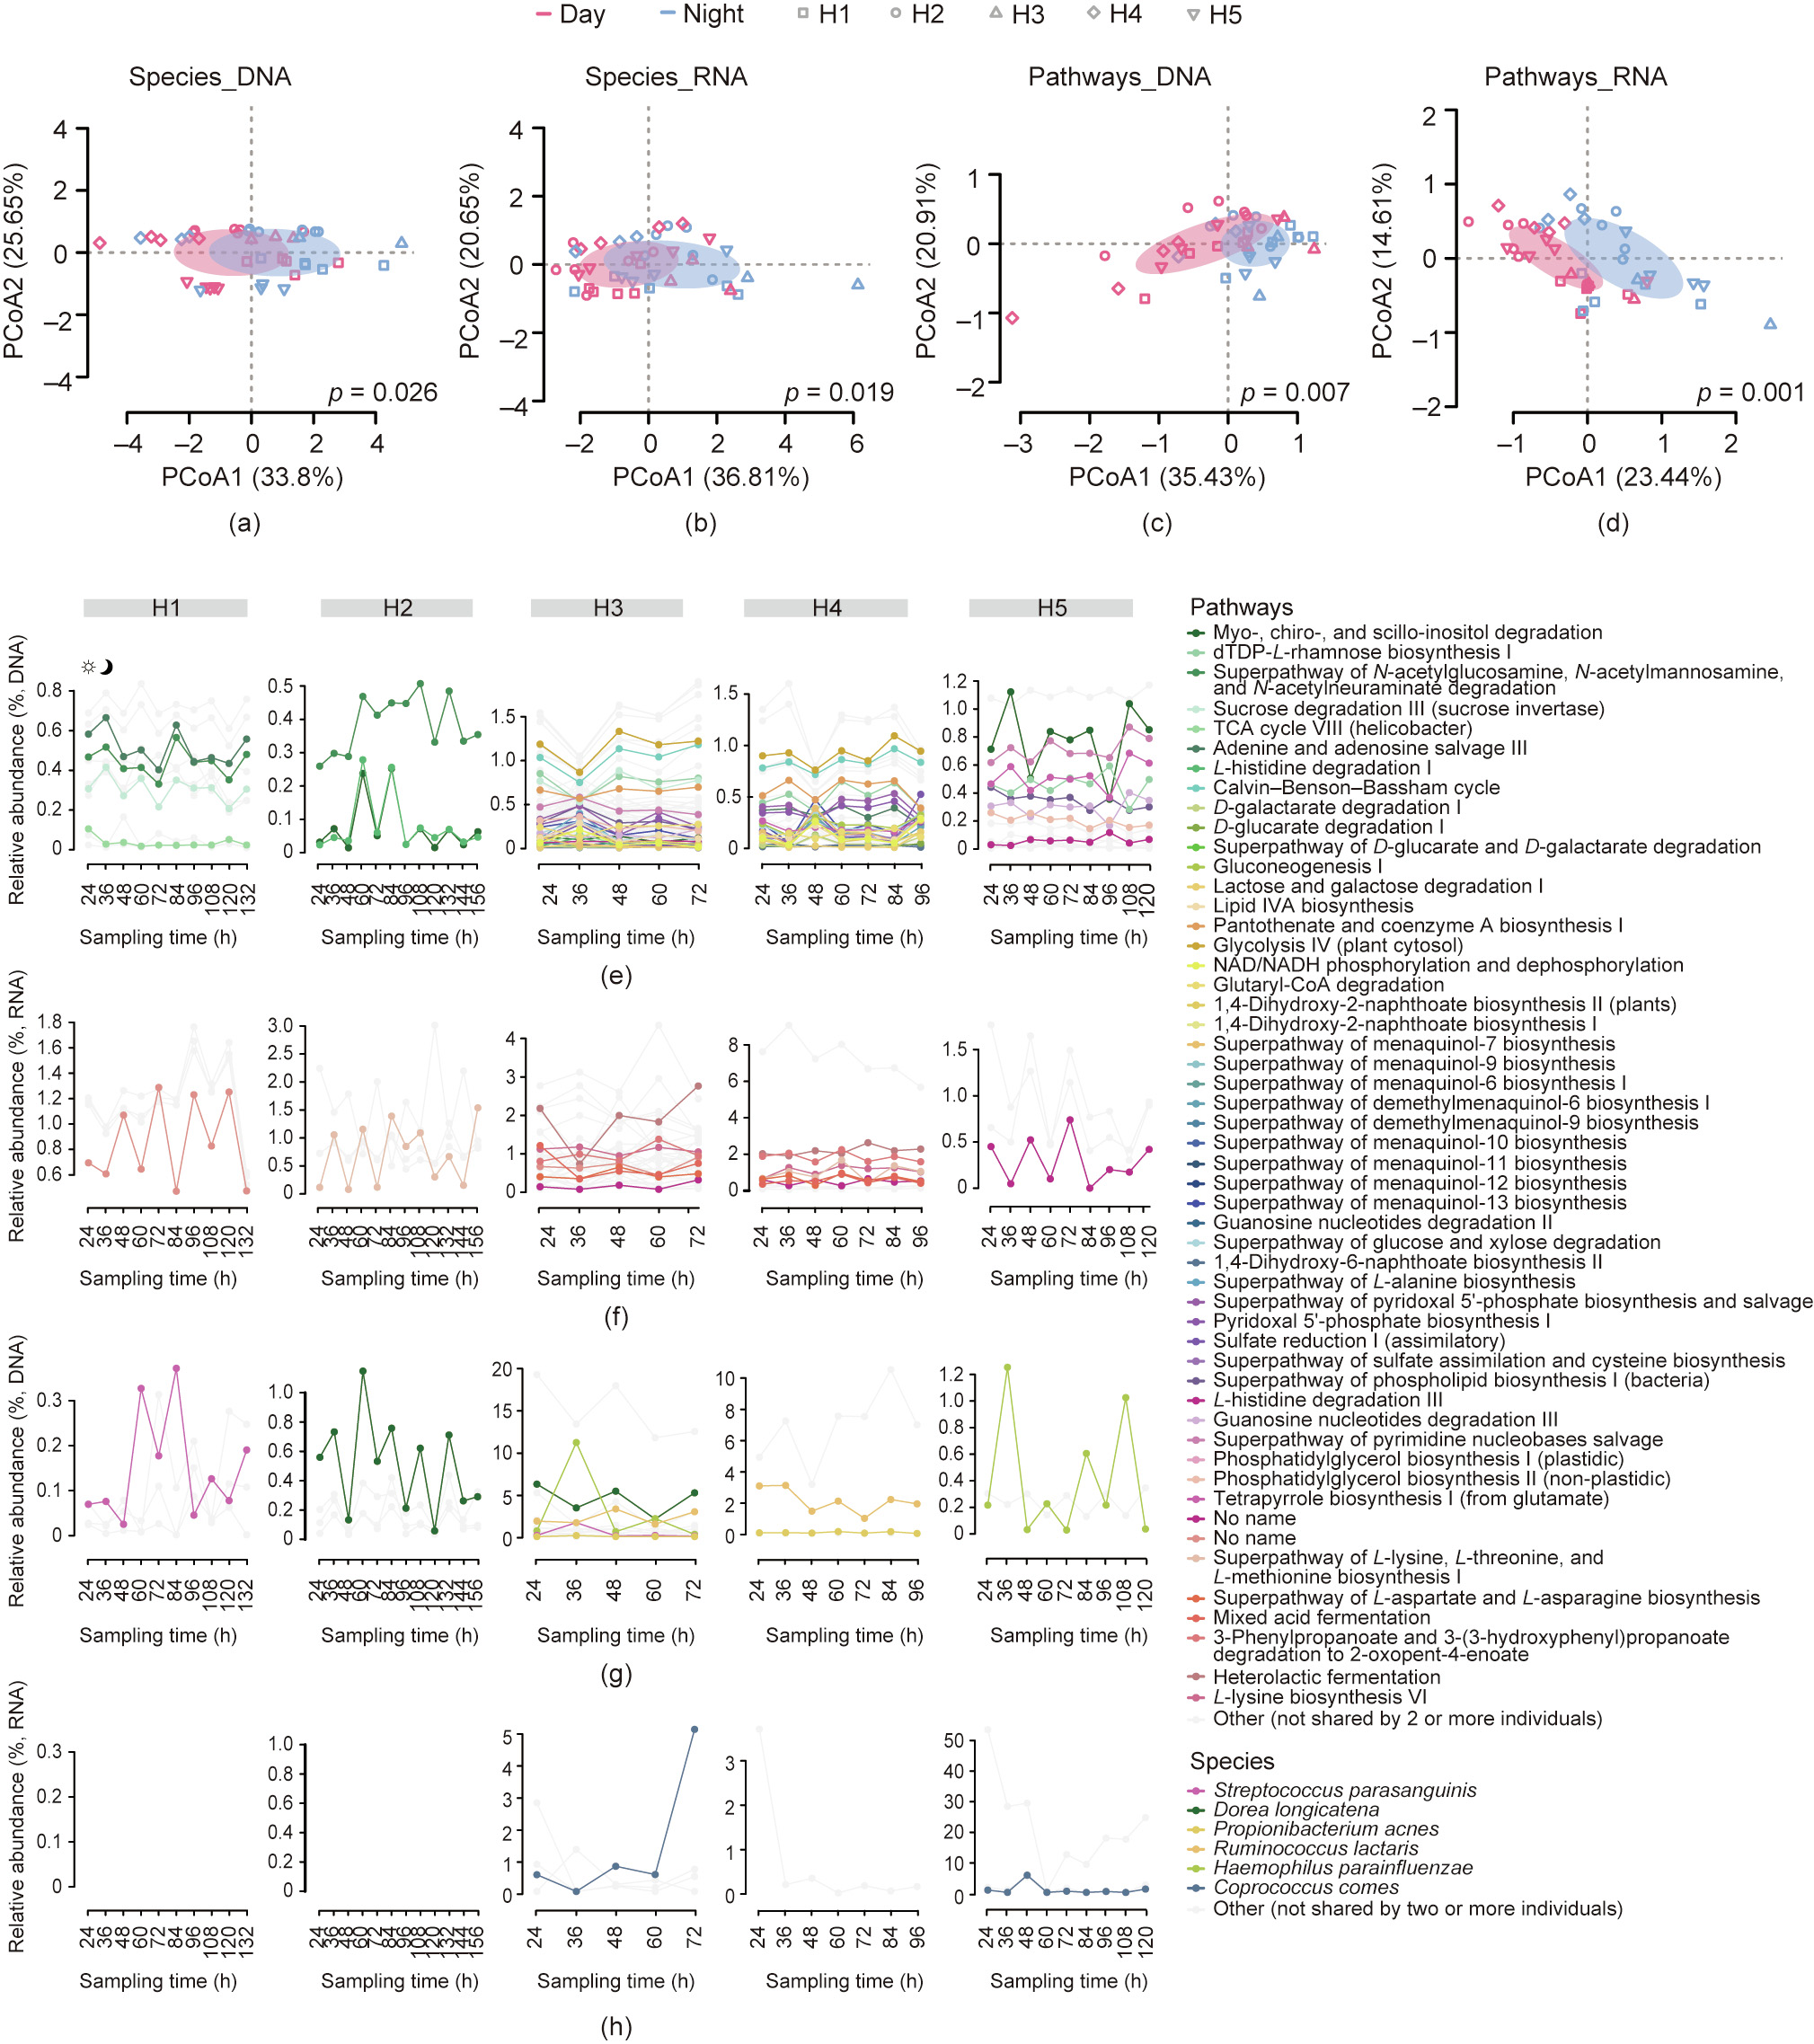
Fig. 4. Circadian rhythm of functional pathways and bacterial species of the gut microbiome in ileocecal samples. (a–d) PCoA showing the diurnal difference in the species and function of the gut microbiome in ileocecal samples. Ellipses show 95% CI and the different colors of ellipses represent different sampling times (day and night). The shapes of the different dots represent different individual volunteers. (e, f) Metabolic pathways and (g, h) species with diurnal oscillations were identified by monitoring changes in their relative abundance. Pathways and species shared by two or more individuals are colored, while those with diurnal oscillations in only one individual are gray. TDP: thymidine diphosphate; TCA: tricarboxylic acid cycle; lipid IVA: a tetra-acylated lipid A as an intermediate in the lipid A biosynthetic pathway; NAD: nicotinamide adenine dinucleotide; NADH: nicotinamide adenine dinucleotide.
Further screening, primarily within the transcriptomic data, was executed to identify pathways with prominent diurnal rhythms. This analysis again uncovered individualized oscillation patterns of metabolic pathways, revealing 4–41 of such pathways in each volunteer (Figs. 4(e)–(h)). Among these pathways, purine nucleobases degradation I, coenzyme A biosynthesis II, L-lysine biosynthesis I and III, 5-aminoimidazole ribonucleotide biosynthesis I, sucrose degradation III (sucrose invertase), and the superpathway of L-lysine, L-threonine, and L-methionine biosynthesis II were shared by two or more volunteers, while the rest were confined to only one individual.
In contrast, the corresponding metabolic pathways in the metagenomic data did not show a significant oscillation pattern, suggesting that regulation of transcription in those pathways underlies the diurnal pattern, rather than an increase or decrease in genetic copies in the metagenome. A general category of metabolic pathways was related to the production of short-chain fatty acids (SCFAs), including pyruvate fermentation to acetate and lactate II, and acetyl-CoA fermentation to butanoate II, as well as acetylene degradation in the metatranscriptome data. These metabolic pathways were generally more active during the daytime and less active at night.
The time-series lagged autocorrelation test demonstrated the significance of the diurnal rhythms; 17 and 15 metabolic pathways with significant circadian rhythms were detected in the DNA and RNA, respectively. Of these pathways, the most significant among the different volunteers were L-isoleucine biosynthesis II, myo-, chiro-, and scillo-inositol degradation, the superpathway of guanosine nucleotides degradation, the superpathway of Clostridium acetobutylicum acidogenic fermentation, and L-glutamine biosynthesis III in the DNA samples; and coenzyme A biosynthesis II, chorismate biosynthesis from 3-dehydroquinate, phosphopantothenate biosynthesis I, the superpathway of L-aspartate and L-asparagine biosynthesis, and purine nucleobases degradation I in the RNA samples (Fig. 5 and Fig. S6 in Appendix A). Most of these metabolic pathways are related to coenzyme A biosynthesis (seven out of ten), which contributes to the biosynthesis of SCFAs. Furthermore, there were significant changes in species associated with the function of SCFA biosynthesis, such as Propionibacterium acnes.
《Fig. 5》
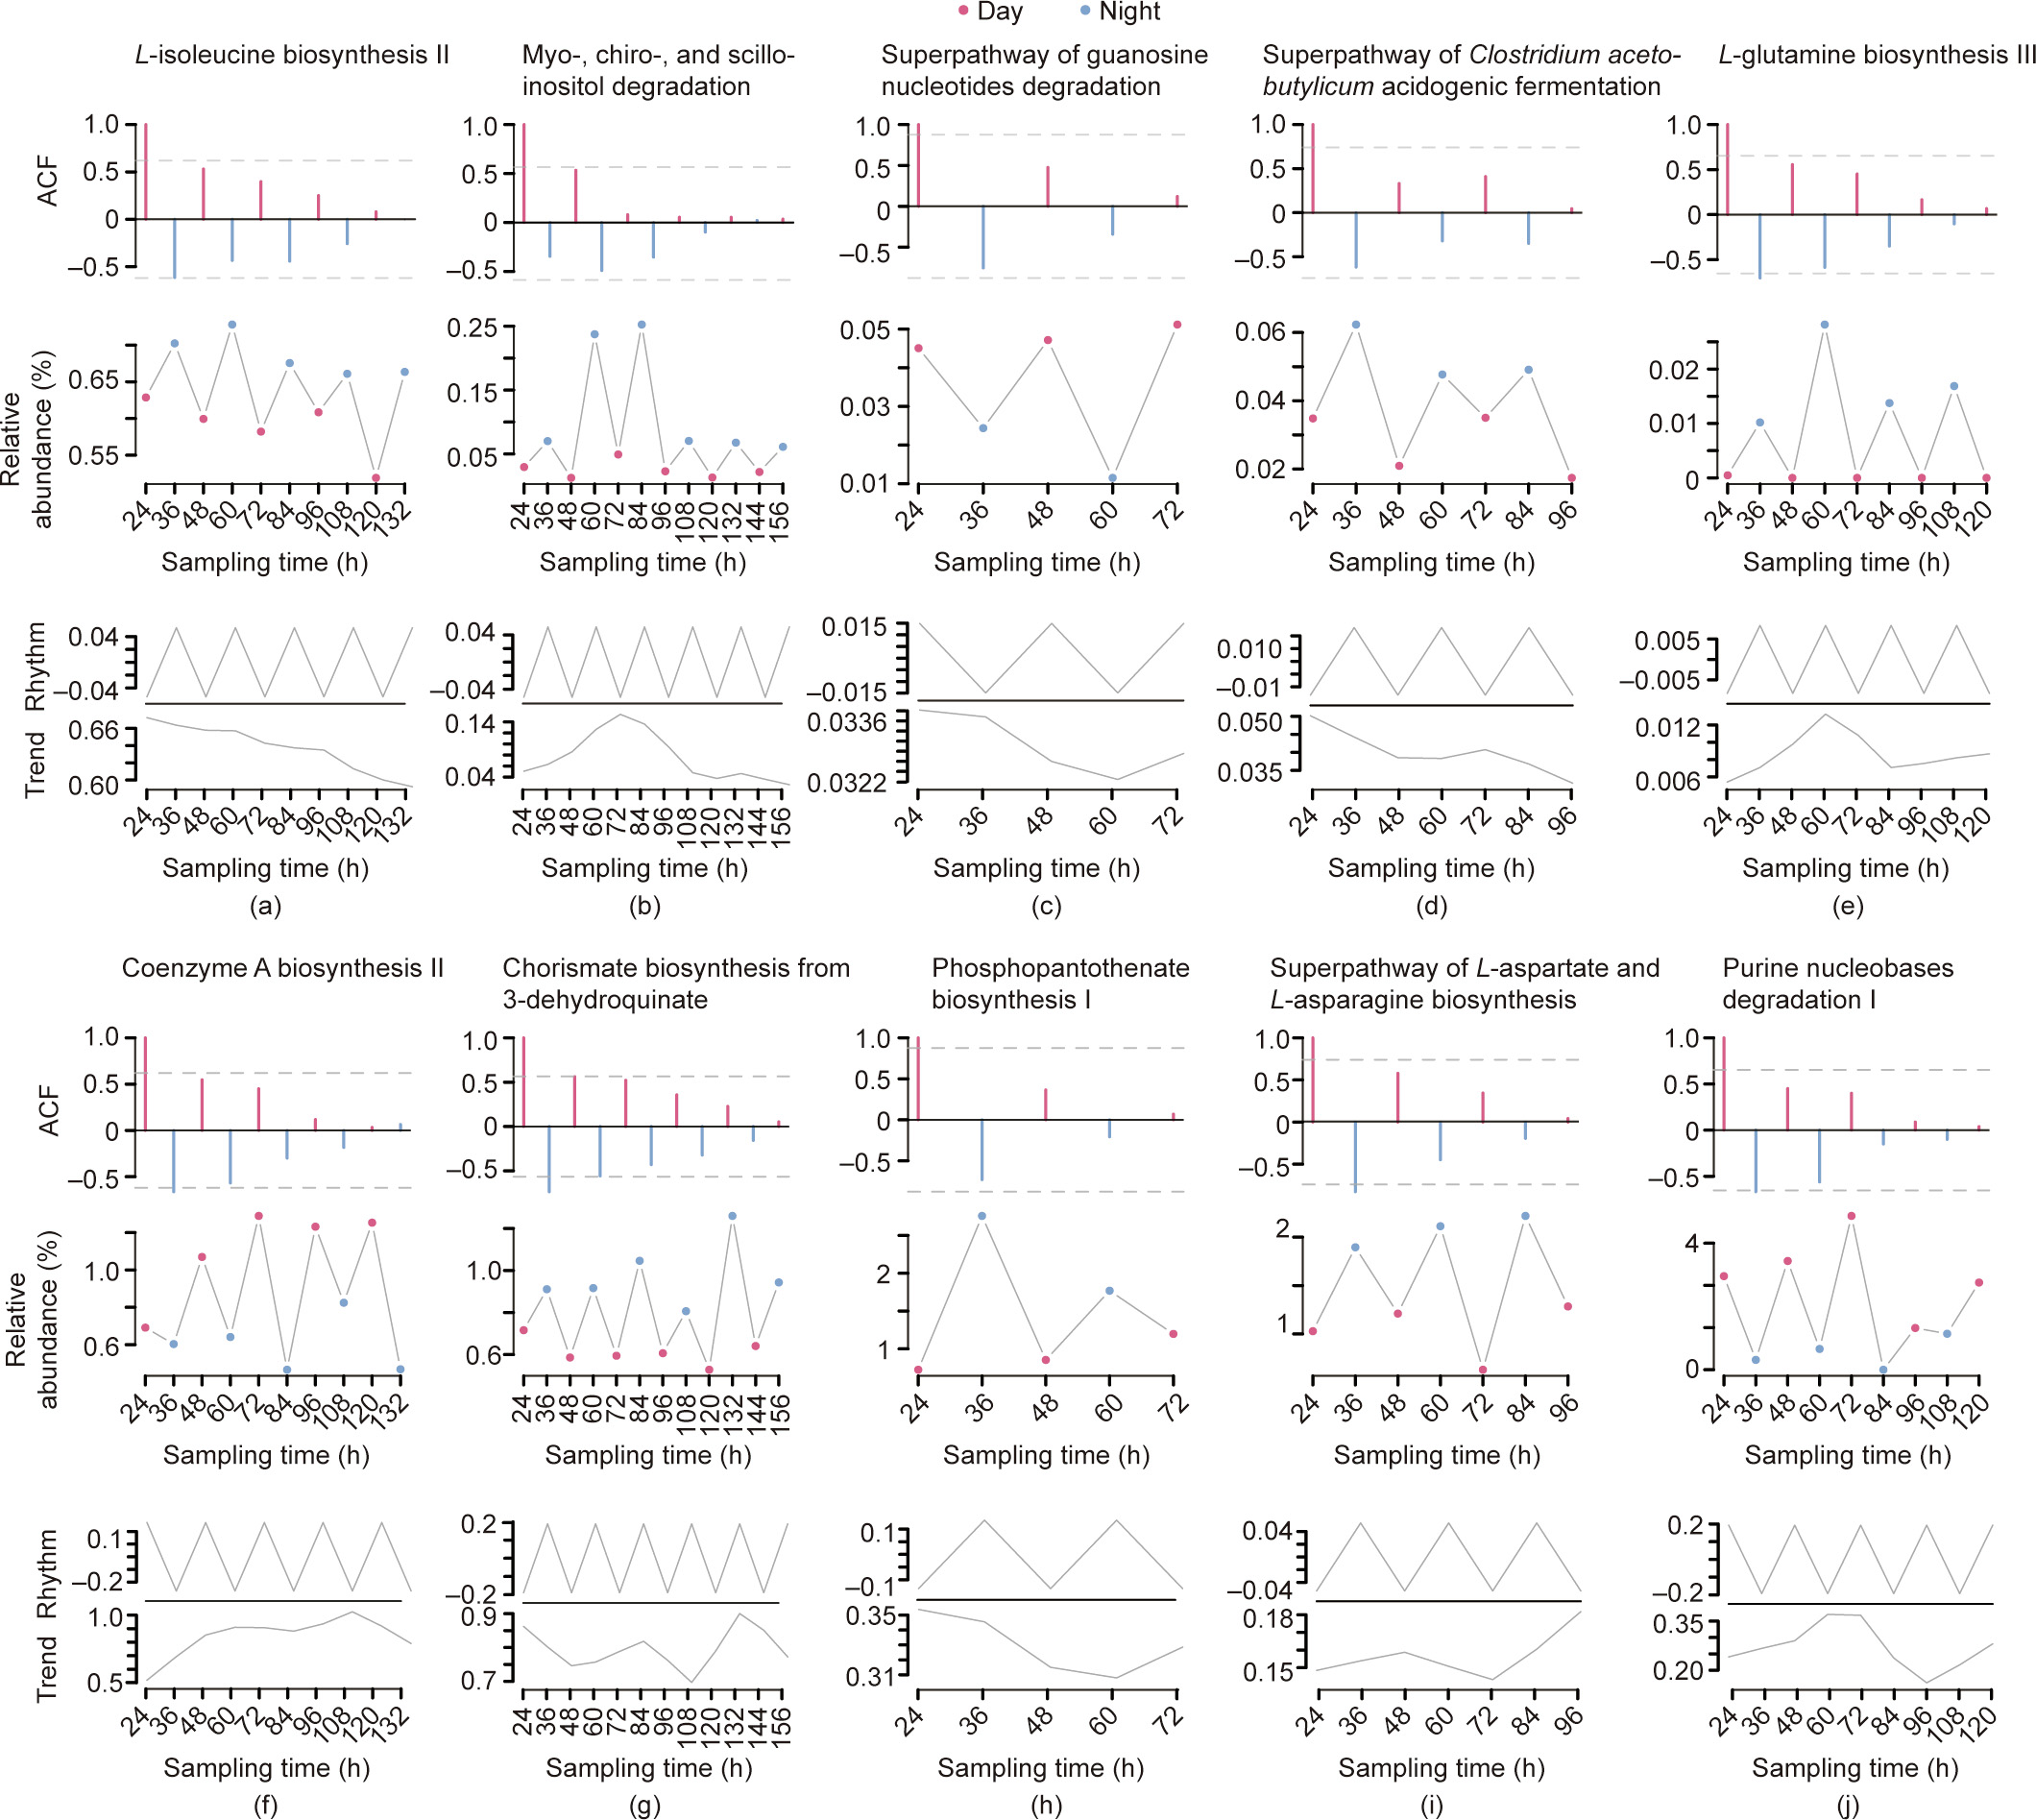
Fig. 5. Metabolic pathways with the most significant diurnal oscillations. Ten significant metabolic pathways with the most significant p values in the Box–Pierce and Ljung–Box tests (corresponding to H1, H2, H3, H4, and H5 in DNA and RNA, respectively) were selected as examples, (a–e) metagenome and (f–j) metatranscriptome. The three panels from top to bottom in every picture represent the lagged ACF of the time-series of these ten metabolic pathways, the raw relative abundance fluctuations, and the rhythmical decomposition and trend decomposition of the raw relative abundance fluctuations, respectively. In the bottom panels, ‘‘Trend” indicates long-term changes other than rhythmic oscillations, and ‘‘Rhythm” means the rhythmic oscillations. See Section 2 for the detailed analytical method.
In addition, the circadian fluctuations were decomposed into diurnal changes and long-term trends, and a close amplitude between the circadian oscillations and trends was observed. Moreover, the long-term trends seemed to be recoveries, while the circadian oscillations indicated the periodicity of the ileocecal microbiome (Fig. 5 and Fig. S6). The prediction results of the ARIMA model with external regressors calculated using Fourier functions also indicated that the relative abundance of these metabolic pathways and species showed a good future diurnal rhythm without the recovery trend (Fig. S7 in Appendix A).
《3.4. Fecal and urinary metabolomes recover after colonoscopy together with microbiome composition》
3.4. Fecal and urinary metabolomes recover after colonoscopy together with microbiome composition
The fecal and urinary metabolomes collected before the laxative treatment, along with the fecal samples obtained after colonoscopy, were investigated in order to further demonstrate the potential effects of the disturbance and recovery of the gut microbiome on the host. First, the fecal metabolome displayed marked differences after the colonoscopy compared with the pre-laxative samples (Fig. S8 in Appendix A). There was a significant decrease in the abundance of metabolites due to the osmotic laxatives, especially in the proportion of citrulline, N-acetyl-L-methionine, L-glutamic acid, N-acetylglutamic acid, allochenodeoxycholic acid, linoleic acid, oleic acid, 5-hydroxyindoleacetic acid, pantothenic acid, xanthine, oxypurinol, 4-trimethylammoniobutanoic acid, and lithocholic acid (VIP > 1, FDR < 0.05) (Fig. S8).
The metabolome in the fecal samples was dynamically reconstructed after the colonoscopy and largely correlated to microbiome recovery, resulting in a relatively similar metabolome to that of the fecal samples before the disturbance (Fig. S8 and Fig. 6). Analysis of the post-colonoscopy fecal samples revealed many associations between bacterial taxa/metabolic pathways and metabolites. To different degrees, however, the composition of the active species (determined by the metatranscriptomic data) had the strongest association with metabolome shifts, as revealed by the Mantel test (Bray–Curtis distance of species composition vs Bray–Curtis distance of metabolites, r = 0.38, p = 0.001), while a much lower and non-significant association was found between the DNA-based bacterial composition and fecal metabolites(r = 0.13, p = 0.085). In summary, fecal metabolites were also perturbed during the osmotic laxatives treatment and were reconstructed together with the gut microbiome after cessation of the treatment; consequently, the reconstruction could affect the metabolism of the host.
The microbiome also contributed to changes in the urinary metabolome composition and reconstruction, albeit to a lesser degree than in the fecal metabolome (Fig. S8 and Fig. 6). With depletion of the gut microbiome, the urinary metabolome had fewer metabolites that decreased, and the most prominent metabolite only had a near-significant decrease (7- methylxanthine, VIP > 0, p = 0.087). Compared with that of the feces samples, the metabolome of the urine samples collected after colonoscopy displayed a lesser yet still detectable recovery, mirroring the shifts in the gut microbiome (Fig. S8). Associations between metabolites and microbial taxa/metabolic pathways were determined, with niacinamide, 1–3-dimethyluric acid, and 4-trimethylammoniobutanoic acid overlapping between the urinary and fecal metabolomes (Fig. S9 in Appendix A). Again, a significant correlation was observed between the active bacterial species composition and the metabolome, as revealed by the Mantel test (r = 0.28, p = 0.001). However, this correlation was lower than that in the fecal metabolome and could be the result of less direct input from the microbiome together with greater influences of the host metabolic activities. Thus, the urinary metabolome was also changed by the perturbance of the gut microbiome, and recovery was again correlated with microbiome reconstruction.
《Fig. 6》
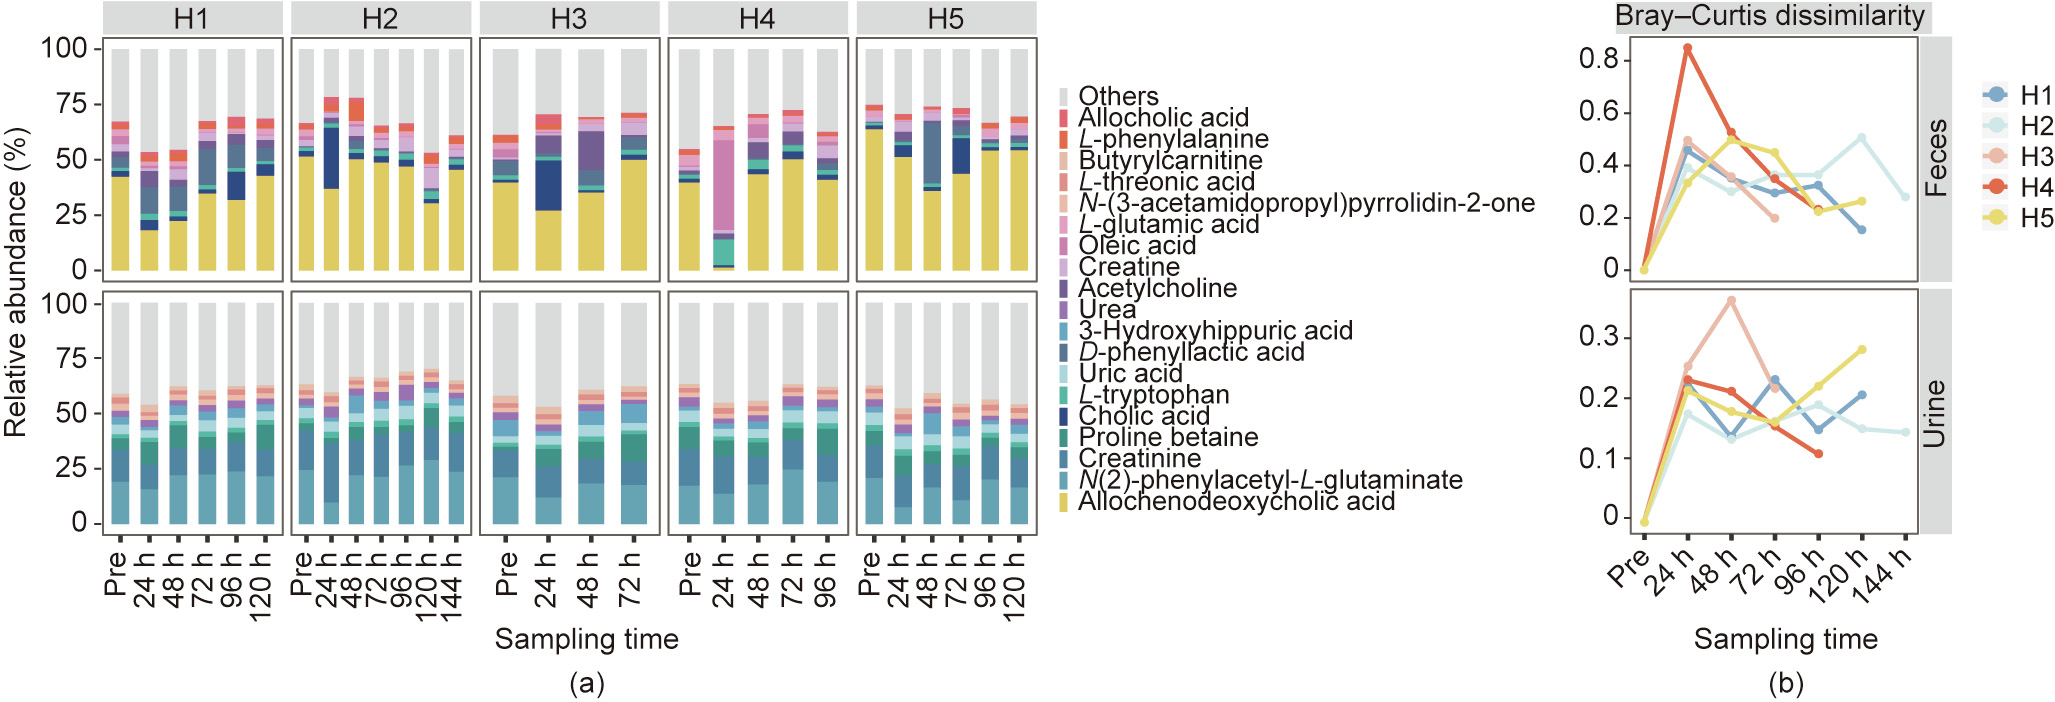
Fig. 6. Dynamic reconstruction of the metabolites in fecal and urinary samples after exposure to osmotic laxatives. (a) Bar plots of the ten major metabolites with the highest relative abundances in each individual (H1, H2, H3, H4, and H5) at each sampling time, including fecal and urinary samples collected before (Pre) and after (Post) osmosis. (b) Bray–Curtis dissimilarities of the fecal or urinary samples after osmotic laxatives (Post) compared with samples before interference (Pre) in each individual.
Further enrichment analysis of the metabolites that exhibited a decrease in the feces indicated the potential importance of microbiome-derived metabolites in many physiological and pathological conditions. MetaboAnalyst [39] revealed that the changes in these metabolites were significantly associated with many metabolic syndromes including Hartnup disease and short-bowel disease, as well as central neural system disorders such as seizures and schizophrenia (Fig. S10 in Appendix A). This finding re-affirmed that the functioning of the gut–brain axis is largely carried out via various microbial metabolites. The enrichment results also included metabolites that were affected by diurnal variations (ten-fold enrichments, 15th in terms of significance value). Since some metabolites are largely dependent on the presence of the gut microbiome, the diurnal variations in the gut microbiome could be assumed to be underlying the diurnal variations in the metabolites themselves.
《4. Discussion》
4. Discussion
In the present study, a colonic TET technique, originally designed for the colonic delivery of fecal microbiota or medications, was utilized to collect fecal samples continually along with ileocecal samples in situ following laxatives treatment. The collected samples were subjected to a combination of metagenomic, metatranscriptomic, and metabolomic analyses to profile the composition, function, and dynamics in multiple layers of the human gut microbiome. The study also revealed the individuality of the reconstruction of the microbiome composition and functions, which generally showed shared characteristics of the internal resilience of the gut microbiome. The ability to sample the ileocecal microbiome in situ—and at fixed time points that are more frequent than defecated feces—provided, for the first time, a unique insight into the diurnal patterns or circadian rhythms in the human gut microbiome. Such rhythms were concluded to occur at the whole community level in terms of specific bacterial groups and metabolic pathways.
Both bacterial species and metabolic pathways can have distinct patterns when they are examined at the DNA (‘‘standing”) and RNA (‘‘active”) levels [37,38]. In the defecated fecal samples, a collection of bacterial species, including members of the genera Ruminococcus, Subdoligranulum, and Faecalibacterium, were highly active in terms of transcription and, potentially, metabolism. These bacteria are butyrate producers, and butyrate is known to be both metabolically and immunologically crucial for the host, especially in the context of several metabolic disorders as well as autoimmune disorders [40–43]. The predominant metabolic pathway was adenosine ribonucleotides de novo biosynthesis, which is related to adenosine triphosphate (ATP) production and thus energy cycling in both DNA and RNA. With the exception of this pathway, all other metabolic pathways that were highly active in the transcriptome data were related to the metabolism of nutrients (e.g., glucose metabolism), while pathways related to cellular structures (e.g., the components of cell walls) were most abundant in the DNA samples. This finding suggests that there is heterogeneous regulation of transcription in pathways aimed at different parts of microbial physiological activities.
After colon cleaning by laxatives, the fecal microbiome first showed dramatic changes in composition and functionality; however, these distinctions gradually decreased in the later time points compared with the pre-treatment microbiome. Considering the strong associations between the ileocecal samples that were collected simultaneously with fecal samples, it can be concluded that the ileocecal microbiome was also dynamically reconstructing. Such reconstruction has characteristics of high individuality, in that different bacterial species/metabolic pathways recovered to more similar abundances in each individual. However, the microbiome reconstructions also displayed the shared characteristic of microbial resilience, in that they became increasingly similar in general to the pre-laxative microbiome. Many studies have reported the long-term stability and resilience of the gut microbiome after acute disturbance including dietary intervention, medication, and so forth [24,44–46]. The changes in the microbiome after one dose of laxatives provided yet another demonstration of such resilience, which is based on the internal mutual interactions of microbial species [47–49].
Regular, twice daily, ileocecal sampling provided interesting insights into the diurnal patterns of the human GI microbiome. In the metatranscriptome analysis of the ileocecal samples, butyrate-producing bacteria again composed the majority of the species that showed strong signatures of diurnal patterns. This was potentially a response to food intake and/or host physiological shifts in the GI tract [50]. Metabolic pathways related to the production of SCFAs were among those with the most prominent diurnal patterns, and these SCFAs have been recognized as key factors affecting host circadian rhythms [10,51]. It was recently reported that the circadian rhythm of host intestinal epithelial cells can be affected by MyD88-dependent histone deacetylase 3 (HDAC3) gene expression changes, and the activities of HDAC are known to be also affected by SCFAs [52–54]. These findings not only indicate replication dynamics and the metabolic activities of bacterial groups during the day or night, but might also provide the eventual microbial cue for this route of gut microbiota–host crosstalk.
n contrast to a previous study in mice [8], in which laxatives were administrated for a long period, the volunteers in the current study only received one dose of colon-cleaning laxatives before the colonoscopy. Consequently, the gut microbiome showed recovery instead of long-term dysbiosis—a finding that agrees with clinical observations that colonoscopies are generally not associated with long-term adverse effects in GI systems. In the current study, fecal samples were not collected for a long enough period to determine whether the gut microbiome showed total recovery, as corresponding ileocecal sampling was no longer feasible after the TET tube fell out. The time that the colonic TET tube remains within the colon generally ranges from one to two weeks if using 2–4 clips for endoscopic fixation [55]. There were also limits on the analysis of the ileocecal sample metabolome because the ileocecal samples were wash-outs with undeterminable levels of dilutions, which rendered the quantification of metabolites difficult. Finally, host responses could only be inferred by the metabolome in the fecal and urine samples; nevertheless, a similar recovery to that of the microbiome was observed, and this finding reaffirmed the contribution of the gut microbiome to metabolites. Furthermore, the largely microbiome-derived metabolites could underlie important metabolic and central neural system functions, reaffirming the contribution of the gut microbiome to host metabolism and the gut–brain axis. More direct measures of host responses, including host intestinal epithelial gene expression, are not yet achievable in humans and can only be investigated in experimental animals.
In conclusion, this study investigated both gut microbiome reconstruction after laxative-induced depletion and the corresponding reconstructions of the ileocecal microbiome in situ, at a higher temporal resolution than previous observations. Direct evidence of diurnal patterns of the ileocecal microbiome in humans at the compositional and functional levels was provided for the first time. This understanding of the dynamics of the fecal and ileocecal microbiomes at multi-omics levels facilitates an understanding of the gut microbial ecosystem itself, as well as of how it could potentially affect host physiological processes, including circadian rhythms.
《Acknowledgments》
Acknowledgments
We thank all the participants for their information and samples. This work was supported by the National Key Research and Development Program of China (2018YFC2000500), the Strategic Priority Research Program of the Chinese Academy of Sciences (XDB29020000), the National Natural Science Foundation of China (31771481, 91857101, and 81873548), the Primary Research & Development Plan of Jiangsu Province (BE2018751), and the Jiangsu Provincial Medical Innovation Team (F. Zhang).
《Compliance with ethics guidelines》
Compliance with ethics guidelines
Xiaolin Liu, Min Dai, Yue Ma, Na Zhao, Ziyu Wang, Ying Yu, Yakun Xu, Huijie Zhang, Liyuan Xiang, He Tian, Guanghou Shui, Faming Zhang, and Jun Wang declare that they have no conflict of interest or financial conflicts to disclose.
《Authors’ contribution》
Authors’ contribution
Jun Wang and Faming Zhang designed this study; Xiaolin Liu, Yue Ma, and Na Zhao analyzed the data; Min Dai collected the samples; Jun Wang wrote the manuscript; Jun Wang, Faming Zhang, Xiaolin Liu, and Min Dai reviewed the manuscript; and Jun Wang, Faming Zhang, Min Dai, Huijie Zhang, and Liyuan Xiang provided the samples. All authors read and approved the final manuscript.
《Appendix A. Supplementary data》
Appendix A. Supplementary data
Supplementary data to this article can be found online at https://doi.org/10.1016/j.eng.2021.03.015.


 京公网安备 11010502051620号


