
《1. Introduction》
1. Introduction
Investigating the mechanisms involved in the development of the spinal cord in placental mammals continues to be important in the fields of tissue engineering, neuroscience, and regenerative medicine [1]. In vertebrates, the intrinsic growth capacity that promotes the regeneration of the spinal cord is greatest during embryogenesis [2,3], becomes weaker in the juvenile stage, and almost disappears in adulthood [4,5]. However, the transcriptional changes occurring during spinal cord development from the embryonic stage to adulthood, as well as their relationship with the intrinsic growth capacity of the spinal cord, remain poorly understood. Moreover, a systematic study of long-term gene expression patterns in the developing rat spinal cord has not been performed to date. To track the long-term developmental processes of the spinal cord at the tissue level, we collected whole spinal cords from rats from embryonic day 9 (E9d) to postnatal week 12 (P12w) for RNA sequencing (RNA-Seq) analysis. Thirtysix samples were collected from a total of 12 time points to investigate the associated gene expression dynamics.
《2. Material and methods》
2. Material and methods
《2.1. Rat spinal cord sample preparation》
2.1. Rat spinal cord sample preparation
Adult, pregnant, and immature specific pathogen-free (SPF) Sprague Dawley (SD) rats were provided by the Laboratory Animal Center of Nantong University, China. Rats were anesthetized by ether inhalation and the decapitator (Pushin Zr-11; Shanghai Puxin Instrument Technology Co., Ltd., China) was prepared by cooling with ice cubes at 06:30 on sampling days. Oxygen-saturated, icecold artificial cerebrospinal fluid (ACSF) was prepared with the following composition: 130 mmol∙L–1 NaCl, 5 mmol∙L–1 KCl, 2 mmol∙L–1 KH2PO4, 1.5 mmol∙L–1 CaCl2, 6 mmol∙L–1 MgSO4, 10 mmol∙L–1 glucose, 10 mmol∙L–1 HEPES (pH 7.2, 305 mOsm osmotic pressure). After beheading, rat spines were quickly isolated and washed twice with fresh, ice-cold ACSF. Whole spinal cords were dissected in fresh, ice-cold ACSF under an anatomical microscope (Olympus SZ51; Olympus Corporation, Japan). The spinal dura mater, arachnoid, and spinal pia mater were stripped. Spinal cord samples were collected from rats aged from E9d to P12w across a total of 12 time points (E9d, E11d, E14d, E18d, P1d, P3d, P1w, P2w, P3w, P4w, P8w, and P12w) each with three biological replicates. All tissues were snap-frozen in liquid nitrogen and stored at –180 °C. In total, 36 spinal cord tissues were isolated for the generation of RNA-Seq data.
《2.2. RNA extraction and library preparation and sequencing》
2.2. RNA extraction and library preparation and sequencing
Total RNA was extracted using TRIzol reagent (Ambion, Inc., USA) according to the manufacturer’s protocol. Total RNA was depleted of ribosomal RNA (rRNA) using the Epicentre Ribo-Zero rRNA Removal Kit (Epicentre, USA) and fragmented, purified, and sequenced using an Illumina HiSeq 2000 system (Illumina, Inc., USA) [6]. Small noncoding RNAs (18–30 nucleotides long) were isolated using the denaturing polyacrylamide gel electrophoresis (PAGE) method presented in the work of Lagos-Quintana et al. [7]. Libraries were then constructed using the TruSeq Small RNA Library Preparation Kit (Illumina, Inc.) and sequenced on the Illumina HiSeq 2000 platform.
《2.3. RNA-Seq analysis》
2.3. RNA-Seq analysis
Reads with an adapter sequence, a high content ( ≥ 10%) of unknown bases, and low-quality reads (percentage of Q< 10 above 50% in the read) were removed before the downstream analysis. Next, rRNA contaminants were filtered out by removing reads that mapped to rRNA sequences using Short Oligonucleotide Alignment Program 2 (SOAP2) [8]. The rat reference genome and annotation files (version Rn6.0) were downloaded from the University of California, Santa Cruz (UCSC) genome browser database (http:// genome.ucsc.edu). To quantify gene expression, RNA-Seq reads were mapped to genes with Bowtie2 [9] and quantified with RNA-Seq by Expectation Maximization (RSEM, a software package for estimating gene and isoform expression levels from RNA-Seq data) [10]. Fragments per kilobase of exon per million mapped reads (FPKM) were used to normalize for gene length and library size. NOIseq [11] was used to identify differentially expressed genes (DEGs) between two consecutive development periods. Genes with a  ≥ 1 and a divergence probability ≥ 0.8 between two samples were defined as DEGs.
《2.4. Identification of stage-specific expressed genes》
2.4. Identification of stage-specific expressed genes
To detect genes specifically expressed at a given stage, the method described by Yanai et al. [12] was used. The graded tissue specificity index  was calculated according to the following equation:
based on normalized expression data across all the spinal cord development time points. xn denotes the expression of a gene in stage n and N denotes the number of development time points in this study. Stage-specific expressed genes (SSEGs) were defined as those with ≥0.9.
《2.5. Weighted gene co-expression network analysis》
2.5. Weighted gene co-expression network analysis
To identify genetic patterns during spinal cord development, we performed a weighted gene co-expression network analysis (WGCNA) with the WGCNA R software package [13] using the normalized expression (FPKM) of all the genes expressed in the samples from E9d to P12w. A soft threshold was selected to determine the power parameter. Modules were combined with the protein–protein interaction (PPI) network from search tool for retrieval of interacting genes/proteins (STRING) database [14] and visualized in Gephi (a software for data visualization) [15]. Expression pattern clustering was analyzed using the pheatmap package in R.
《2.6. Functional enrichment analysis》
2.6. Functional enrichment analysis
Functional enrichment was assessed using database for annotation, visualization, and integrated discovery (DAVID) Bioinformatics Resources 6.7 [16,17] (http://david.abcc.ncifcrf.gov/).
《2.7. Alternative splicing analysis》
2.7. Alternative splicing analysis
TopHat [18] was used to identify splice junctions and replicate multivariate analysis of transcript splicing (rMATS) [19] was used to detect differential alternative splicing events (DASEs) between two adjacent samples (e.g., E9d vs E11d, E11d vs E14d, E14d vs E18d). rMATS calculates the relative abundance of the inclusion and skipping subtypes, and calculates the P value and false discovery rate (FDR) of differential splicing. Significant differential splicing was defined at FDR ≤ 0.05.
《2.8. Long noncoding RNA analysis》
2.8. Long noncoding RNA analysis
To identify known and novel long noncoding RNAs (lncRNAs), RNA-Seq reads for each sample were first mapped to the genome using TopHat and then assembled with Cufflinks [20]. Cuffmerge and Cuffcompare, which are implemented in Cufflinks, were used to merge transcripts from all the samples, and the assembled transcripts were compared with known messenger RNAs (mRNAs) and lncRNAs. Transcripts with the tags ‘‘i,” ‘‘j,” ‘‘u,” ‘‘x,” and ‘‘o” were retained. Coding Potential Calculator (CPC) [21] and iSeeRNA [22] were used to predict novel transcript coding potential ability. The quantification and differential expression analysis of lncRNAs were the same as for the RNA-Seq analysis (Section 2.3).
《2.9. Small RNA analysis》
2.9. Small RNA analysis
Adapter sequences and low-quality reads were first removed. Clean sequences were mapped against databases to remove rRNA-, small conditional RNA (scRNA)-, small nucleolar RNA (snoRNA)-, small nuclear RNA (snRNA)-, and transfer RNA (tRNA)-associated reads. The remaining sequences were mapped against miRbase (v21) and Rfam (v11) databases to annotate and categorize into regulator small RNAs (microRNAs (miRNAs) and Piwi-interacting RNAs (piRNAs)) using Bowtie2 and cmsearch [23], respectively. The miRNA expression level was calculated using transcripts per kilobase million (TPM) [24]. Differentially expressed small RNAs were detected using DEGseq [25]. miRNAs with a  ≥ 1 and a Q-value ≤ 0.001 were defined as significantly differentially expressed. Ingenuity pathway analysis (IPA) was used to identify potential miRNA regulators.
《2.10. Quantitative real-time polymerase chain reaction (qRT-PCR)》
2.10. Quantitative real-time polymerase chain reaction (qRT-PCR)
Total RNA was isolated using TRIzol reagent and then reverse transcribed using the PrimeScript RT Reagent Kit (TaKaRa Bio, China). For the quantification of gene expression, qRT-PCR was conducted using SYBR Premix Ex Taq (Tli RNaseH Plus; TaKaRa Bio, China) on a StepOnePlus RT-PCR system (Applied Biosystems, USA). Relative mRNA expression was quantified by the  method. GAPDH was used as the internal control. All experiments were repeated three times.
《2.11. Immunofluorescence》
2.11. Immunofluorescence
Rat spinal cords were fixed in 4% paraformaldehyde at 4 °C overnight. Samples were cross-sectioned to a thickness of 12 μm. After three washes with phosphate-buffered saline (PBS, 0.01 mol∙L–1 , 25 °C; 21-040-CVR; Corning Inc., USA) of 5 min each, the sections were blocked using Immunol Staining Blocking Buffer (Beyotime, China) for 1 h at 25 °C. Sections were incubated with primary antibody at 4 °C for 12–16 h. After rinsing three times with PBS, secondary antibody was added, and the samples were incubated at 25 °C for 1 h. Sections were then stained with Hoechst 33342 for 15 min. Each experiment was repeated three times. The following antibodies were used: anti-Dnmt3a (1:1000; ab188470; Abcam, UK), anti-NEUROD4 (1:100; 14610-1-AP; Proteintech, USA), anti-Nestin (1:200; MAB353; Merck Millipore), anti-NeuN (1:200; MAB377; Merck Millipore, USA), Cy3 sheep anti-rabbit immunoglobulin G (IgG) (1:500; C2306; SigmaAldrich, USA), Alexa Fluor 488 donkey anti-mouse IgG (1:500; A21202; Invitrogen, USA).
《3. Results and discussion》
3. Results and discussion
《3.1. Landscape of the rat spinal cord transcriptome》
3.1. Landscape of the rat spinal cord transcriptome
We identified 15 646 mRNAs and 667 miRNAs from the transcriptome. Subsequently, we randomly screened two genes and two miRNAs (Dnmt3a, Neurod4, miR-29c-3p, and miR-18a-3p) for validations using qRT-PCR and immunofluorescence (IF) (Figs. 1(a) and (b)). We also compared our IF data with the mouse spinal cord in situ hybridization (ISH) data deposited in the Allen Brain Atlas (ABA) database [26]. Overall, our IF results were consistent with those of the ISH data (only two points, postnatal days 4 and 56, were available in the ABA database), at least on the postnatal days (P1w and P8w, marked with asterisks in Fig. 1(a)). These results confirmed the quality of our data, which were appropriate for the downstream analyses.
《Fig. 1》
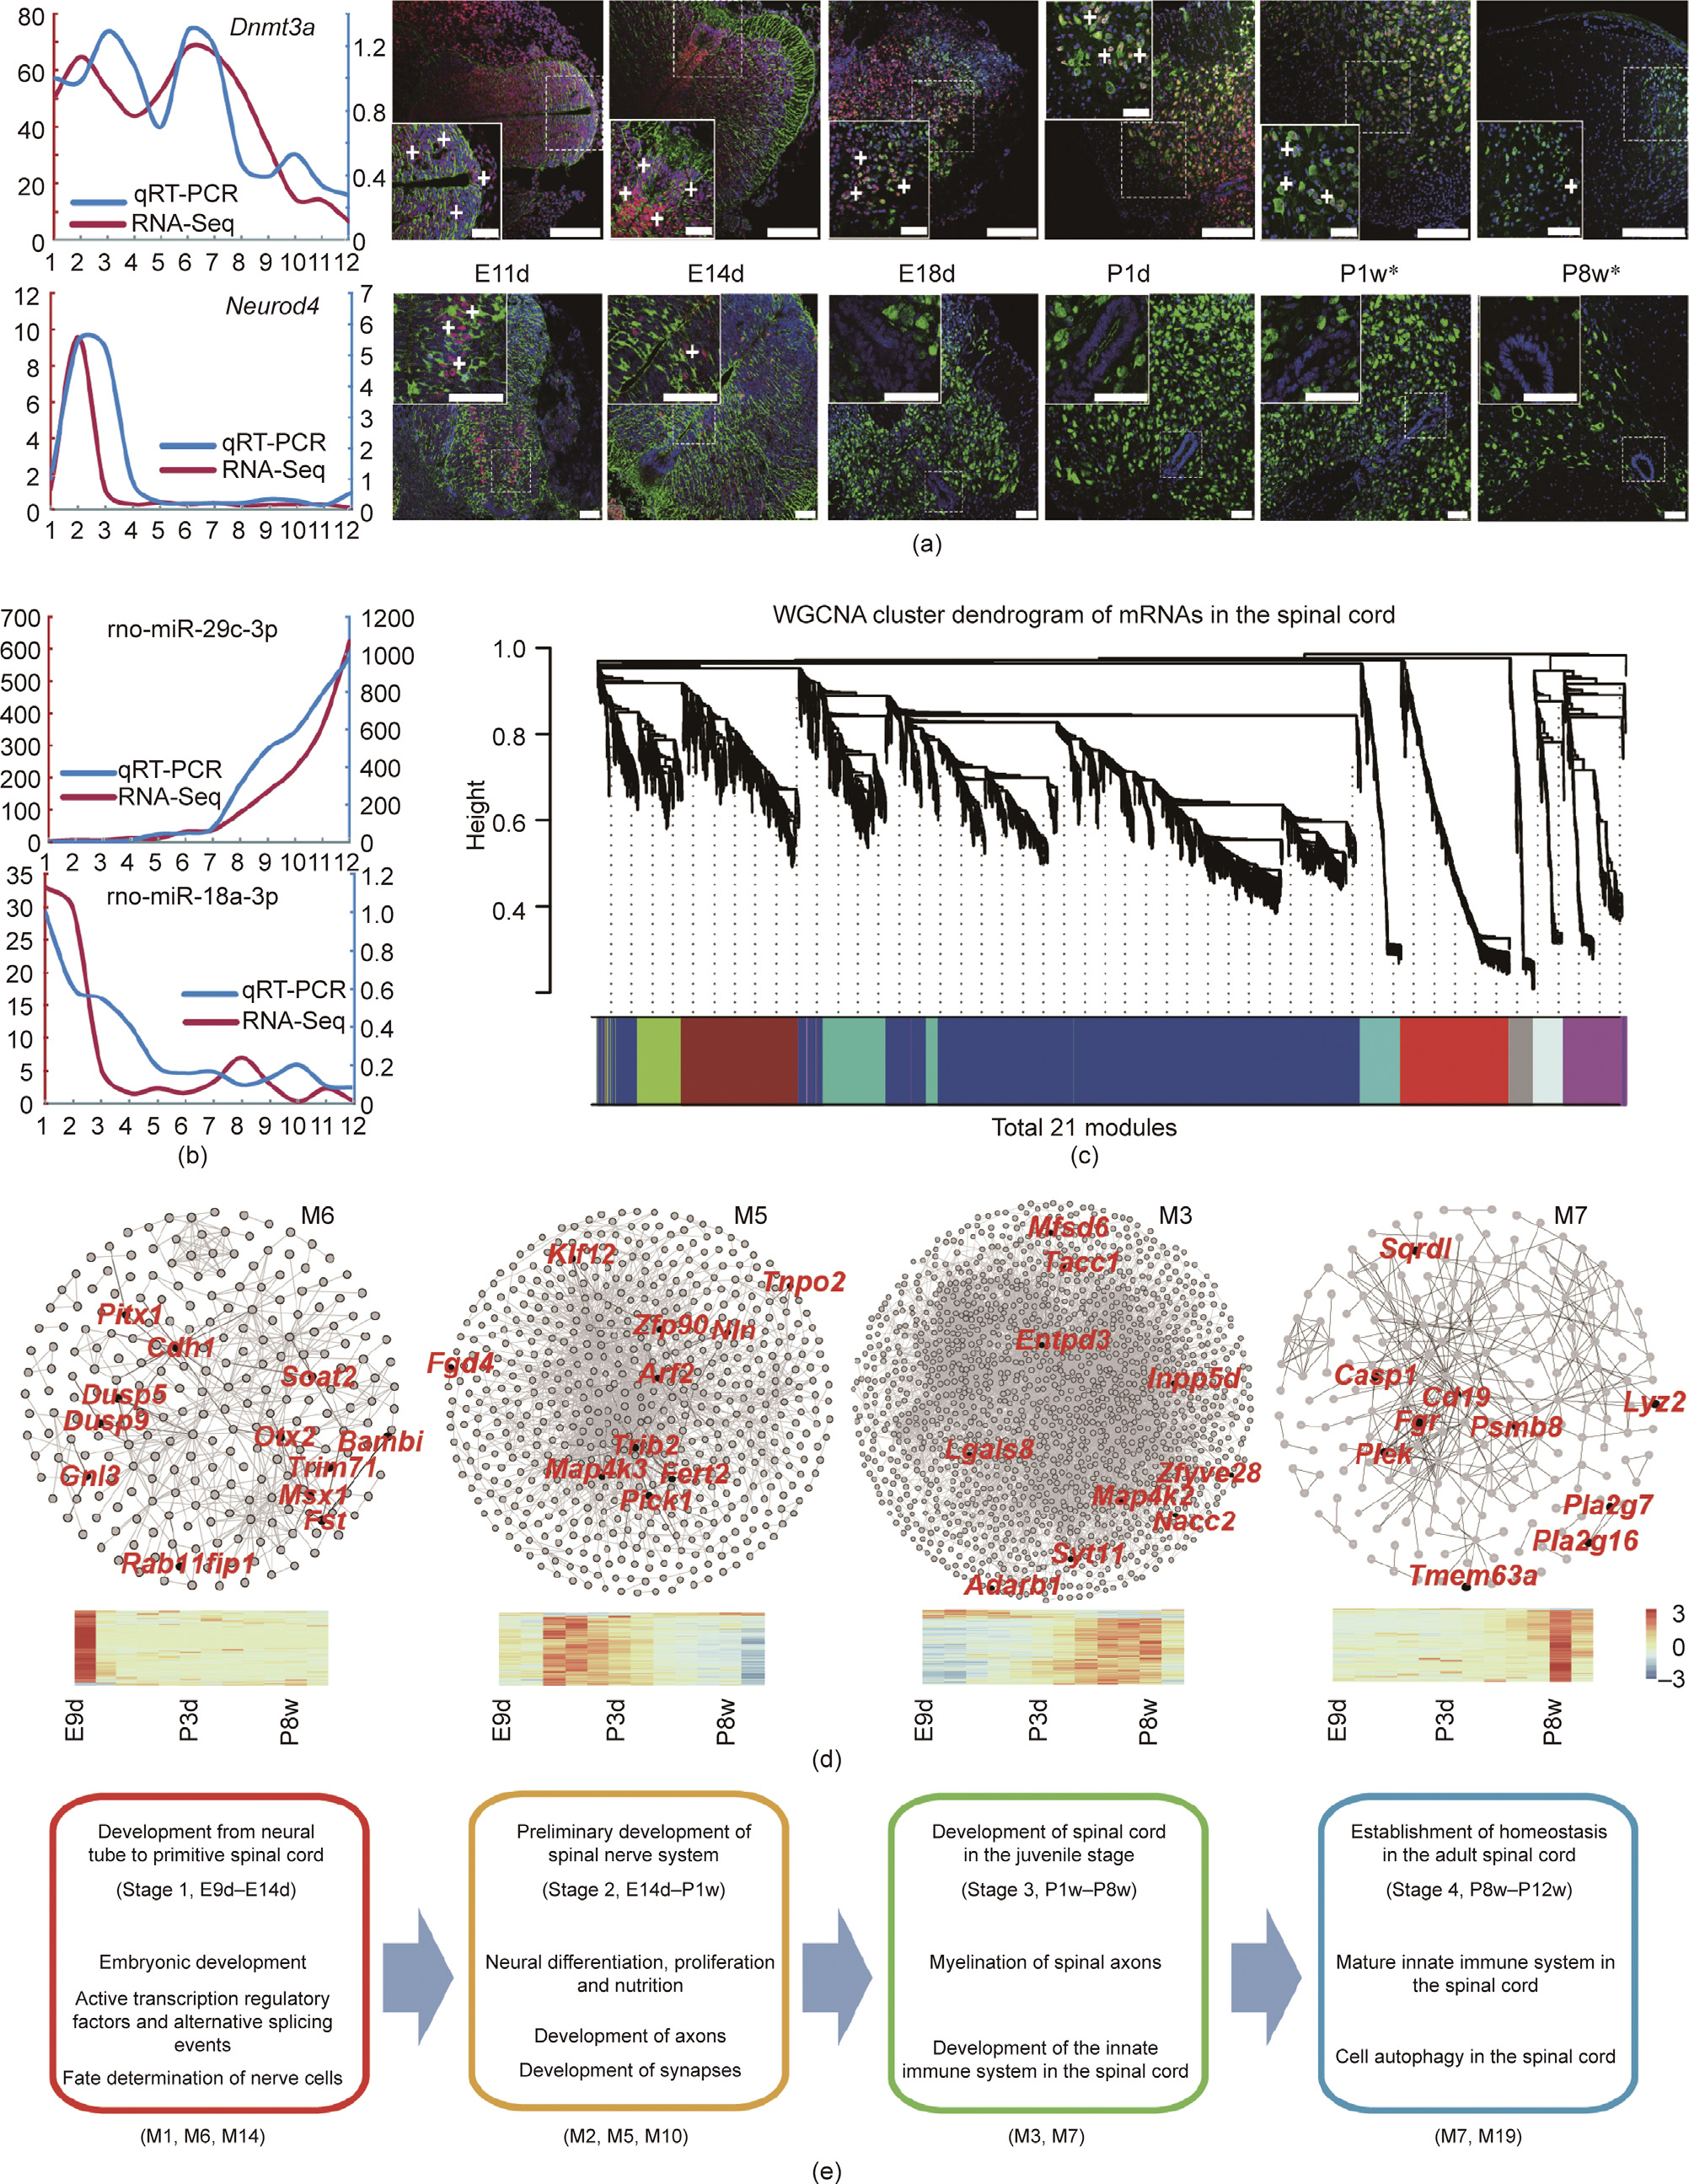
Fig. 1. Gene expression validation and co-expression networks. (a) Expression validation of Dnmt3a and Neurod4 by qRT-PCR (left) and immunofluorescence staining (right). White plus (+) symbols indicate positive signals. Asterisks (*) in P1w and P8w denote that our data were consistent with the in situ hybridization (ISH) data from the Allen Brain Atlas (ABA) database. Scale bars: 75 μm. (b) Validation of the expression of miR-29c-3p and miR-18a-3p by qRT-PCR. rno: Rattus norvegicus (Norway rat). The x-axis of (a) (left) and (b) indicates the ordinal developmental stages. The y-axes in red and blue show the FPKM of RNA-Seq and the fold change in qRT-PCR, respectively. (c) Dendrogram of 21 co-expressed modules. Different colors indicate the different modules. (d) Several important co-expressed modules. Hub genes are labeled red. The color legend is the row Z-score of expression. (e) Four developmental stages and their characteristics. Represented co-expressed modules are shown in parentheses (bottom).
Co-expressed genes tend to cluster together when they participate in similar biological pathways or are regulated by similar regulatory pathways [27]. WGCNA is based on a scale-free network and a soft thresholding to calculate the relationships of genes and detect co-expressed modules [13,28]. We applied WGCNA to investigate biological functional modules and identified a total of 21 modules (M1–M21; Fig. 1(c)). Functional enrichment analysis of the modules identified four distinct stages during spinal cord development based on biological process terms (Figs. 1(d) and (e)). Stage 1—namely, from E9d to E14d—comprised the formation of the primitive spinal cord from the neural tube. We found that genes in module M6 were involved in embryonic development and transcriptional regulation, while those in M14 had a role in cell fate determination (Tables S1 and S2 in Appendix A). Stage 2 (from E14d to P1w) comprised the preliminary development of the spinal nerve system, reflected in the enrichment of genes related to neural differentiation, proliferation, nutrition, and axon development (Fig. 1(e), Tables S3–S5 in Appendix A). Stage 3 (from P1w to P8w) was characterized by the enrichment of genes involved in myelination, the innate immune system, and the oxidation–reduction process, while Stage 4 (from P8w to P12w) was enriched in the genes involved in innate immunity and cell autophagy (Tables S6 and S7 in Appendix A). These stage changes were consistent with the developmental characteristics of the corresponding periods [29].
In addition, we employed gene expression clustering analysis to investigate global gene expression patterns and identified two patterns of expression (Patterns 1 and 2 in Fig. 2(a)). Genes in Pattern 1 were highly expressed during the embryonic and newborn periods (7481 genes), and were enriched in some of the pathways that are pivotal to embryonic development (Table S8 in Appendix A). Genes in Pattern 2 were highly expressed from infancy to adulthood (6926 genes), and were involved in energy metabolism, immune development, and cell proliferation (Table S9 in Appendix A).
Analysis of SSEGs contributes to an improved understanding of the biology related to specific developmental stages [12]. We identified 55 genes that were specifically expressed at E9d, and these were related to intestinal epithelial cell differentiation, anterior/posterior pattern specification, and neural plate morphogenesis (Fig. 2(a) and Table S10 in Appendix A). Forty-three SSEGs related to the regulation of transcription, the generation of neurons, and tissue homeostasis were identified at stage E11d, while nine SSEGs were found at E14d and were associated with protein autophosphorylation and axonal cellular components. Interestingly, SSEGs identified in P8w and P12w were both enriched in terms associated with immune-system-related terms, such as innate immune response antigen processing and presentation (Table S10).
For gene regulators, we found that the expression patterns of miRNAs exhibited two trends around birth (miRNA profile in Fig. 2(b)). We also observed two transcription factor (TF)-related expression patterns, with the neonatal stage (P3d) as the boundary line (TF profile in Fig. 2(b)). Before P3d, TFs were enriched in terms associated with fate determination, stem cell functional regulation, and nerve development (Table S11 in Appendix A). After P3d, TFs related to cellular differentiation and innate immunity activation were more highly expressed (Table S11). We also compared the expression patterns of miRNAs and TFs given the relationship that exists between them. We noticed that most TFs (approximately 70%) were relatively highly expressed, while the expression levels of most miRNAs (approximately 60%) were relatively low before P3d; however, this pattern was inverted after P3d, with values of approximately 30% for TFs and approximately 40% for miRNAs (we called this a ‘‘mosaic pattern,” as shown in Fig. 2(b)). This finding suggests that macro regulatory systems have a coordinating role in the spinal cord. We also noticed that most genes involved in stem cell population maintenance might be active on E9d and E11d (Fig. S1 in Appendix A). Genes involved in dopaminergic synaptic transmission appeared to be expressed earlier than genes involved in cholinergic synaptic transmission at P3d (Fig. S2 in Appendix A), which suggests that dopaminergic neurons might arise earlier in the spinal cord.
《Fig. 2》

Fig. 2. Typical expression patterns during rat spinal cord development. (a) mRNA expression patterns in the rat spinal cord. The upper panel shows the distribution of SSEGs (≥ 0.9); the lower panel shows two mRNA expression patterns. (b) Mosaic expression patterns of miRNAs and transcription factors (TFs). Left and right heatmaps show the expression patterns of TFs and miRNAs, respectively. (c) Expression patterns of genes involved in energy metabolism. The left heatmap shows the expression pattern of genes involved in the energy reserve metabolic process; the right heatmap shows the expression pattern of genes involved in positive regulation of autophagy. The expression trend (polynomial fit) of four primary marker genes involved in autophagy is shown in the upper right. The right y-axis was scaled according to the expression levels of the genes marked with asterisks (*). (d) Expression of genes involved in oxidative phosphorylation. α, β,  , δ, ε, ζ, η, and θ are branches. The color legends are the row Z-score of expression.
To investigate energy and material metabolism during development, we focused on the expression patterns of genes involved in the biological processes of the energy reserve metabolic process, autophagy, and oxidative phosphorylation (Figs. 2(c) and (d), Tables S12 and S13 in Appendix A). For the energy reserve metabolic process (left in Fig. 2(c)), genes from branches α and β were enriched for the term positive regulation of the glycogen biosynthetic process (P < 0.01; Table S12). Genes from branches β and were enriched for the term positive regulation of the cyclic adenosine 3ʹ,5ʹ-monophosphate (cAMP) biosynthetic process (P < 0.01; Table S12). For the positive regulation of the autophagy process (right in Fig. 2(c)), genes from branch ε were significantly enriched in the cellular response to the glucose starvation process (P < 0.01; Table S13) and in the positive regulation of the mitophagy process (P < 0.01; Table S13) before P3d. After P3d, branch δ was significantly enriched in genes associated with the positive regulation of xenophagy (P < 0.01; Table S13), which is a component of innate immunity and functions in the maintenance of tissue homeostasis. Interestingly, the profiling of genes related to the oxidative phosphorylation electron transport chain demonstrated a trend of high expressions in adulthood (block ζ; Fig. 2(d) and Table S14 in Appendix A). This pattern may be conducive to providing more energy sources for an adult individual.
《3.2. Variation in RNA expression》
3.2. Variation in RNA expression
DEGs were analyzed by comparing adjacent time points (e.g., E9d vs E11d, E11d vs E14d). Interestingly, we identified 2438 DEGs in the E11d versus E14d group (Fig. 3(a), Fig. S3 and Table S15 in Appendix A). Numerically, these DEGs account for approximately 10% of all protein-coding genes, a value approximately ten-fold higher than that recorded for any other group. Two-thirds of the DEGs were upregulated and involved in synapse assembly, axonogenesis, and nervous system development (red bars in Fig. 3(b)); all the downregulated DEGs were involved in cell division and the cell cycle (teal bars in Fig. 3(b)). Moreover, the distribution of differentially expressed lncRNAs and mRNAs between these two adjacent time points showed a pattern similar to that of the DEGs (Fig. 3(a), red star). Therefore, we called this phenomenon ‘‘fluctuation of RNA expression.”
《Fig. 3》
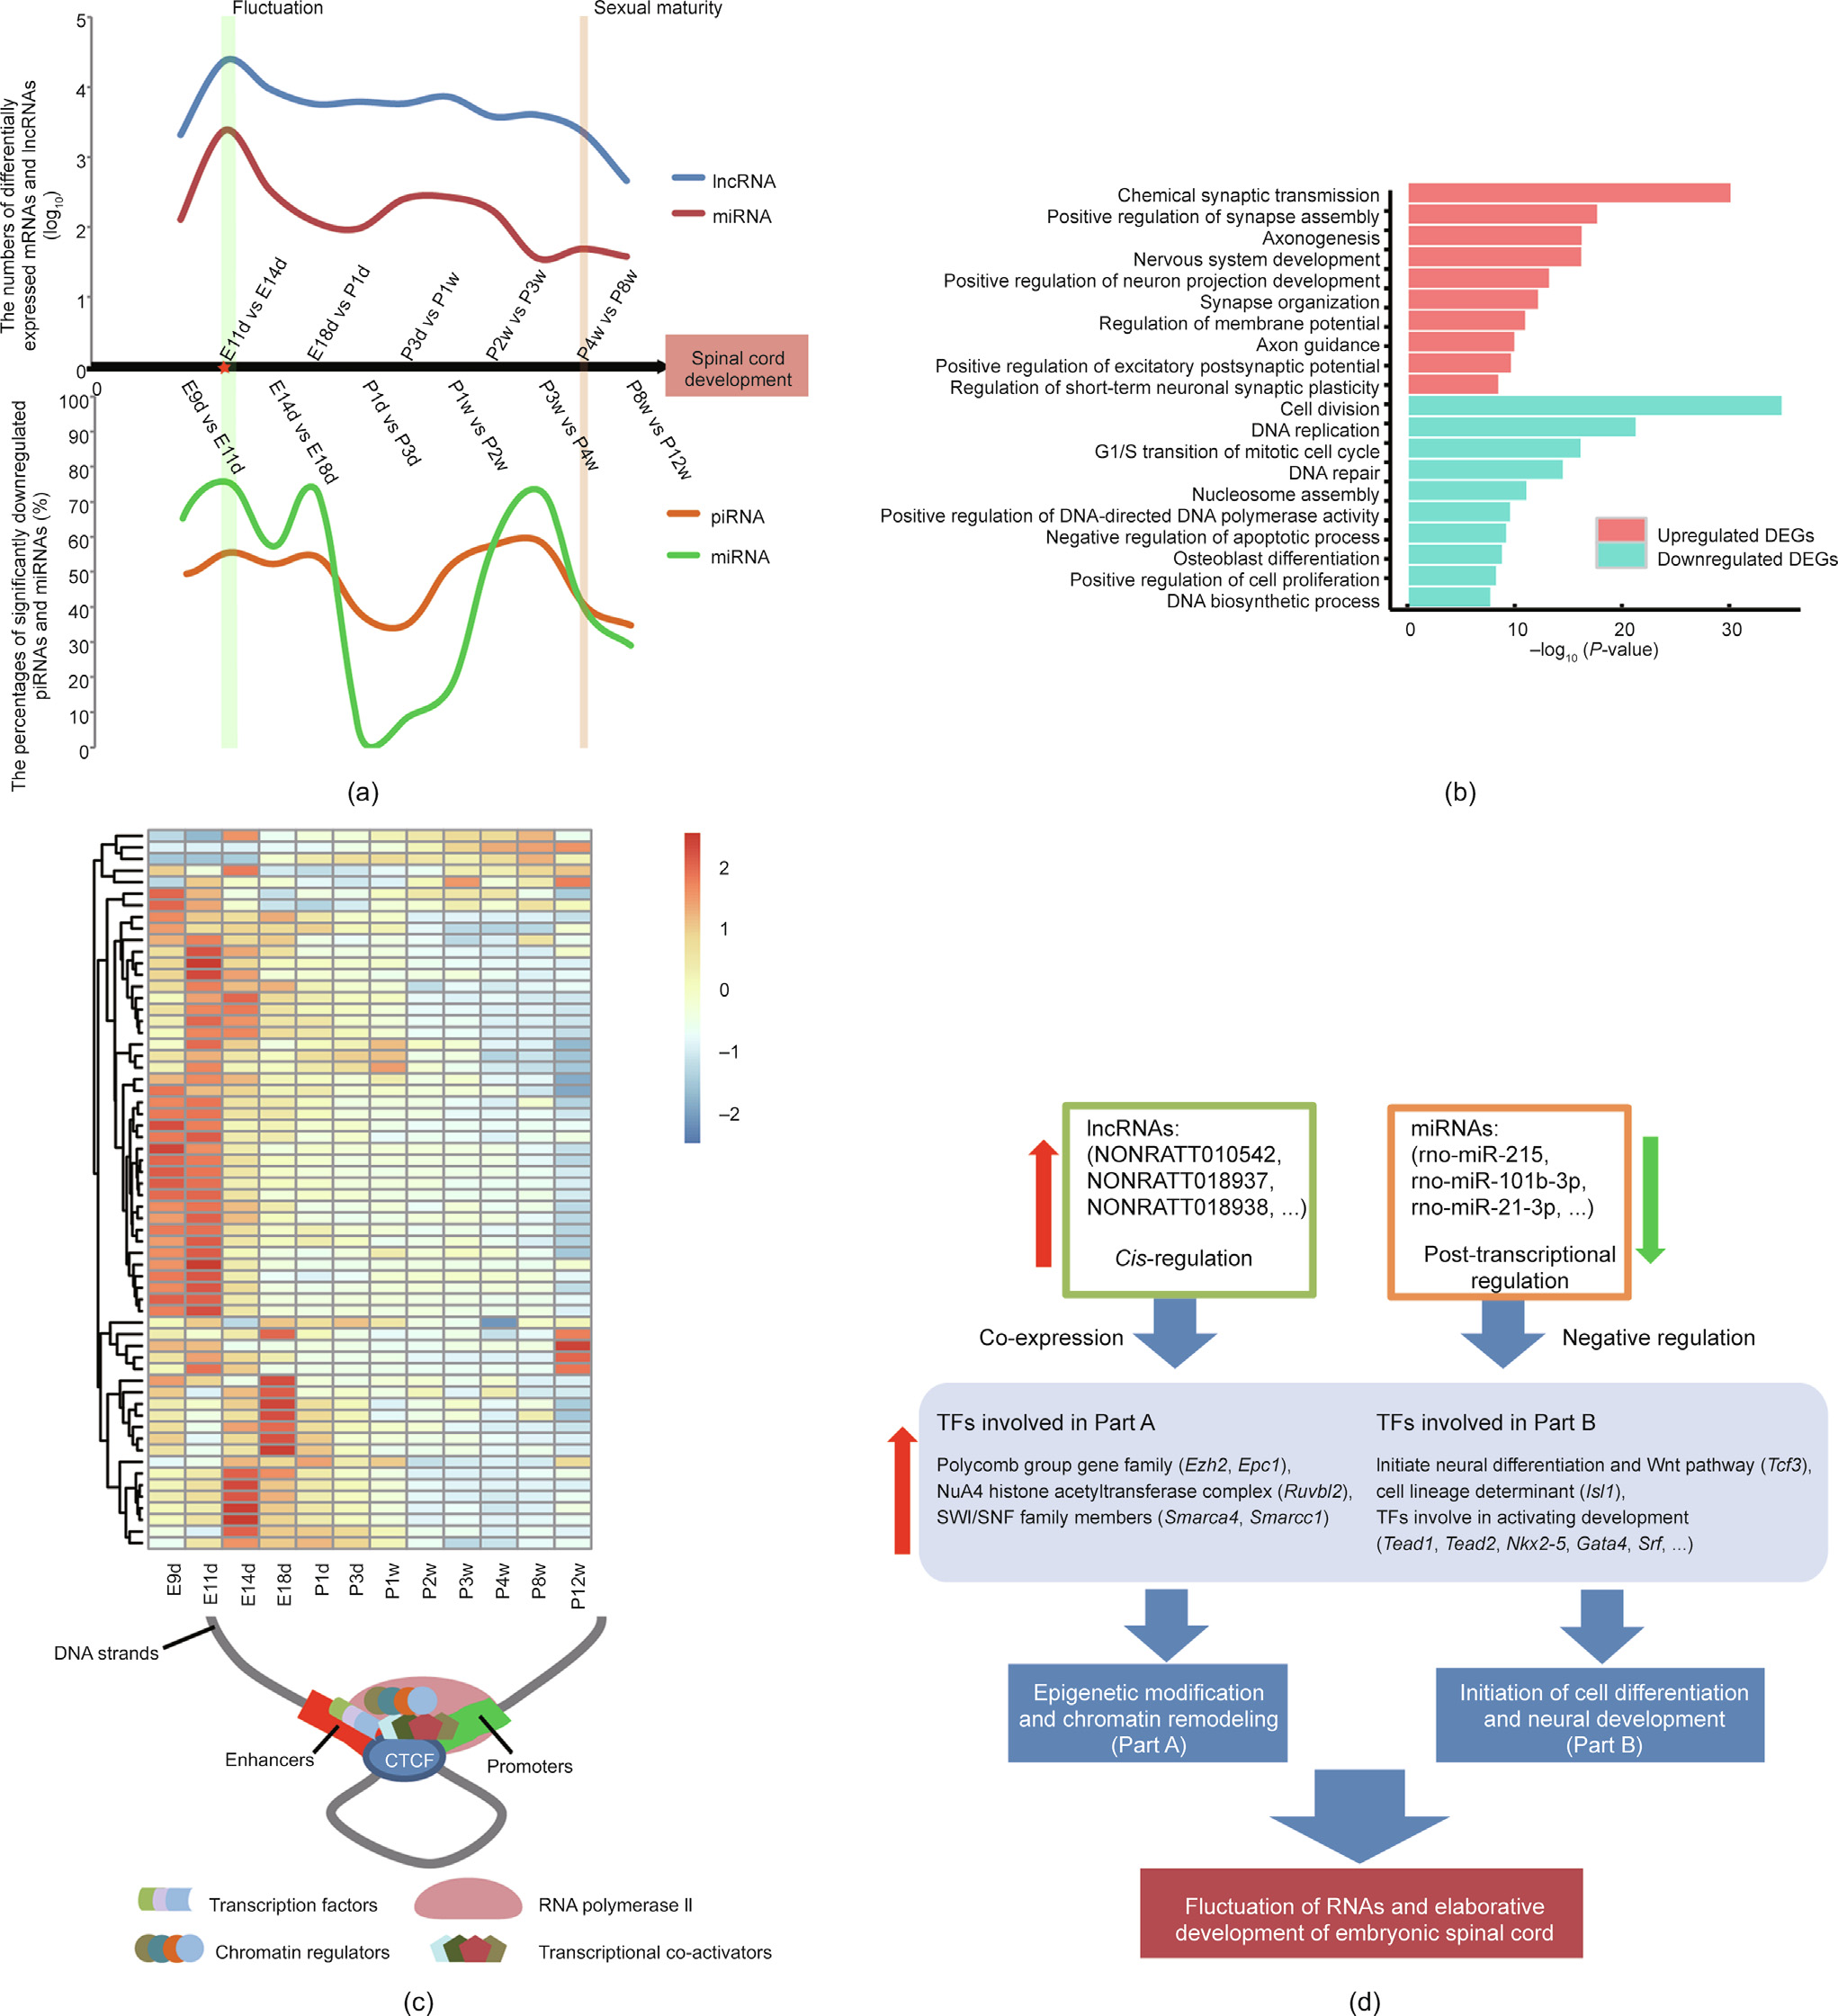
Fig. 3. RNA fluctuation and potential regulatory factors. (a) RNA fluctuation. The numbers of differentially expressed mRNAs and lncRNAs are represented by red and blue lines, respectively. The percentages of significantly downregulated piRNAs and miRNAs are represented by orange and green lines, respectively. (b) Gene ontology enrichment analysis of genes differentially expressed between stage E11d and E14d. Red and teal bars indicate the enrichment of upregulated and downregulated genes, respectively. (c) Upper panel shows the heatmap of the expression pattern of 57 TFs involved in enhancer binding (the color legend is the row Z-score of expression). Lower panel shows the chematic diagram indicating the potential gene regulatory model inferred from the TFs depicted in the heatmap. (d) Potential regulatory factors contributing to the RNA fluctuation and elaboration of the nervous system. SWI/SNF: switch/sucrose non-fermentable; Wnt: wingless/int-1 class.
To further investigate the potential regulatory factors contributing to this fluctuation in RNA expression, we performed additional analyses of miRNAs involved in the post-transcriptional regulation of gene expression. The number of downregulated miRNAs showed a substantial increase and comprised up to 76% of all differentially expressed miRNAs before E14d (Table S16 in Appendix A). An analysis using the miRWalk2.0 database [30] showed that, in the E11d versus E14d group, downregulated miRNAs were significantly enriched in the negative regulation of transcription elongation from RNA polymerase II promoter (P < 0.01), in the negative regulation of DNA-templated transcription (P < 0.01), and in the transcription regulatory region DNA binding (P < 0.01) (Table S17 in Appendix A). This marked increase in the number of downregu lated miRNAs may reduce the levels of mRNA degradation (Fig. 3(a)). piRNAs are known to mediate transcriptional silencing through Piwi–piRNA interactions [31]. We found that the ratio of downregulated piRNAs increased from E9d to E14d (Fig. 3(a), orange line; Table S18 in Appendix A). In addition to miRNAs and piRNAs, we identified 271 TFs acting upstream of the DEGs (Table S19 in Appendix A), 57 of which are involved in the molecular function of enhancer binding (Table S20 in Appendix A). Expression clustering analysis demonstrated that approximately 80% of the 57 TFs were expressed at high levels before the abovementioned fluctuation in RNA expression (heatmap in Fig. 3(c)). Cis-regulation of protein-coding genes via adjacent lncRNAs is a commonly occurring process [32]. We further identified 29 lncRNAs that were expressed near 13 TFs, 27 of which showed co-expression with their neighboring TFs (Fig. S4 and Table S21 in Appendix A). Interestingly, miRNAs targeting these 13 TFs were mainly expressed at low levels. Furthermore, these 13 TFs could be divided into two parts based on their molecular functions: Part A (e.g., Ezh2, Epc1, Ruvbl2, Smarca4, and Smarcc1), which consisted of TFs involved in epigenetic reprogramming and chromatin remodeling; and Part B (e.g., Tcf3, Isl1, Tead1, Tead2, and Nkx2-5), comprising TFs with roles in the initiation of cell differentiation and neural development (Fig. 3(d)). These potential upstream regulators (miRNAs, lncRNAs, and TFs) may synergistically contribute to the observed mRNA fluctuation. This fluctuation may participate in spinal cord patterning and regionalization of spinal cord tissue.
《3.3. Phase specificities of alternative splicing events》
3.3. Phase specificities of alternative splicing events
We identified five primary alternative splicing forms (alternative 3' splice site, A3SS; alternative 5' splice site, A5SS; mutually exclusive exon, MXE; retained intron, RI; and skipped exon, SE) from E9d to P12w. The observed patterns of DASEs indicated that most were SE events (51.4% of all events; Table S22 in Appendix A) [19]. The two peaks of DASEs coincided with the fluctuation period and the neonatal period (Fig. 4(a)). Genes underwent SE splicing events were enriched in biological processes such as neuron projection development (P < 0.01, at E11d vs E14d) and microtubule-based movement (P < 0.05, at E18d vs P1d), while those undergoing RI splicing events were enriched in biological processes such as membrane depolarization during action potential (P < 0.01, at E11d vs E14d) and cellular components of nucleoplasm (P < 0.01, at E18d vs P1d). The other three splicing events (MEX, A5SS, and A3SS) exhibited stable profiles over time (Fig. 4(a)). We noticed that genes associated with main components in the node of Ranvier, paranode, and juxtaparanode were distributed in two peaks of DASEs (E11d vs E14d and E18d vs P1d; Fig. 4(b) and Table S23 in Appendix A) [33]. The node of Ranvier and its surrounding domains are an evolutionary elaboration in jawed vertebrates, and alternative splicing performs an indispensable role in development, differentiation, and evolution [34,35]. Thus, the DASE results suggest that alternative splicing may be a driving force for the development of the node of Ranvier.
《Fig. 4》
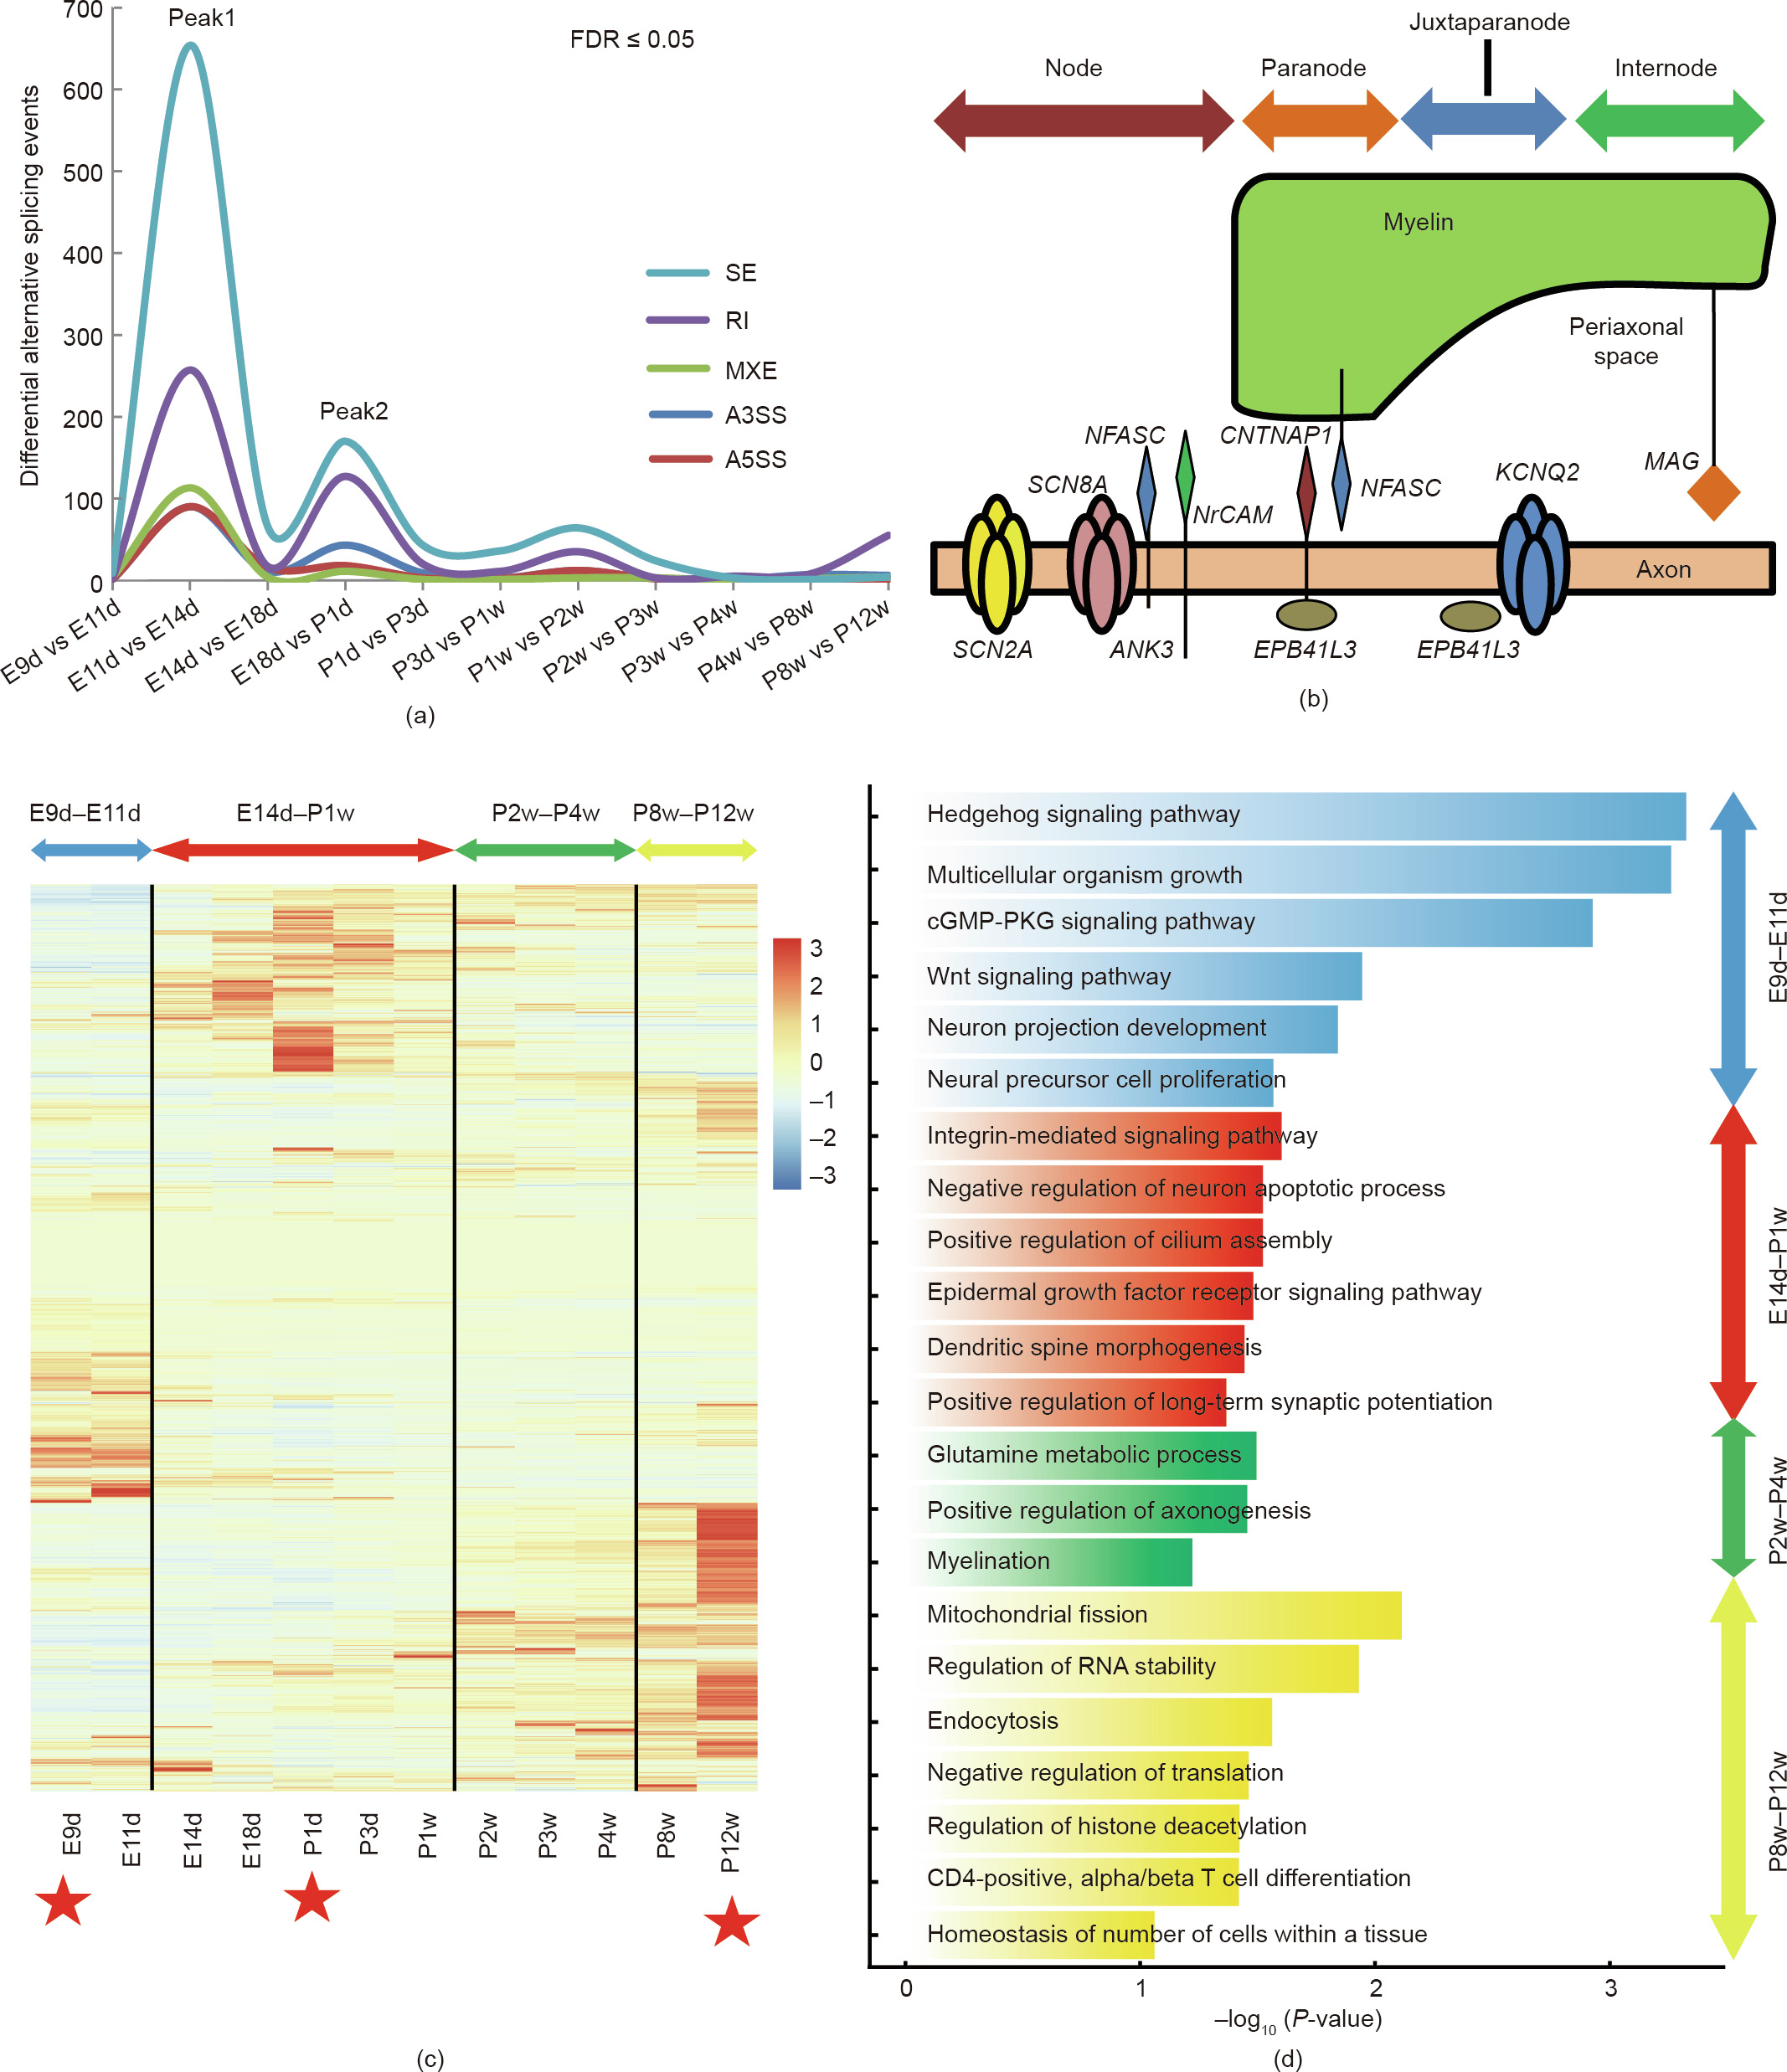
Fig. 4. Specific patterns of alternative splicing events during rat spinal cord development. (a) DASEs during rat spinal cord development (FDR ≤ 0.05). Colors indicate different alternative splicing events: SE (teal), RI (purple), MXE (green), A3SS (dark blue), and A5SS (red). (b) Schematic diagram showing the major components of the node of Ranvier. Genes coding for these components undergo DASEs and were found in Peak1 and Peak2 of part (a). (c) Expression patterns of gene isoforms with novel splicing variants. Red stars indicate reference time points. The color legend is the row Z-score of expression. (d) Representative biological processes of four stages: early embryonic stage (E9d– E11d, blue); later embryonic and neonatal stage (E14d–P1w, red); juvenile stage (P2w–P4w, green); and adult stage (P8w–P12w, yellow). cGMP: guanosine 3ʹ,5ʹ-cyclic monophosphate; PKG: protein kinase G; CD: cluster of differentiation.
Our results also showed that genes with novel splicing variants were mainly distributed around E9d, P1d, and P12w (Fig. 4(c)). We used these three time points as references and divided the developmental process into the following stages (Fig. 4(c)): ① an early embryonic stage (E9d–E11d); ② a later embryonic and neonatal stage (E14d–P1w); ③ a juvenile stage (P2w–P4w); and ④ an adult stage (P8w–P12w). We also performed WGCNA for these genes and obtained 27 co-expression modules (Fig. S5 in Appendix A). The functions of the 27 modules gradually switched from embryonic development, stem cell maintenance, and cell differentiation to functions related to myelination, the immune system, and maintenance of homeostasis (Fig. 4(d)). Our data provide a valuable resource for the further investigation of novel splice variants. Furthermore, RNA-binding proteins (RBPs) related to alternative splicing also exhibited similar temporal patterns (Fig. S6 in Appendix A). RBPs respond to changes in temperature or other environmental cues through phase separations, and change from soluble proteins to insoluble proteins that form membraneless organelles [36]. Twenty-four RBPs with predicted intrinsically disordered regions (IDRs, involved in phase separation [37]; Fig. S7 in Appendix A) were highly expressed at E9d and E11d (Fig. S8 in Appendix A). These RBPs might be involved in responding to microenvironmental signals in the spinal cord. CTCF, a protein with multiple key functions that include alternative splicing and regulation of gene transcription [38,39], was also highly expressed at E9d and E11d (Table S24 in Appendix A).
《3.4. Innate immunity and intrinsic growth capacity》
3.4. Innate immunity and intrinsic growth capacity
We found that module M7 (Fig. 1(d)) was significantly enriched in immune response genes (P < 0.01). Expression of genes in M7 was gradually upregulated after birth and peaked at sexual maturity (heatmap in Fig. 1(d)). We also found that many TFs were enriched in terms related to innate immunity after P3d. Next, as microglia are the primary innate immune cells in the central nervous system (CNS) [40], we analyzed the expression of genes involved in microglial proliferation, development, and activation. We found that the expression patterns of these genes, including that of Cx3cr1, a microglia-specific marker (Table S25 in Appendix A) [41], were similar to those of genes in module M7 (Fig. S9 in Appendix A).
To better understand the innate immunity and intrinsic growth capacity of the spinal cord, we investigated the factors potentially involved at different stages of development, and established an approximate framework (Fig. 5(a) and Table S26 in Appendix A). In the embryonic period (E9d–E18d), a high expression of genes related to stem cell maintenance, cell dedifferentiation (Figs. S1 and S10 and Table S26 in Appendix A), and the undeveloped innate immune system might bestow on the spinal cord a strong intrinsic growth capacity. However, genes related to these processes were downregulated in infancy and adolescence (P1d–P4w) (Figs. S9 and S10). Meanwhile, regulators (including TFs, miRNAs, and lncRNAs, such as Kdm6b, miR-124, and GAS5) with roles in homeostatic (M0) to alternative (M2) microglia polarization (which suppresses cell apoptosis and promotes regrowth [42]) showed a tendency to facilitate M2 microglia polarization (Table S26). Small increases in the levels of Toll-like receptors (TLRs) are conducive to inflammation control and wound healing [43–45]. The expression of most TLRs increased from P1d to P4w (Fig. S11 in Appendix A), which is suggestive of a positive influence for intrinsic growth capacity. In this period, therefore, damage caused by the immune system-related respiratory burst (RB) could be controlled to a certain degree, thereby maintaining the intrinsic growth capacity of the spinal cord. Following sexual maturity (P8w–P12w), we found that the expression of genes associated with the intrinsic growth capacity of the spinal cord changed (Table S26), especially that related to innate immunity maturation (Fig. S9). The expression changes of regulators (such as TLRs, miR-21, and miR-101) may promote M0 to M1 microglia polarization (Table S26). The interleukin 4 receptor (IL4R) and its ligand IL4 reprogram M0 microglia to M2 microglia [42]. We found that Il4r was significantly downregulated in P12w (Table S27 in Appendix A), which may impair reprogramming. Pattern recognition receptors, such as TLR4 and caspase 4 (CASP4), which facilitate M0 to M1 microglia polarization [46], exhibited sustained high expression after birth (Table S28 in Appendix A), which may lead to increase ratio of M1 microglia in the spinal cord. Massive microglial repopulation occurs in the CNS of adult mammals after injury [47], resulting in the generation of a large number of M1 microglia that can induce a severe RB in the spinal cord. In addition, the dual leucine zipper kinase (DLK), which is necessary for the retrograde transport of injury-related signals during axon repair [48], showed a significant decline after birth (Table S29 in Appendix A), which may reduce the intrinsic growth capacity of the spinal cord. Taken together, these data suggest that complex interactions in the spinal cord may support the establishment of vicious cycles that lead to chronic and progressive neurodegeneration, ultimately resulting in a failure of spinal cord regeneration (Fig. 5(a)).
《Fig. 5》
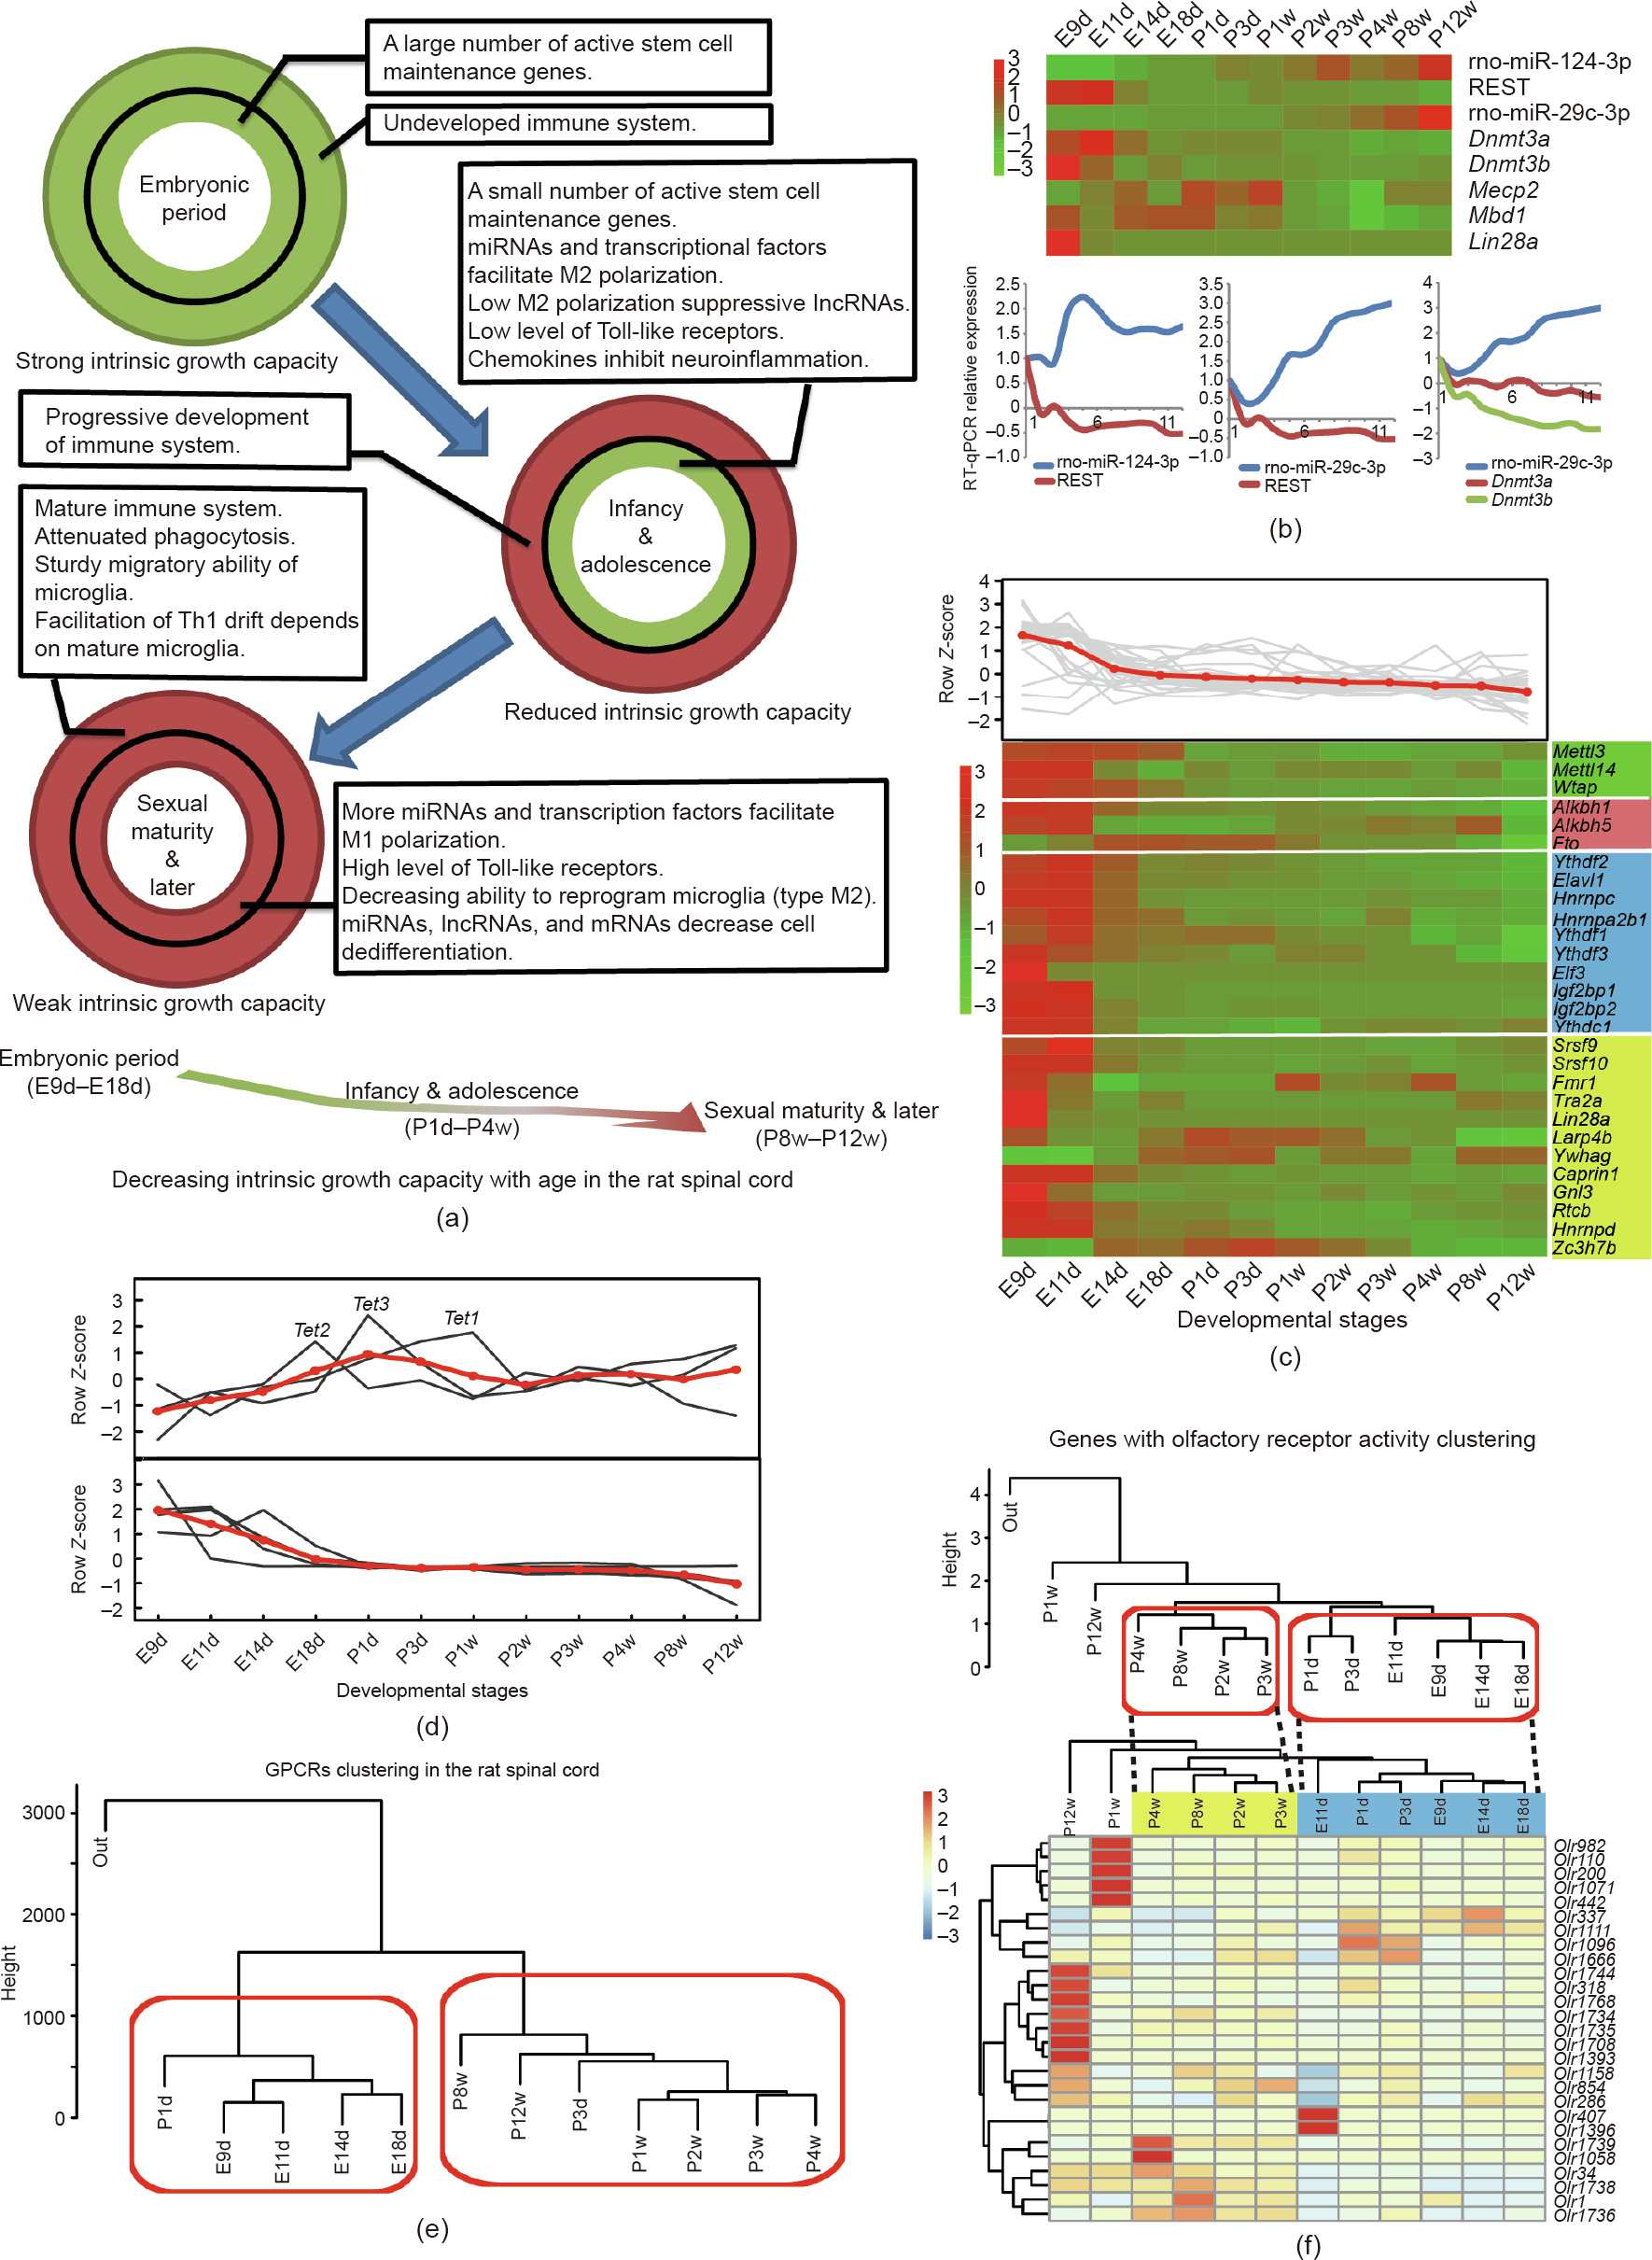
Fig. 5. Gradual reduction in tissue growth capacity and features of epigenetic modification and G protein-coupled receptors (GPCRs). (a) Schematic diagram showing the decreased intrinsic growth capacity with continued development. Circles represent factors that influence intrinsic growth capacity during development. Green and red colors represent favorable and unfavorable conditions for promoting intrinsic growth capacity, respectively. Intrinsic growth capacity is decreased with continued development (bottom panel). (b) Expression patterns of genes involved in CpH methylation. (c) Expression trend of genes involved in N6 -methyladenosine (m6A) methylation. The color blocks indicate genes involved in different processes, namely: m6A methylation (green), reverse m6A methylation (red), readers of m6A methylation (blue), and correlative RBPs (neon green). (d) Expression trends of ten-eleven translocation (TET) protein family. Upper panel shows expression trends for Tet1, Tet2, and Tet3; lower panel shows expression trends of five TET regulatory factors (Lin28a, Vprbp, Ogt, Parp1, and Sin3a). The red line shows the average expression patterns of the analyzed genes. (e) Temporal clusters of GPCRs. (f) Expression patterns of genes with olfactory receptor (OR) activity. Upper panel shows temporal clusters of 421 ORs; lower panel shows temporal clusters and heatmap of 27 relatively highly expressed ORs (FPKM ≥ 0.3). Th1: T helper type 1; REST: RE1 silencing transcription factor. The color legends in (b), (c), and (f) are the row Z-score of expression.
《3.5. Epigenetic modifications and G protein-coupled receptors》
3.5. Epigenetic modifications and G protein-coupled receptors
Epigenetic modifications are important regulators in neuronal development. We analyzed genes involved in three epigenetic modifications during spinal cord development: CpH methylation (non-CpG, where ‘‘H” can be adenosine, cytosine, or thymine); N6 -methyladenosine (m6A) methylation; and active DNA demethylation. First, CpH methylation is a critical regulator of CNS maturation and is maintained by DNA methyltransferase 3 alpha (DNMT3A) [49,50]. RE1 silencing transcription factor (REST) can regulate Dnmt3a through miR-29c-3p [51]. Dnmt3a showed a continuous and slowly downregulated expression pattern before birth, which may lead to an accumulation of CpH methylation in the early stages of development (Fig. 5(b)) [49]. Second, m6A methylation is related to alternative splicing and mRNA stability [52,53]. Our data showed that most genes involved in m6A methylation exhibited a slowly downregulated tendency (Fig. 5(c)), which suggests that m6A methylation might have settled into an overall dynamic equilibrium in development [54–56]. Third, expression of ten-eleven translocation (TET) protein family indicated that active DNA demethylation events probably occurred around the perinatal period (Fig. 5(d) and Table S30 in Appendix A). The expression of five major TET regulators (Lin28a, Vprbp, Ogt, Parp1, and Sin3a) [57–61] was decreased in the embryonic period (Fig. 5(d)). These data indicated that active DNA demethylation may play a key role in gene regulation around the perinatal period.
G protein-coupled receptors (GPCRs) comprise the largest receptor superfamily in mammals [62]. A total of 883 genes with GPCR activity were annotated (GO:0004930). Hierarchical clustering analysis of 12 time points based on GPCR expression showed two temporal clusters: E9d–P1d and P3d–P12w (Fig. 5(e)). Moreover, GPCRs could be divided into three gene clusters (Fig. S12 in Appendix A). Pathways related to olfactory transduction (KEGG PATHWAY: rno04740), neuroactive ligand–receptor interaction (KEGG PATHWAY: rno04080), and the calcium signaling pathway (KEGG PATHWAY: rno04020) were significantly enriched (P < 0.01) among the three clusters. Previous studies have shown that olfactory receptors (ORs) are highly expressed in the olfactory epithelium and sperm, whereas their expression is low in other tissues [63,64]. We found that the expression of 421 genes with OR activity changed in the spinal cord at around the newborn period (Fig. 5(f), upper panel). In addition, 27 relatively highly expressed ORs (FPKM ≥ 0.3) exhibited a similar change (represented by dotted lines in Fig. 5(f), lower panel). Furthermore, WGCNA of all the expressed genes indicated that ORs were also found in modules M6 and M10, and were enriched in the terms of embryonic development and axon growth, respectively. ORs act as chemoreceptors, and their low expression may play pleiotropic roles in spinal cord development.
《4. Conclusions》
4. Conclusions
In summary, we have generated extensive transcriptome data covering 12 time points during spinal cord development comprising embryonic, neonatal, juvenile, and adult developmental periods. To the best of our knowledge, this is the most long-term, transcriptome-based time-course analysis of spinal cord development in the rat. Through bioinformatic analyses, we explored the landscape of molecular events occurring in the developing spinal cord, including differential gene expression, co-expression networks, stage-specific expression patterns, and alternative splicing events. Differential expression analyses of two neighboring periods showed fluctuations in mRNA expression that were suggestive of high gene regulatory activity before E14d, which is a critical period for the transition from neural tube to spinal cord development [65]. We found that genes related to the innate immune system were gradually upregulated with continued development (especially in the postnatal period), suggesting that a negative correlation may exist between innate immunity and the intrinsic growth capacity of the spinal cord [66]. Our result also showed that genes associated with the node of Ranvier underwent a higher number of DASEs, suggesting that an increased diversity of isoforms may have contributed to the evolutionary appearance of the node of Ranvier in jawed vertebrates [67,68]. This study provides a valuable resource for studying transcriptional changes throughout spinal cord development. Our temporal transcriptome data may be integrated with the increasing spatial, single-cell data generated by other studies. This study also provides a holistic reference framework for regenerative medicine and the improvement of spinal cord-related tissue engineering technology.
《Acknowledgments》
Acknowledgments
This work was supported by the National Natural Science Foundation of China (31730031), the National Key Research and Development Program of China (2017YFA0104700 and 2016YFC1101603), and the Jiangsu Provincial Key Medical Center and Priority Academic Program Development of Jiangsu Higher Education Institutions (PAPD).
《Availability of data and materials》
Availability of data and materials
RNA-Seq and miRNA-Seq data for different development stages of the rat spinal cord have been deposited in the NCBI database with the BioProject accession tag PRJNA505253.
《Compliance with ethics guidelines》
Compliance with ethics guidelines
Jian Yang, Lili Zhao, Sheng Yi, Fei Ding, Yumin Yang, Yan Liu, Yongjun Wang, Mei Liu, Chengbin Xue, Lian Xu, Leilei Gong, Xinghui Wang, Yu Zhang, Bin Yu, Guo-li Ming, and Xiaosong Gu declare that they have no conflict of interest or financial conflicts to disclose.
《Appendix A. Supplementary data》
Appendix A. Supplementary data
Supplementary data to this article can be found online at https://doi.org/10.1016/j.eng.2021.10.001.


 京公网安备 11010502051620号


