

《1. Introduction》
1. Introduction
Bohai Bay is the largest inland sea in China. The bay blocks all the cities from the northeast provinces to the eastern and southern coasts of China, which severely affects the channel for coastal passage. To alleviate this traffic situation, in 2012, the Chinese Academy of Sciences launched a research project for the construction of the Bohai Strait Cross-Sea Channel. The Bohai Strait Cross-Sea Channel connects Yantai and Dalian; the project plan entails adopting a submarine railway tunnel with a total length of 110–130 km [1]. The weather and sea conditions along the route are considerably different, which necessitates a highly durable structure. To provide a theoretical basis for the concrete mix design of the Bohai Strait Cross-Sea Channel, it is particularly important to conduct research on the durability of concrete structures in the relevant sea areas.
Dalian is located in northern China and is the end point of the Bohai Bay Cross-Sea Channel. According to the design requirements of the ‘‘Standard for durability design of concrete structures” (GB/T50476–2019) [2], the marine concrete structures in Dalian are located in a Class III marine chloride corrosion environment. Furthermore, the function grade ranges from severe (grade D) to very severe (grade E), resulting in extremely high requirements for the durability of the concrete used in these structures. Thus, a scientifically determined and reasonable durability design scheme must be formulated to ensure the safety of concrete structures in the Dalian area.
The theoretical basis for the durability analysis of concrete structures is the chloride diffusion theory based on Fick’s second law, which has been widely used for the durability design of concrete structures in marine environments [3–6]. Currently, the service life design models for concrete structures are mainly improved models based on Fick’s second diffusion law; among these, the most well-known models are the DuraCrete design model [7] and the Life-365 service life prediction model [8]. The DuraCrete design model is a durability design method for concrete structures based on probability, and the model formula is expressed as follows:

where Cx (in mass percentage of the binders) is the chloride concentration at a certain depth x (m), Cs is the surface chloride concentration (in mass percentage of the binders), KM is the material influence coefficient, Ke is the environmental influence coefficient, Kc is the influence coefficient of chloride diffusion, t0 is the reference age (28 d), D0 is the chloride diffusion coefficient at the exposure time t0 (m2 ·s–1 ), m is the time-dependent index of the chloride diffusion coefficient, t is the exposure age of structural elements, and erf is the mathematical error function.
The DuraCrete design model has been successfully applied for the durability analysis of ocean engineering structures such as the Danish–Swedish Øresund Bridge [9], the submerged tunnel between the southern seashore of the Korean peninsula to an island [10], and the Hong Kong–Zhuhai–Macao sea link project in China [11]. However, the DuraCrete design model has the following characteristics: ① The model assumes that the chloride diffusion coefficient (Dt) decreases with time, whereas in practice, Dt tends to remain stable after reaching a certain age [8]; ② the model assumes that the boundary conditions remain constant, that is, Cs does not change with time, whereas in practice, Cs gradually increases with time and tends to remain stable after a certain time [12–16]; ③ the model does not consider the chloride binding capacity; and ④ the environmental influence coefficient (Ke), which affects the chloride diffusion coefficient, is obtained from short-term test data, due to which the reliability is relatively low.
The Life-365 service life prediction model [8] considers the variations in Dt and Cs with time, both of which approach constant values after varying for a certain period of time. One of the model formulas is expressed as follows:

where K' is a constant.
The Life-365 service life prediction model has been applied for the durability analysis of many marine concrete structures [17,18]. However, this model uses laboratory data to evaluate the durability of concrete structures in actual environments, without considering the concrete degradation caused by the difference between indoor and outdoor environments. The chloride binding behavior is not considered either.
Yu [19] and Yu et al. [20] proposed a theoretical model of chloride diffusion in concrete based on Fick’s second law; this model comprehensively accounts for various factors such as the chloride binding capacity (Rb), the time dependence of chloride diffusion (m), and the environmental effects (deterioration coefficient K). The model also resolves the long-term problem that Fick’s diffusion theory is inconsistent with the actual service lives of concrete structures; this is discussed in detail in Section 2.1.
As discussed above, the durability parameters of concrete structures are directly related to the analysis results of their service life. However, thus far, research on the durability parameters of the concrete structures in Northeast Asia has been non-systematic, and the effects of the different time-varying relationships of the surface chloride concentration and chloride diffusion coefficient on the service life remain unknown. In this study, the values, ranges, and types of distribution of the durability parameters applied for the durability design in ocean engineering in northern China were confirmed. Based on the modified chloride diffusion theory and the reliability theory, the corrosion times of the steel in concrete under different service environments in the Dalian sea area were predicted with failure probabilities of 5% and 10%. The mixture proportions meeting the requirement of a service life of 100 or 120 years were determined, and a cover thickness requirement was proposed. In addition, the effects of different time-varying relation ships of the boundary condition and diffusion coefficient on the service life were compared. The results of this study are expected to provide theoretical guidance for the design of marine concrete structures in northern China.
《2. Theoretical model and experimental methodology》
2. Theoretical model and experimental methodology
《2.1. Modified theoretical model of chloride diffusion》
2.1. Modified theoretical model of chloride diffusion
The service life design theory for concrete structures adopted in this study was based on a modified theoretical model of chloride diffusion. The theoretical derivation process is as follows:
The basic form of the chloride diffusion equation for concrete [21] can be expressed as follows:

where Cfree is the free chloride concentration at a depth of x (in mass percentage of the concrete), Ctotal is the total chloride concentration (in mass percentage of the concrete), and Df is the diffusion coefficient of free chloride (m2·s–1 ).
The relationship among Cfree, Ctotal, and the bound chloride concentration (Cb) in concrete is as follows:

where Cb is the bound chloride concentration (in mass percentage of the concrete).
Substituting the derivative of Eq. (4) into Eq. (3) yields

Chloride ions exert adsorption and binding effects on the concrete during the transport process. Tuutti [22], Arya and Newman [23], Mohammed and Hamada [24], and Yu [19] found that the chloride adsorption relationship of concrete is mainly linear:

Therefore, Eq. (5) can be written as follows:

Concrete, as a type of heterogeneous material, can exhibit defects such as microcracks due to external factors, including temperature stress, chemical corrosion, and freeze–thaw cycles, or internal factors, including self-shrinkage and alkali aggregate reactions. These microcracks accelerate the diffusion of chloride in the concrete. Therefore, the deterioration of concrete must be considered during theoretical modeling. A comprehensive deterioration coefficient K was introduced to describe several complex factors. K is the ratio of the diffusion coefficient of free chloride for concrete in the actual environment and the diffusion coefficient of free chloride for concrete under laboratory standard conditions; it reflects the influence of the actual service environment on chloride diffusion:

where Dtlab is the diffusion coefficient of free chloride for concrete under standard laboratory conditions (m2 ·s –1 ).
Thomas and Bamforth [25] found that the chloride diffusion coefficient decreased exponentially with exposure time, which can be expressed as follows:

When the exposure condition is indoor environment, Dt is equal to Dtlab. By substituting Eqs. (8) and (9) into Eq. (7), the modified theoretical model of chloride diffusion can be obtained [19,20]:

In an actual chloride exposure environment, the boundary condition of the modified theoretical model (i.e., Cs) does not remain constant nor does it increase continuously; instead, it changes from low to high concentration over time and gradually reaches saturation [12–16]. Xu et al. [26] performed statistical analyses on 144 groups of Cs data obtained from laboratories, on-site exposure stations, and actual engineering structures in China, Republic of Korea, Japan, the United Kingdom, the United States, Canada, and Saudi Arabia. The analysis results showed that Cs and the exposure time follow Eq. (11):

where C0 is the initial chloride concentration in the concrete (in mass percentage of the concrete), and Cs is the surface chloride concentration, whose unit is the mass percentage of concrete when the service life analysis is carried out in this study. k is the timedependent constant of Cs.
According to the Life-365 service life prediction model [8], the value of Cs does not increase after 7.5, 15, or 25 years (as expressed by t1) but remains stable. In addition, in the Life-365 service life prediction model, Df does not decrease continuously throughout the service period but instead remains stable after reaching a certain exposure time (t2); generally, t2 = 25 or 30 years. Fig. 1 shows the time variation laws of Df and Cs.
Based on the time-varying relationships of Cs and Df, the variation laws of the initial and boundary conditions can be divided into three stages:
(1) 0 < t < t1:

(2) t1 ≤t < t2

(3) t ≥ t2:

Under the initial and boundary conditions during the three stages, the calculation method for the modified theoretical model is detailed in ‘‘ChaDuraLife V1.0 life prediction model and software of concrete structures in chloride environment” [27]. For the durability analysis in this study, the reliability theory, which is typically used in engineering analyses, was adopted. The resistance factor was the critical chloride concentration (Ccr) of the steel, and the load effect was Cfree on the surface of the steel. Thus, the following function can be obtained:

where Z is reliability function.
If Ccr ≤ Cfree is satisfied, that is, if the free chloride concentration on the steel surface reaches the critical chloride concentration, then the failure probability of the concrete structure can be obtained:

where Φ is the standard normal distribution function, Pfailure is the failure probability, and β is the reliability index.
《Fig. 1》

Fig. 1. Time variations of Df and Cs.
《2.2. Raw materials》
2.2. Raw materials
P.O42.5 Portland cement was purchased from the Dalian cement plant. Class I fly ash was procured from the Dalian Huaneng Power Plant, and grade-S95 ground slag was procured from Dalian Jinqiao Company. River sand with a fineness modulus of 2.6 was used as the fine aggregate, and the coarse aggregate was local gravel from Dalian with a continuous grading of 5–25 mm. A polycarboxylate-based superplasticizer with a 26.3% waterreducing rate was used; this was obtained from Dalian Shenwei Building Materials Products Co., Ltd. Furthermore, the rosin hot polymer air-entraining agent produced by Qingdao Keli Building Materials Co., Ltd. and tap water from Dalian City were used. The mix proportions of concrete are listed in Table 1.
《Table 1》
Table 1 Mix proportions of concrete.

W/B: water–binder ratio in weight.
《2.3. Specimen preparation》
2.3. Specimen preparation
The raw materials, including the cement, aggregates, mineral admixtures, and admixtures, were uniformly dry mixed in a mixer for 1 min and then mixed with water for 3 min. The fresh concrete was placed into molds after mixing, vibrated for 30 s, and finally allowed to form the concrete specimens. The dimensions of the mold were 100 mm × 100 mm × 100 mm. All the test specimens were cured at room temperature for the first 24 h prior to demolding. After demolding, the specimens were cured in a standard room at a temperature of (21 ± 1) °C and a relative humidity exceeding 95%. The curing age was 28 d, and mechanical and durability tests were conducted after curing.
《2.4. Exposure test and analysis method》
2.4. Exposure test and analysis method
Exposure tests were conducted after standard curing. Marine environments are complex, and seawater contains multicomponent ions, as shown in Table 2. Compared with single ion transport, the electrochemical coupling effect between multiple ions has a certain influence on the transport of chloride in concrete [28–30]. Therefore, an actual marine environment was used for the exposure test. The exposure location was the prefabrication plant of CCCC First Harbor Engineering Co., Ltd. in Ganjingzi District, Dalian, adjacent to Dalian Bay. Located in the northeast, the average temperature of Dalian is 10.5 °C, with the highest temperature of 37.8 °C and the lowest temperature of –19.13 °C. The exposure environment was divided into three zones: splash, tidal, and underwater zones. Test specimens with each mixture proportion were placed in the three zones for the exposure tests, as shown in Fig. 2. Parallel exposure tests were conducted in the laboratory. Seawater obtained from Dalian Bay was used as the immersion solution, and the indoor temperature was maintained at (21 ± 1) °C.
《Table 2》
Table 2 Chemical composition of seawater in Dalian Bay.

《Fig. 2》
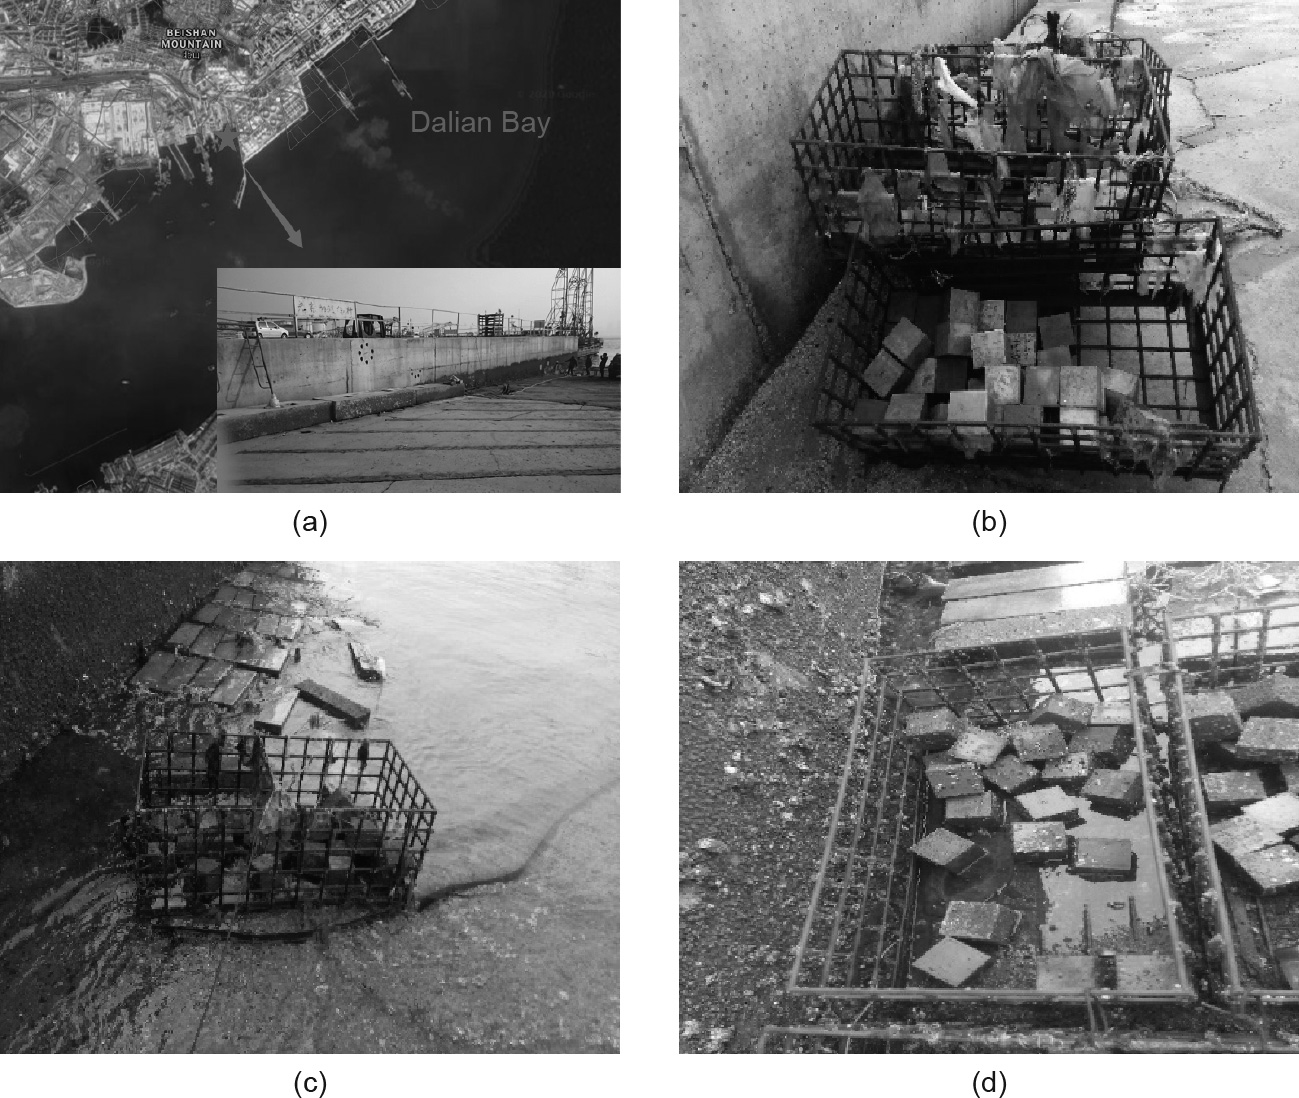
Fig. 2. Field exposure test. (a) Location of exposure station; (b) splash zone; (c) tidal zone; (d) underwater zone.
After the specimens were cured for 28 d, their mechanical properties were tested, and compressive strength tests were conducted according to the relevant standard [31]. The specimens were drilled and sampled after exposure up to a certain age. The drill bit used was an alloy bit with a diameter of 6 mm, and the exposed cube specimens were drilled diagonally at fixed positions on two opposite sides. The sampling depths of each specimen were 0–5, 5–10, 10–15, and 15–20 mm. The coarse particles were removed using a sieve with a hole diameter of 0.16 mm, and the powdered samples from different depths in the concrete were collected. Fig. 3 shows the sampling locations of the specimens, where number 1 indicates the sampling location at the first exposure age and number 2 indicates the sampling location at the second exposure age. The total chloride ion concentration and free chloride ion concentration in the concrete were determined according to the relevant standard [32]. After the specimens were sampled, they were plugged with a mortar. The mix proportions of the mortar were the same as those of the original concrete mixture without any coarse aggregates. After the hole was plugged for 14 d, the specimens were placed in the exposure location to continue the exposure tests. Owing to the large number of test specimens, the specific sampling times of the different specimens at each exposure age were slightly different.
《Fig. 3》
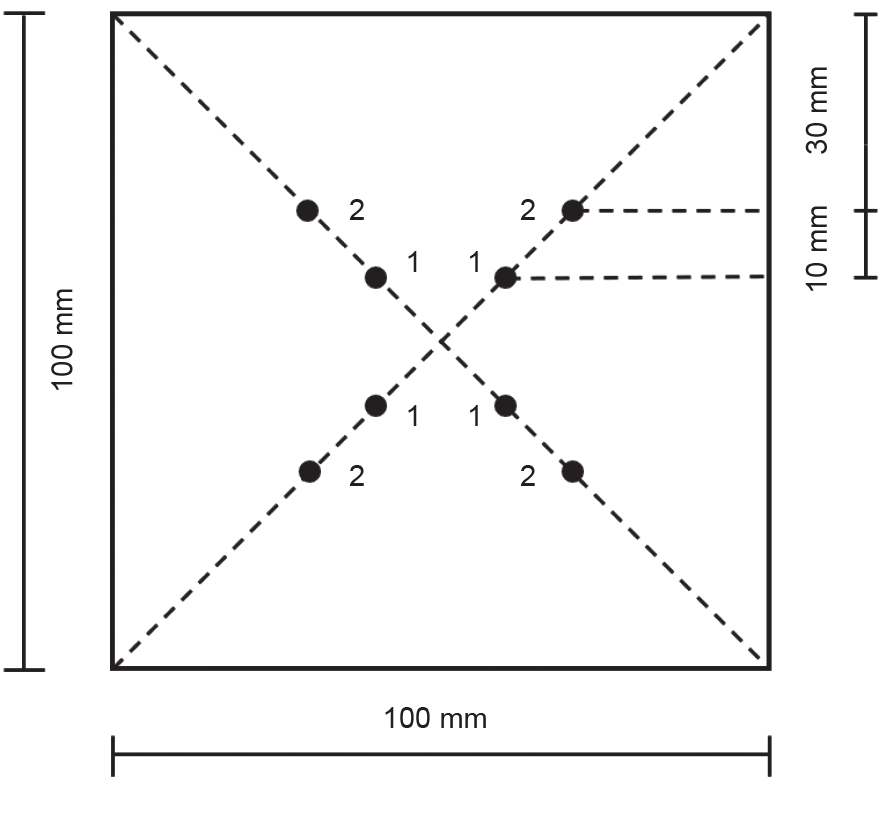
Fig. 3. Sampling locations of specimens.
《3. Results and discussion》
3. Results and discussion
《3.1. Durability parameters of marine concrete》
3.1. Durability parameters of marine concrete
3.1.1. Chloride diffusion coefficient (D0) and time-dependent index (m)
Table 3 shows the compressive strengths of the samples with different mix proportions, and the variations in the chloride concentrations of the specimens immersed in indoor seawater are shown in Fig. 4. Cfree decreased quadratically with the diffusion depth. The method adopted for calculating the Cs value is as follows. Using regression analysis for the Cfreevalues at average depths of 2.5, 7.5, 12.5, and 17.5 mm, a quadratic function relating Cfree and the diffusion depth was obtained. By setting the diffusion depth to 0 in the regression formula, the Cs value was obtained.
《Table 3》
Table 3 Cube compressive strengths for different mix proportions (MPa).

《Fig. 4》
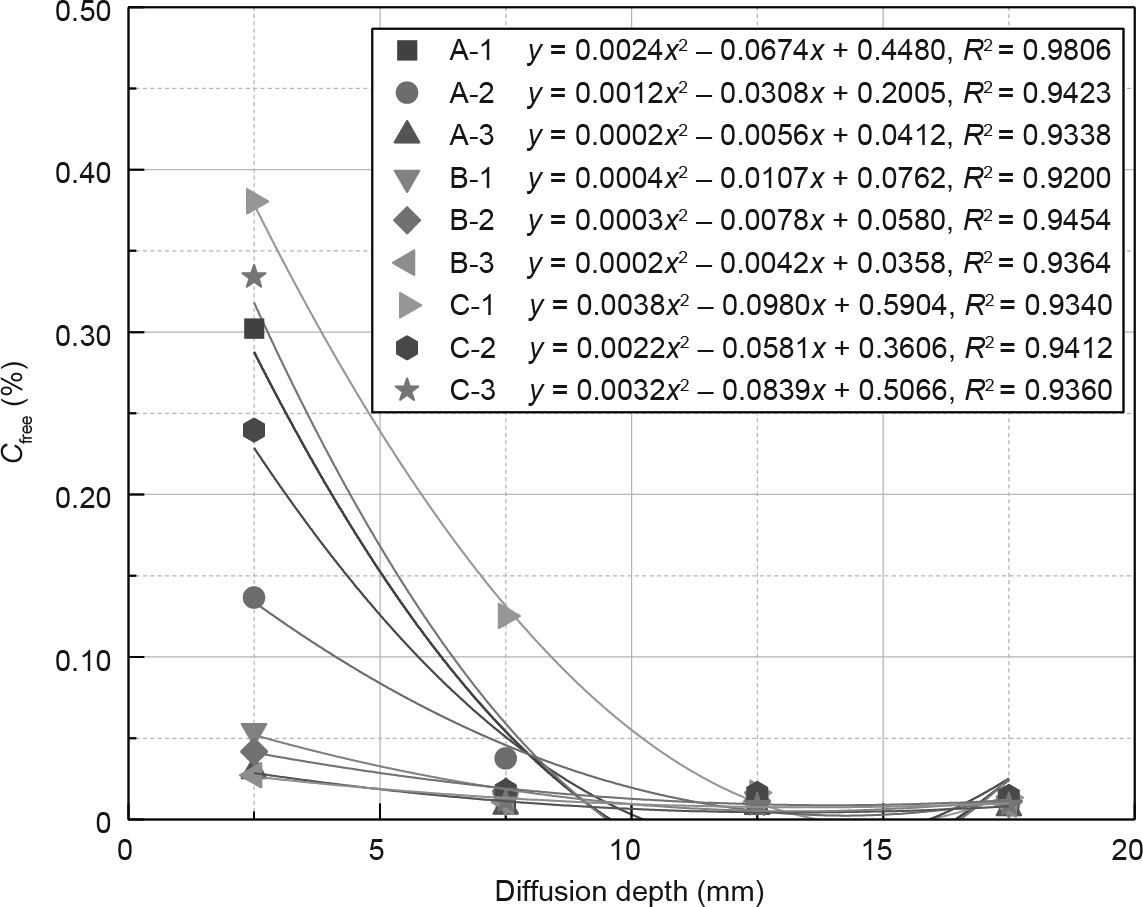
Fig. 4. Diffusion of Cfree under indoor natural diffusion conditions.
Yu [19] and Yu et al. [33,34] established a chloride diffusion model in a finite body with a constant homogeneous boundary condition based on a three-dimensional condition, as follows:

where L1, L2, and L3 are the lengths of concrete specimens in the x-, y-, and z-directions (mm), respectively.
Using Eq. (15), the chloride diffusion coefficient of concrete at exposure time t can be obtained. The Dtlab values for each mix proportion at different exposure times are listed in Table 4.
《Table 4》
Table 4 Dtlab for different mixture proportions.

During the durability design and service life analysis of a concrete structure, the reliability of the calculation results is determined based on the reasonability of each parameter. Yu et al. [34] investigated the chloride concentration data collected from 2207 marine exposure stations and practical projects in 20 countries. The temporal variation in Dt was systematically studied, and a universal m value of 0.6304 was proposed, as shown in Fig. 5. The number of concrete samples was sufficiently large and the exposure time span was wide (7 d to 91 years); hence, it was reasonable to select this m value for the service life design. Combined with the Dtlab values at different exposure times, shown in Table 4, and the value of the long-term time-dependent index m (0.6304), the chloride diffusion coefficient at 28 d (D0) could be obtained based on the diffusion coefficient evolution formula (Eq. (9)). The specific results are presented in Table 5. It is evident from the results that the chloride diffusion coefficient of concrete under the same water–binder ratio decreases with an increase in the slag content, indicating that slag can reduce the chloride diffusion coefficient of concrete; this is consistent with the conclusions of many studies [35–37].
《Fig. 5》
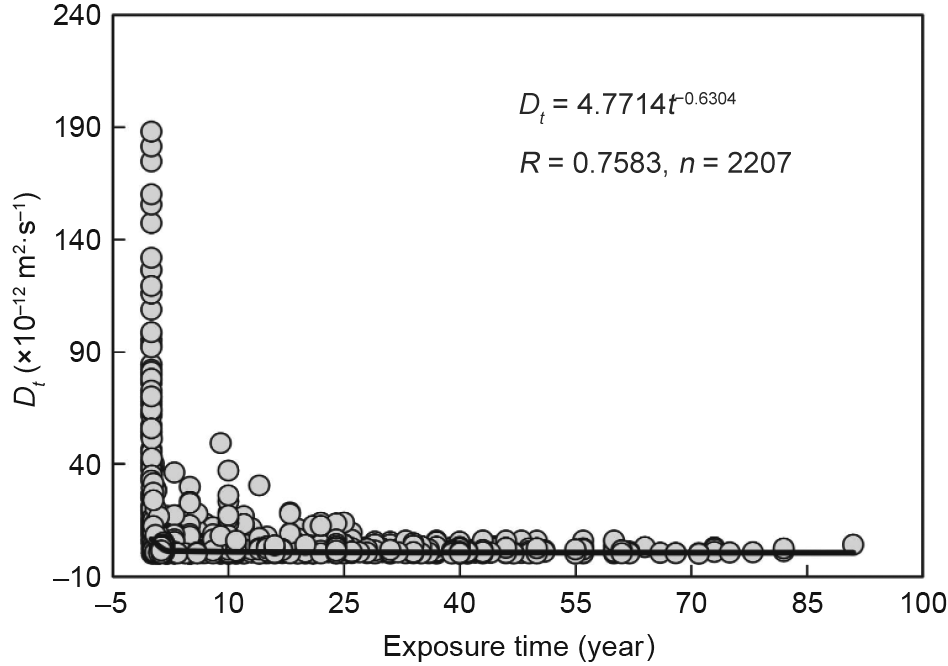
Fig. 5. Temporal changes in Dt [34] (n is sample number).
《Table 5》
Table 5 D0 for different mix proportions.

3.1.2. Chloride binding capacity (Rb)
Through chemical analyses, the Cfree and Ctotal values for the different mix proportions were obtained. Using Eqs. (4) and (6), the relationship between Cfree and Ctotal was obtained, as shown in Eq. (16), and the Rb value could then be obtained. Fig. 6 shows the Cfree and Ctotal results for each mix proportion, as obtained from the chemical analyses. Furthermore, using regression analysis, Rb was determined to be 0.36.

《Fig. 6》

Fig. 6. Chloride binding capacity.
3.1.3. Critical chloride concentration (Ccr)
Ccr refers to the critical chloride concentration that can destroy the passive film of the steel surface; it is of great significance for durability analyses in ocean engineering [38]. In the durability design and analysis of several large-scale marine structures built in China over recent years, the Ccr values have been systematically discussed and analyzed. Jin et al. [39] analyzed and predicted the service life of the Jiaozhou Bay subsea tunnel, and the Ccr value was set to 0.85% (accounting for the mass fraction of the cementitious material). In the design process of the Hong Kong–Zhuhai– Macao Bridge, the Ccr values were as follows: 0.85% in the atmospheric zone, 0.75% in the splash and tidal zones, and 2.00% in the underwater zone (accounting for the mass fraction of the cementitious materials) [11,40].
To study the Ccr characteristics of concrete structures in the Dalian sea area, the corrosion status of a steel bar in a concrete wharf, with a service life of 40 years near Songmu island in Dalian, was investigated. The concrete cover thickness was 60 mm, and the wharf was located in the tidal zone. Five concrete core samples were drilled, and the average value of Cfree on the surface of the steel at the concrete cover was found to be 0.13% (accounting for the concrete mass fraction) by using chemical analyses in accordance with the relevant standard [32]. The steel was removed from the core sample, and there is no corrosion at the surface of the steel bar, as shown in Fig. 7. Thus, the Ccr value is greater than 0.13%. Combined with the above mentioned research results and safety considerations, a relatively conservative value of 0.13% (accounting for the concrete mass fraction) was used as the Ccr value in the splash and tidal zones. Owing to the low oxygen content in the saturated water environment, the cathode reaction could not proceed smoothly during steel corrosion. Therefore, the steel bars in the underwater zone are less prone to rust, as compared to those in the splash and tidal zones [41,42]. Compared with those in the splash and tidal zones, the Ccr value in the underwater zone could be slightly larger. Therefore, 0.15% of the mass fraction of concrete was used. By converting the Ccr values into mass fractions of the cementitious materials for the A-3, B-3, and C-3 mix proportions, the Ccr values in the splash zone (tidal zone) were approximately 0.70%, 0.66%, and 0.62%, respectively, while the Ccr values in the underwater zone were approximately 0.81%, 0.76%, and 0.72%, respectively. These values are all slightly lower than those in the literature mentioned above and would yield relatively conservative estimates for the service life design of concrete structures in marine environments.
《Fig. 7》

Fig. 7. Corrosion status of steel in a concrete wharf with a service age of 40 a in Dalian.
3.1.4. Degradation coefficient (K)
The deterioration coefficient reflects the effect of concrete deterioration on the chloride diffusion under the influence of the external environment. To analyze the service life of concrete structures, Fig. 5. Temporal changes in Dt [34] (n is sample number). the differences in the chloride diffusion coefficients between the indoor and outdoor concretes were analyzed. In addition, data related to the marine concrete structures in the Dalian area were investigated. By combining these results, the values of K could be determined. For the exposure experiments, the chloride concentration tests under different exposure environments were divided based on two exposure ages. Owing to the large number of test specimens, for the same mix proportion, the specific exposure times under different exposure environments were slightly different, as shown in Table 6.
《Table 6》
Table 6 Specific exposure times for different concrete samples (d).
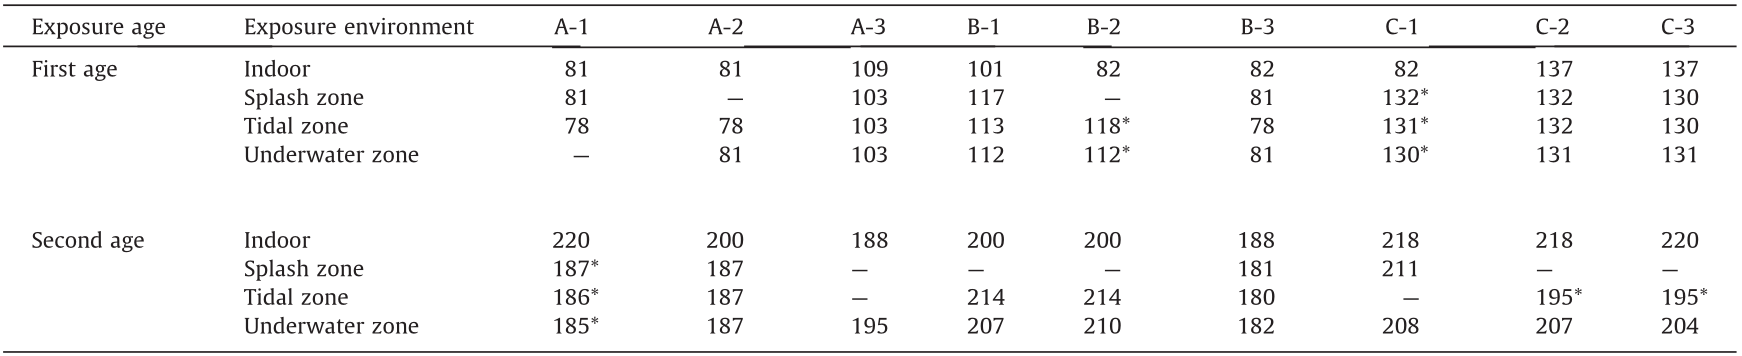
‘‘—” indicates that the case was untested. ‘‘*” indicates that the exposure times under the indoor and field exposure environments were significantly different.
Fig. 8 shows the chloride diffusion rules for all the mix proportions under the indoor and field exposure environments. According to the chloride diffusion theoretical model (Eq. (15)), the Df values for the different mix proportions in the actual service environment were calculated. Compared with the corresponding Dtlab values under the laboratory standard conditions, the values of K in the Dalian marine environment were subsequently determined. Although there were some differences in the specific exposure times, considering that the differences in the diffusion coefficients were small when the exposure times approached one another, the small differences in the specific exposure times could be neglected. Therefore, the K values under different exposure environments were calculated directly using Eq. (8). For a small number of test specimens, the exposure times under the indoor and field exposure environments were significantly different (marked with * in Table 6), and these specimens were not considered in the calculation of K. The calculation results are listed in Table 7. Through a statistical analysis of the data in Table 7, the average K values for the concrete in the Dalian sea area were determined to be 1.61 for the splash zone, 1.58 for the tide zone, and 1.59 for the underwater zone, and the corresponding standard deviations were 0.85, 0.94, and 0.87, respectively. Feng [43] calculated the K values of a wharf constructed using high-performance concrete, which had been in service for 11 a in the Dalian area, and determined values of 1.52 for the splash area and 1.32 for the tidal area and that the variation coefficient did not exceed 20%. The test K values were similar to the long-term data obtained from the site. Therefore, the K values used for the service life design of concrete structures in the Dalian area were as follows: 1.61 for the splash zone, 1.58 for the tidal zone, and 1.59 for the underwater zone.
《Fig. 8》
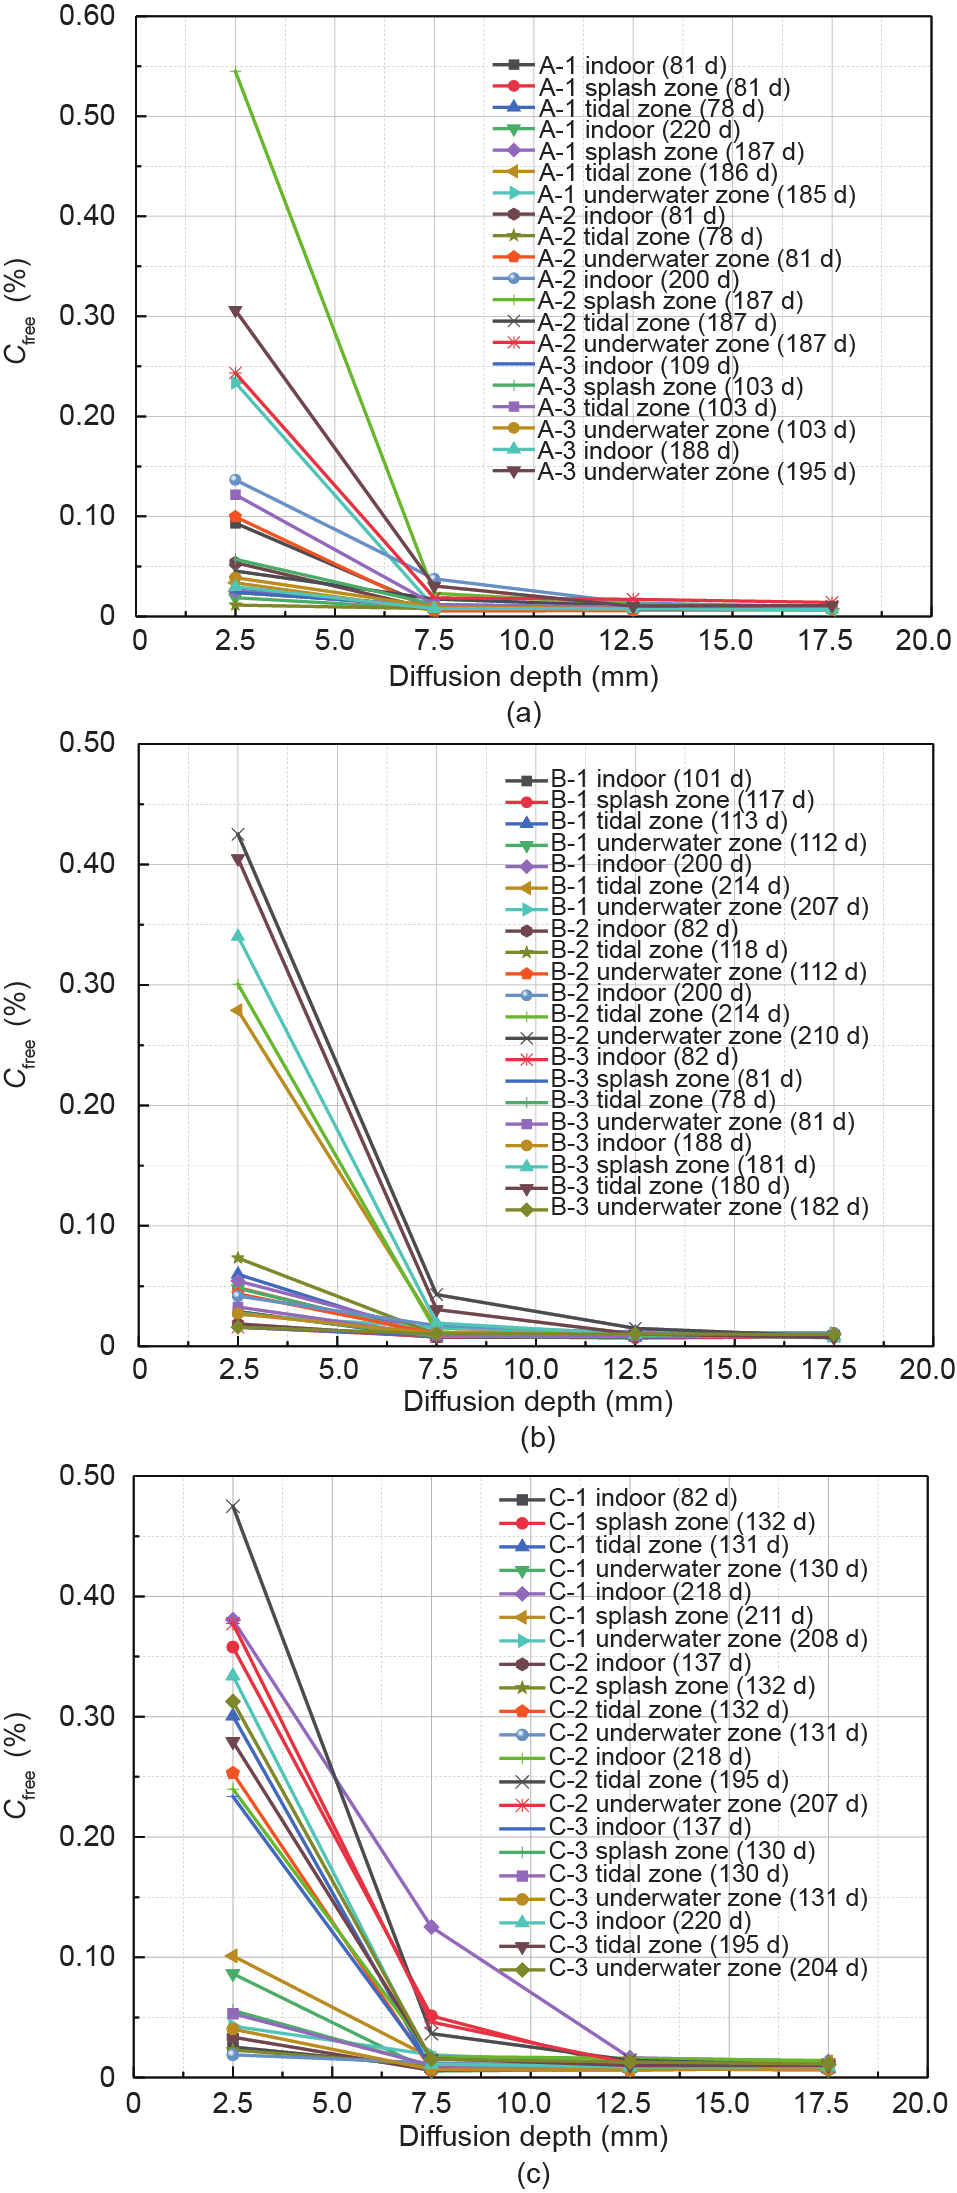
Fig. 8. Chloride diffusion in concrete under different exposure environments. (a) A series; (b) B series; (c) C series.
《Table 7》
Table 7 Deterioration coefficient (K) of concrete in the Dalian marine environment.

3.1.5. Time-dependent constant of surface free chloride concentration (k)
To determine the values of k, long-term data regarding the concrete surface chloride concentration (Cs) of wharfs with service times of 11, 28, 40, 50, and 82 years in the Dalian area and data from ocean engineering or exposure stations in Northeast Asia were collected. In some reports, the total surface chloride concentration (Cs(total)) is presented instead of the free surface chloride content (Cs(free)). To unify the results, the Cs(total) values were converted to Cs(free) using Eq. (17), which was proposed by Xu et al. [26]:

The statistical results for the Cs(free) values of marine concrete after conversion are presented in Table 8 [44–53]. After combining the time-varying model of Cs (Eq. (11)) and a previously proposed universal time-dependent index of the diffusion coefficient (m = 0.6304) [34], a regression analysis was performed considering different exposure environments, in which C0 was generally 0.01% [54]. The fitting relationship is shown in Fig. 9, and the specific values of the fitting parameters are listed in Table 9. The results show that Cs increased with increasing exposure time. Furthermore, upon fitting according to the (1 –m)/2 power-law boundary condition, the fitted value of k was 0.2567 for the splash zone and 0.2885 for the tidal zone. However, for the underwater zone, the amount of data in Table 8 was relatively small and was not representative; thus, it could not be used directly in the durability analysis. Because the environment of the tidal zone is closer to that of the underwater zone than to that of the splash zone, the boundary condition of the tidal zone was used to determine the service life of the marine concrete structures in the underwater zone.
《Table 8》
Table 8 Literature values of Cs(free) for marine concrete.


《Fig. 9》

Fig. 9. Temporal variations in Cs(free) in different exposure zones. (a) Splash zone; (b) tidal zone; (c) underwater zone.
《Table 9》
Table 9 Regression analysis results for time-varying forms of Cs(free) in different exposure zones.

Significance level of critical correlation coefficient R* with α = 0.02.
《3.2. Distribution types of durability parameters》
3.2. Distribution types of durability parameters
3.2.1. Statistics of distribution types of model parameters
In the reliability analysis of the service lives of marine concrete structures, the accuracy of the calculation results is related to the distribution types of each parameter in the design model, such as the cover thickness x0, Cs, and D0. Therefore, the statistical distribution types of model parameters must be systematically analyzed. Table 10 [10,40,55–68] summarizes the distribution types of the model parameters for a large number of marine concrete structures. Most previous studies have shown that the durability parameters mainly follow normal distributions.
《Table 10》
Table 10 Statistics of probability distribution types of model parameters in the literature.

3.2.2. Quality control level of construction firm
(1) Cover thickness (x0)
The control of the cover thickness and durability parameters of concrete is mainly related to the management level of the construction firm. Fig. 10 shows the statistical distributions of the cover thickness of the marine concrete structures constructed in recent years by CCCC First Harbor Engineering Bureau Third Engineering Co., Ltd., which has undertaken many seaport projects in the Dalian area. Fig. 10(a) shows the cover thickness of a concrete structure with a design cover thickness of 80 mm at the 317# berth at Dandong Port. Fig. 10(b) shows the cover thicknesses of ① the CX7-2# caisson and breast wall of the outfitting wharf at Dalian Zhongyuan Kawasaki Shipping Engineering Co., Ltd.; ② the caisson at the 22# berth of the Phase IV Project on the North Bank of Dayao Bay, Dalian Port; ③ the berth breast wall of Dandong Port; and ④ the breast wall of the 72# berth at Yingkou Port, which have the design cover thickness of 50 mm. The statistical results showed that when the design cover thickness was 80 mm, the average value of the actual cover thickness was 80.8 mm, the standard deviation was 2.0 mm, and the variation coefficient was 2.5%. When the design cover thickness was 50 mm, the average value of the actual cover thickness was 54.1 mm, the standard deviation was 3.8 mm, and the variation coefficient was 7.0%. Regardless of its design value, the concrete cover thickness essentially follows a normal distribution.
《Fig. 10》

Fig. 10. Quality control level for different design cover thicknesses: (a) 80 mm and (b) 50 mm. μ: average value; σ: standard deviation.
(2) Chloride diffusion coefficient (Dt)
Fig. 11 shows the quality control level for the Dt values of a batch of concrete specimens prepared by CCCC First Harbor Engineering Bureau Third Engineering Co., Ltd. The Dt values can be considered to follow both normal and lognormal distributions. For convenience of analysis, a normal distribution was used to analyze the service life in this study.
《Fig. 11》

Fig. 11. Quality control level for Dt.
(3) Surface free chloride concentration (Cs(free))
Fig. 12 shows the quality control level for the Cs(free) values of a batch of concrete specimens prepared by CCCC First Harbor Engineering Bureau Third Engineering Co., Ltd. The results show that the Cs(free) values follow both normal and lognormal distributions. To ensure convenient reliability calculation, a normal distribution was used to analyze the service life in this study.
《Fig. 12》
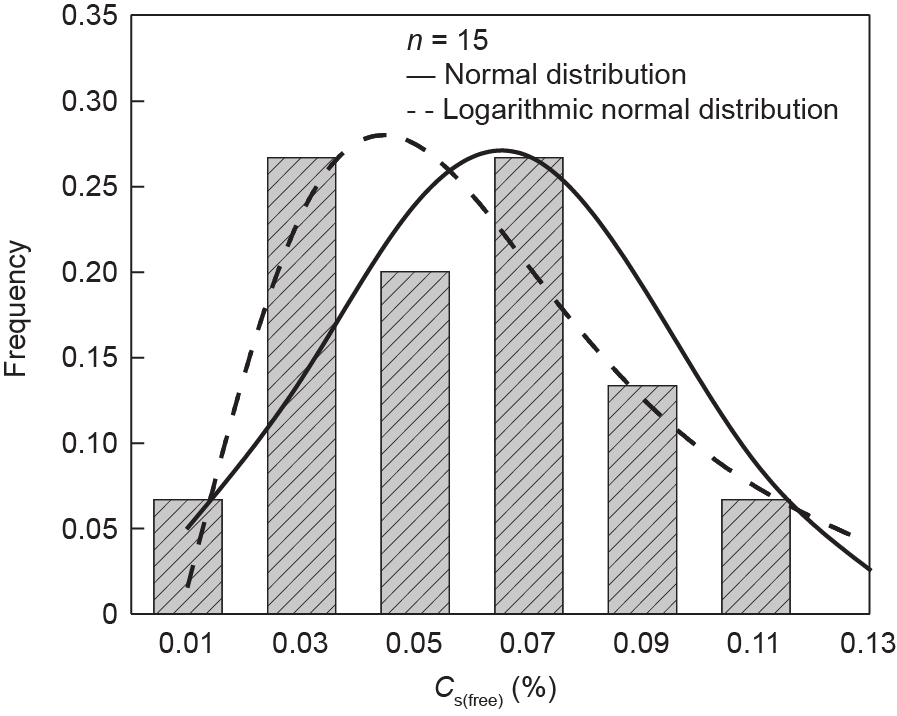
Fig. 12. Quality control level for Cs(free).
3.2.3. Determination of distribution types of model parameters
Based on results reported in the literature (Table 10) and the quality control level of the construction firm, the durability parameters of the service life design model were observed to exhibit mainly normal distributions. Studies on the initial chloride concentration C0 are still relatively limited, and it was assumed to follow a normal distribution in this study. Therefore, in the theoretical model of the service life design, except for the exposure time (which was a constant), the other parameters were all random variables with normal distributions. The variation coefficients of k, C0, Ccr, Rb, x0, m, and D0 were all set as 20%. For the variation coefficient of K, test values were used based on the differences between the marine exposure environments. The design value of x0 was 70 mm. The values and distribution types of the durability parameters of the service life analysis model are listed in Table 11.
《Table 11》
Table 11 Model parameters of service life analysis.

N: normal distribution; the two data in the parentheses are the average value and standard deviation, respectively.
《Fig. 13》

Fig. 13. Corrosion probability of steel and reliability index in different service environments: (a, b) splash zone; (c, d) tidal zone; and (e, f) underwater zone.
《Table 12》
Table 12 Corrosion time of steel in concrete structures under different service environments.

《Fig. 14》
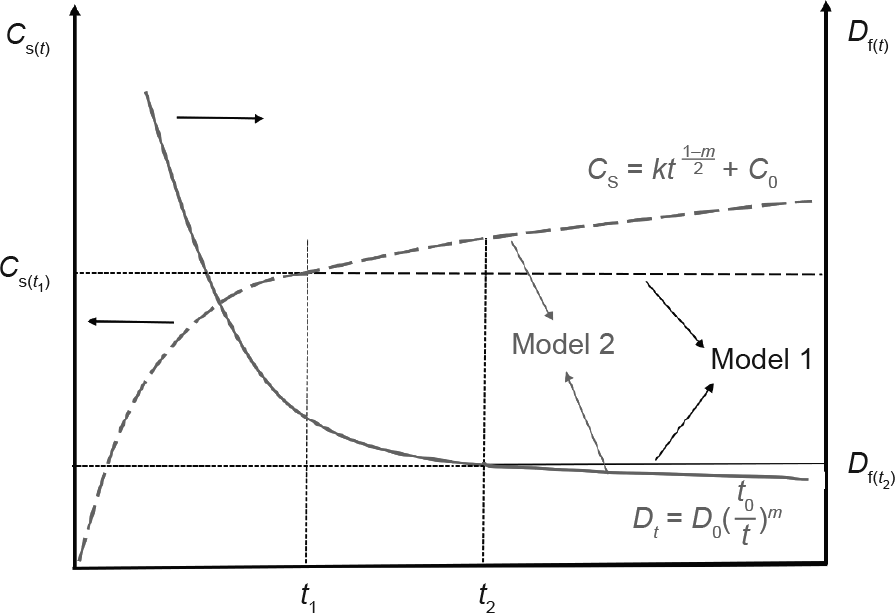
Fig. 14. Different time-varying relationships of boundary conditions and diffusion coefficient.
The ‘‘Standard for Design of Concrete Structure Durability” (GB/ T 50476–2019) [2] stipulates that the design service life of a structure corresponding to the durability limit state should have a specified assurance rate and meet the reliability requirements of the normal service limit state. According to the standard, the structural reliability range is 90%–95%, and the corresponding failure probability is 5%–10%. Therefore, in this study, the service time was defined as the time when the corrosion probability (i.e., failure probability) of the steel bars in concrete reached 5% and 10%, respectively.
《3.3. Reliability analysis of service life of marine concrete structures》
3.3. Reliability analysis of service life of marine concrete structures
3.3.1. Service life analysis of concrete structures in different exposure environments
Fig. 13 and Table 12 show the corrosion probability of the steel inside concrete structures and the corresponding reliability index in different exposure zones. With the extension of the service time, the failure probability increased, and the reliability index decreased gradually. For the concrete structures in the splash zone, the service lives of the A-3, B-3, and C-3 mix proportions were 102, 105, and 122 year, respectively, when the corrosion probability was 5%, and they were 110, 112, and 130 year, respectively, when the corrosion probability was 10%. All mix proportions met the 100-year-life design requirement, and the C-3 concrete met the 120-year-life design requirement. For the concrete structures in the tidal zone environment, the service lives of the A-3, B-3, and C-3 mix proportions were 101, 102, and 121 a, respectively, when the corrosion probability was 5%, and they were 107, 110, and 127 year, respectively, when the corrosion probability was 10%. Although the service lives were lower than those in the splash zone, all the mix proportions still met the 100-year-life design requirement, and the service life of C-3 reached 120 year. For the concrete structures in the underwater zone, the service lives of the A-3, B-3, and C-3 mix proportions were 105, 106, and 126 a, respectively, when the corrosion probability was 5%, and they were 112, 115, and 132 year, respectively, when the corrosion probability was 10%. Based on the aforementioned results, A-3 concrete could be used for marine concrete structures with a 100-year design life, and C-3 concrete could be used for structures with a 120-year design life. Furthermore, the service life was shortest in the tidal zone and longest in the underwater zone. Therefore, analyzing the durability of marine concrete structures based on the service environment in the tidal zone yields reliable and conservative results. Thus, to facilitate manufacturing and quality control, the tidal zone was selected as the environmental basis for the design of marine concrete structures.
3.3.2. Difference in service life of marine concrete structures— continuous increase in Cs and continuous decrease in Df
In the service life analysis of the marine concrete structures, the time-varying relationships between Df and Cs were considered; specifically, Cs continuously increased and then remained stable after t1, whileDf continuously decreased and remained stable after t2 (Model 1). With Cs continuously increasing and Df continuously decreasing (Model 2), as shown in Fig. 14, the calculation result for the service life might change to some extent. To clarify the influence of the model differences on the service life, the service life calculations based on different boundary conditions and chloride diffusion behaviors are discussed below.
The service lives of the marine concrete structures with different mix proportions were recalculated with the tidal zone as the service environment. Fig. 15 shows the corrosion probability and the corresponding reliability index. The service lives of the A-3, B-3, and C-3 mix proportions were 185, 195, and 262 year, respectively, when the corrosion probability was 5%, and 210, 220, and 295 year, respectively, when the corrosion probability was 10%. The specific service lives are listed in Table 13. During the service life of the structure, even if Cs continuously increases and Df continuously decreases, the predicted service lives are 83.2%–116.5% (average 97.0%) and 96.0%–132.3% (average 109.6%) longer than that of model 1 (with Cs continuously increasing and then remaining stable, and Df continuously decreasing and then remaining stable) for corrosion probabilities of 5% and 10%, respectively. Evidently, these two effects would not cause the actual engineering life to be lower than the expected service life. Considering that Cs continually increases and then remains stable after t1 and that Df continually decreases and then remains stable after t2, the results are conservative and reliable, which is beneficial for the durability design of marine concrete structures.
《Fig. 15》

Fig. 15. Comparison of (a) corrosion probabilities and (b) reliability indices under two calculation conditions. Model 1: Df decreases first and then remains stable, and Cs increases first and then remains stable; Model 2: Cs continuously increases and Df continuously decreases.
《Table 13》
Table 13 Rust times (year) of steel bars under two types of calculation conditions.

3.3.3. Cover thickness of concrete structures calculated in tidal zone
The thickness of the concrete cover significantly influences the service life of marine concrete structures. According to the calculation results presented earlier, when the concrete cover thickness was 70 mm, the A-3, B-3, and C-3 mix proportions could ensure that the steel would not rust within 100 or 120 year, even in the tidal zone (in which the conditions were relatively severe). To ensure compliance with the design requirement in terms of service life, the service lives of the marine concrete structures were examined with the cover thickness varying from 60 to 80 mm in increments of 5 mm, for the A-3, B-3, and C-3 mix proportions in the tidal zone environment.
Fig. 16 and Table 14 show the corrosion probabilities of the steels and the corresponding reliability indices for different cover thicknesses. The results show that the corrosion time increased with an increase in the concrete cover thickness. For a 5% corrosion probability, the corrosion times of the A-3, B-3, and C-3 concrete structures were 81, 82, and 91 year, respectively, when the cover thickness was 65 mm; these values do not meet the design requirements of 100 or 120 year. However, when the cover thickness was 70 and 75 mm, the corrosion times were 101, 102, and 121 year, respectively, and 120, 121, and 141 year, respectively. With an increase in the cover thickness, the rusting time of the steels increased further. According to the requirements mentioned in the JTG/T B07-01–2006 standard [69], the design value of the cover thickness should not be less than the sum of the minimum cover thickness and the permitted construction error  . The was determined based on the strictness of the construction requirements, and a range of 0–5 mm was used for the prefabricated components. Assuming that the concrete structures were produced using the precast construction method, the value of the cover thickness was 5 mm, and the minimum thickness was 70 mm according to the calculation results presented earlier. Therefore, the suggested cover thickness was x0 ≥ 75 mm. This meets the requirement of the JTS151–2011 standard, which states that ‘‘the minimum concrete cover thickness of the load-bearing bars of reinforced concrete structures is 60 mm” [70].
《Fig. 16》
Fig. 16. Comparison of corrosion probabilities and reliability indices of concrete structures with different cover thicknesses: (a, b) A-3; (c, d) B-3; and (e, f) C-3.
《Table 14》
Table 14 Corrosion time (year) of steels in concrete structures with different cover thicknesses (x0).

3.3.4. Sensitivity analysis based on Cs in tidal zone to calculate service life of concrete structures in underwater zone
Because the available statistical data for Cs in the underwater zones of Dalian and Northeast Asia are limited, the Cs data in the tidal zone, which is similar to the underwater zone, was selected in this study to calculate the service life of concrete structures in the underwater zone. To analyze the influence of selecting these values on the service life, the sensitivity of Cs in the tidal zone to the service life of the structures in the underwater zone was determined using the temporal variations in Cs in underwater zones on a global scale. The data points in Fig. 17 denote the statistical results of the Cs values in marine underwater zones on a global scale [25]; the exposure age ranged from 1 to 72 year. A regression analysis of Cs for a large number of marine concrete structures revealed that the majority of the Cs values in the underwater zone were between the upper and lower boundaries, as shown in Fig. 17. Using Eq. (11), the boundary condition functions of the upper boundary, lower boundary, and median line were obtained, and the corresponding k values were 0.6562, 0.3076, and 0.4930, respectively. Although the fitting degree was not sufficiently high, the purpose was to analyze the influence of the difference in k caused by the exposure environment on the service life. The detailed calculation results for the service life under different boundary conditions are shown in Fig. 18 and Table 15 for a cover thickness of 75 mm.
《Fig. 17》

Fig. 17. Temporal variation in Cs in underwater zone in a global scale.
《Fig. 18》
Fig. 18. Corrosion probability and reliability index of concrete structures under different boundary conditions: (a, b) A-3; (c, d) B-3; and (e, f) C-3.
《Table 15》
Table 15 Possible deviation in service life of concrete structures in the underwater zone.

The calculation results show that when the Cs of the marine concrete structures was located on the middle line in Fig. 16, the service life was approximately 87.6%–89.7% of the life calculated based on the tidal zone. When the Cs was at the lower boundary, the service life was very close to the calculated result for the tidal zone. When the Cs of the actual engineering structure was at the upper boundary, which is the most unfavorable condition, the service life was approximately 80.2%–84.1% of the life calculated based on the tidal zone. For the A-3 and C-3 concrete, even when the Cs was located on the upper boundary, the rust times of the steel bars reached 101–107 and 121–127 years, respectively, for a failure probability of 5%–10%; thus, the service life design requirements of 100 and 120 a were fulfilled. Although the data for the tidal zone were selected as the calculation basis, the service life could still meet the design requirements if the structures were located in the underwater zone.
《4. Conclusions》
4. Conclusions
The service lives of concrete structures in northern China were analyzed based on large datasets of ocean parameters and on reliability theory. A design method was proposed to ensure a service life of 100 or 120 years. The main conclusions are as follows:
(1) Through experimental research and investigation of large datasets of durability parameters used in ocean engineering, the values, ranges, and distribution types of the durability parameters applied in the durability design of marine concrete structures in northern China were confirmed.
(2) Based on the modified theoretical model of chloride diffusion in concrete and reliability theory, the service lives of concrete structures exposed to splash, tidal, and underwater zones were calculated. Accordingly, mix proportions that would achieve a service life of 100 or 120 years were designed.
(3) The influence of the cover thickness on the service life was analyzed, and x0 ≥ 75 mm was suggested to be an appropriate cover thickness for marine concrete structures in northern China.
(4) The service life of marine concrete structures was analyzed and compared under two time-varying relationships of Df and Cs (Df continuously decreasing and Cs continuously increasing; Df first decreasing and then remaining stable, and Cs first increasing and then remaining stable). When Cs continuously increased and then remained stable and Df continuously decreased and then remained stable, the results were conservative and reliable, which is beneficial for the durability design of concrete structures.
《Acknowledgments》
Acknowledgments
The authors gratefully acknowledge the financial support provided by the Natural Science Foundation of China (51508272, 11832013, 51878350, and 51678304).
《Compliance with ethics guidelines》
Compliance with ethics guidelines
Taotao Feng, Hongfa Yu, Yongshan Tan, Haiyan Ma, Mei Xu, and Chengjun Yue declare that they have no conflict of interest or financial conflicts to disclose.


 京公网安备 11010502051620号


