

《1. Introduction》
1. Introduction
Hundreds of billion tons of lignocellulosic biomass are produced annually worldwide, but less than 10% of lignocellulosic biomass is utilized. The large production area and burning have caused serious environmental problems, and the transformation of waste biomass has attracted worldwide attention [1,2]. In addition to the saccharification of biomass to produce ethanol, many types of biomass are converted to carbon materials for environmental remediation [3]. Biochar (BC), which is carbonized from biomass under limited O2 with high surface area, porosity, and rich functional groups, is widely applied in wastewater treatment as an environmentally friendly functional material [4]. To improve the degradation efficiency of BC on a greater number of pollutants, BC-loaded/supported nano zero-valent iron (nZVI) material has emerged. These composite materials of nZVI–BC have shown excellent removal efficiency in dye, heavy metal, and organic pollutant degradation [5–7].
nZVI–BC has been extensively studied for its potential application in environmental remediation. However, it is worth noting that many studies involve other iron phase components, such as Fe2O3 or Fe3O4, on nZVI–BC in addition to zero-valent iron (ZVI) [8,9]. These species mostly resulted from the incomplete reduction or oxidation of nZVI. Currently, there is a general preparation method for nZVI–BC, and it is broadly divided into two types: liquid reduction and carbothermal reduction. These methods are differentiated by the modified objects (biomass or BC), which are modified using iron salts. Liquid reduction adopted BC modification using reductants of borohydride (i.e., NaBH4 or KBH4) to reduce Fe3+ or Fe2+ to Fe0 [10] onto the BC under N2. The disadvantages of the process are that it is tedious and that Fe0 is easily oxidized [11] and needs to be stored under vacuum [12]. In contrast, carbothermal reduction first adopted biomass modification via impregnation, and then the modified biomass was pyrolyzed to nZVI–BC [13]. Although this method makes up for the deficiency of the utilization of borohydride and N2, it has some drawbacks, including the substantial use of Fe compounds and a long reaction time, which are related to the biomass structure.
Biomass is made of three major components: cellulose, hemicellulose, and lignin. They intertwine through strong covalent bonds and hydrogen bonds and result in the heterogeneity of the biomass [14,15]. In addition, lignin coats the outer layer of biomass, making the original biomass surface rigid and smooth and inaccessible to other substances [16]. Therefore, it is necessary to improve the surface accessibility by pretreatment to obtain the mixed carbon source of iron oxide and biomass before carbothermal reduction. Notably, studies have shown that graphitized carbon can shield iron nanoparticles against oxidation by acting as a ‘‘shell,” and the metal Fe ‘‘core” provides strong support to prevent the collapse of the outer carbon shell [14]. Furthermore, the carbon skeleton was mainly derived from lignin, which comprises many aromatic rings and a wide pyrolysis range of 165–900 °C [17,18]. Thus, it is speculated that an improved nZVI–BC can be prepared through carbothermal reduction according to the following two ideas. The first is that during biomass modification, the biomass needs to be pretreated by inorganic iron compounds to retain more lignin. The second is that during pyrolysis, the Fe should be sufficiently reduced to ZVI when the biomass is pyrolyzed to graphitized carbon. However, limited studies have been performed on the detailed nZVI–BC formation mechanisms by carbothermal reduction involving prior iron activation and the formation of nZVI–BC using biomass as the carbon source.
Based on the numerous biomass pretreatment strategies (i.e., acid, alkali, and organic solvent methods) [19], lignin removal mechanism [20], and the traditional impregnation modification method (iron deposition) [21], we speculated that it is feasible to introduce a certain solvent to the heterogeneous modification system with biomass and iron salts to simultaneously weaken the pretreatment conditions (time, temperature, etc.) and improve the hydrolysis of the Fe ions; this system would satisfy the two goals of retaining lignin and enhancing the Fe deposition.
In this study, we first proposed an improved modification method to pretreat biomass (rice straw (RS)). We selected an environmentally friendly solvent, polyethylene glycol 400 (PEG400), as the additional catalyst for the RS modification system, which included FeCl3 solution. PEG400 is a nontoxic linear polymer that is essentially nonvolatile [22]; PEG400 is regarded as a phase transfer catalyst and has the ability to separate and chelate metal ions in aqueous biphasic systems [23]. Then, nZVI–BC, which has a core–shell structure, was prepared by carbothermal reduction. The physicochemical properties of the nZVI–BC were explored by various characterization methods. The mechanisms of RS modification and nZVI–BC formation were elucidated through studies on the structural changes of RS, iron phase transfer and in situ reduction.Moreover, nZVI–BC was tested in a dye removal experiment, showing excellent absorption and catalysis. This study provides new insight into the formation of nZVI– BC, might drive the actual production and application of this material, and is significant for the conversion of biomass to carbon materials and environmental remediation.
《2. Material and methods》
2. Material and methods
《2.1. Biomass and chemicals》
2.1. Biomass and chemicals
RS was purchased from Wuchang, Heilongjiang Province, China. The RS was cut and crushed by a pulverizer and then passed through 40–100 mesh as feedstock biomass. Before use, the RS feedstock was washed to remove ash and then dried for the next experiment. Chemicals including PEG400 (analytical reagent (AR), ≥99.9%) and FeCl3·6H2O (AR, ≥99%) were obtained from Sinopharm Chemical Reagent Co., Ltd. (China). Ultrapure water was used in all the experiments.
《2.2. Modification of RS》
2.2. Modification of RS
Dried RS was weighed into a round-bottom flask at a ratio of 5 wt% (m/v), and then PEG400 (with water of 1:1 (v/v)) and FeCl3·6H2O (2.5%, m/v) solution were added to mix. The apparatus was placed in an oil bath with constant magnetic stirring in accordance with the designated temperature and time. After the reaction, solid–liquid separation was performed through vacuum filtration. Then, the solid RS residues were rinsed repeatedly to remove the PEG400 and extra FeCl3 using plenty of water until the pH was neutral. The washed RS was dried in an oven at 60 °C for 24 h. The executed experiments were as follows: ① RS without pretreatment; ② RS pretreated by FeCl3·6H2O solution alone (80 °C, 1 h), and ③ RS pretreated by PEG400 with FeCl3·6H2O cosolvent (60/80/100 °C, 0.5 h). The collected samples from the above three pretreatments were named RS, F–RS, and PFx–RS, where x indicates pretreatment temperatures of 60, 80, and 100 °C.
《2.3. Pyrolysis synthesis of nZVI–BC》
2.3. Pyrolysis synthesis of nZVI–BC
The pretreated RS (RS, F–RS, and PFx–RS) was dried before pyrolysis. Then, they were added to a corundum ark and placed in a tube furnace with a flowing N2 atmosphere at a temperature of 700 °C for 2 h and a heating rate of 5 °C·min–1 . When the pyrolysis process was completed and the BC was cooled to room temperature, the corresponding BC materials were obtained. They were ground, passed through a 0.154 mm mesh and stored in an airtight container for further use. The obtained BCs were named BC, FBC, and PFxBC, corresponding to the precursor samples of RS, F–RS, and PFx–RS, respectively, and the x in PFxBC still indicates the pretreatment temperatures of 60, 80 and 100 °C.
《2.4. Biomass characterizations》
2.4. Biomass characterizations
To elucidate the formation mechanism of nZVI–BC, changes in RS before and after pretreatment were observed. Energy dispersive spectroscopy (EDS, Oxford, X-Max, UK) mapping was used to observe the element distribution and content changes, particularly the changes in the iron content. X-ray photoelectron spectroscopy (XPS, Kratos Axis Ultra DLD, UK) was also employed to investigate the chemical elements and ensure the iron phase compositions through overlapping peak resolution.
《2.5. BC characterizations》
2.5. BC characterizations
The surface and inner morphology properties of BC were characterized by scanning electron microscopy (SEM, Zeiss Sigma 500, Germany) equipped with EDS and transmission electron microscopy (TEM, JEM1400, Japan). The phase composition was ensured by X-ray diffraction testing (XRD, Bruker D8 Advance, Germany). A vibrating sample magnetometer (VSM, Lake Shore 7404, USA) was used to monitor the magnetic intensity of nZVI– BC. The charge distribution on the surface of the nZVI–BC was measured by a zeta potential meter (Malvern Zetasizer Nano S90, UK). The surface element content and chemical valence changes were monitored using XPS. Fourier transform infrared spectroscopy (FTIR, PerkinElmer Spectrum One, USA) was used to analyze the functional groups of the BC. The specific surface area, pore volume, and pore size distribution were monitored by a N2 absorption desorption isotherm (BET, Quantachrome NOVA Station B, Germany). The carbon structure and degree of graphitization were characterized by laser confocal Raman microspectroscopy (inVia-Reflex, UK) with an excitation wavelength of 532 nm at room temperature.
《2.6. Congo red (CR) removal》
2.6. Congo red (CR) removal
The resultant nZVI–BC was used as a catalyst to advance the oxidation of persulfate for the removal of CR. The reaction conditions were as follows: CR concentration of 30 mg·L–1 , pH of 6.8 ± 0.2, reaction time of 0–150 min, dose of nZVI–BC of 0.5 g·L–1 , potassium peroxodisulfate (K2S2O2; PS) concentration of 1.8 mmol·L–1 , reaction volume of 50 mL, and temperature of 30 °C. nZVI–BC and PS were added to the reactor at set proportions, and the bottle was placed into a water bath shaker. At the given irradiation time intervals, 500 μL of the solution was withdrawn, diluted, and centrifuged for 3 min at 8000 r·min–1 . Then, its absorption intensity was analyzed using a ultraviolet–visible (UV–vis) spectrophotometer (A360, Aoyi Instruments Shanghai Co., Ltd., China) at 498 nm. The removal efficiency of CR was calculated by the following expression:

where C0 and Ct are the initial and t min concentrations of CR (mg·L–1 ) in the solution, respectively. After the reaction, the removal efficiency was studied by full wavelength scanning via UV–vis. For comparison, an experiment was conducted in which only PS was oxidized. Moreover, to distinguish the adsorption of nZVI–BC, experiments with nZVI–BC alone were carried out. The physicochemical property changes of nZVI–BC before and after use was analyzed by XRD, FTIR, and SEM equipped with EDS.
《3. Results and discussion》
3. Results and discussion
《3.1. Characteristics of the nZVI–BC》
3.1. Characteristics of the nZVI–BC
According to our designed experimental process, as shown in Appendix A Fig. S1, we first modified RS with a heating pretreatment in FeCl3 solution (80 °C, 1 h) and a mixture of PEG400 and FeCl3 (60/80/100 °C, 0.5 h) and then pyrolyzed the modified samples to obtain the corresponding materials, which were named FBC, PF60BC, PF80BC, and PF100BC.
3.1.1. Physical characteristics
(1) XRD analysis. The XRD spectra (Fig. 1(a)) of PF60BC, PF80BC, and PF100BC displayed characteristic peaks at ~44.7° corresponding to the typical (110) plane of Fe0 ; these peaks are consistent with those in previous reports [24,25]. With increasing heating temperature, the peak became stronger and sharper, suggesting that the content of Fe0 increased in the BC. Moreover, the diffraction peaks at 65.0° and 82.3°, which were indexed to the (200) and (211) planes of Fe0 , were present in the PF100BC pattern [26]. However, the FBC pattern did not exhibit the diffraction peak of Fe0 as that of PFxBC, which also indicated that the single modification by FeCl3 without PEG400 was inferior to the combined modification. It was confirmed that nZVI–BC was successfully fabricated in our synthesis process. Moreover, it is worth noting that there was another advantage of PFxBC in that its phase composition was pure. It was better than those of some similar materials reported in Refs. [8,9,12].
(2) VSM analysis. The VSM results (Fig. 1(b)) showed that PFxBC was magnetic; however, the FBC was barely magnetic. This trend is consistent with the XRD results. Combined with the phase analysis by XRD, it can be considered that the magnetism of the PFxBC resulted from Fe0 . The magnetic intensity of PFxBC gradually increased from PF60BC (3.00 emu·g–1 ) to PF100BC (4.94 emu·g–1 ), which was 4.57-fold that of FBC (1.08 emu·g–1 ). Although the magnetic intensity was not as high as was shown in some other reports of iron oxide-dependent magnetic BC [27], it was still comparable to that of most reported magnetic BCs [28,29], and our nZVI–BC can be easily separated from a liquid phase system through magnetic force (it has been tested).
(3) Raman analysis. The Raman spectra (Fig. 1(c)) measured the carbon structure and degree of graphitization of the prepared BC. The peaks of the D mode (1360 cm–1 ) and G mode (1590 cm–1 ) were attributed to amorphous carbon and graphitic carbon, respectively [30]. The intensity ratio (ID/IG) increased from 0.696 for FBC to 0.746 for PF60BC, 0.783 for PF80BC, and 0.799 for PF100BC, indicating that the production of Fe0 led to decreased graphitization of the prepared BC. With increasing Fe0 intensity, ID/IG increased and introduced more disordered structures into nZVI–BC.
《Fig. 1》
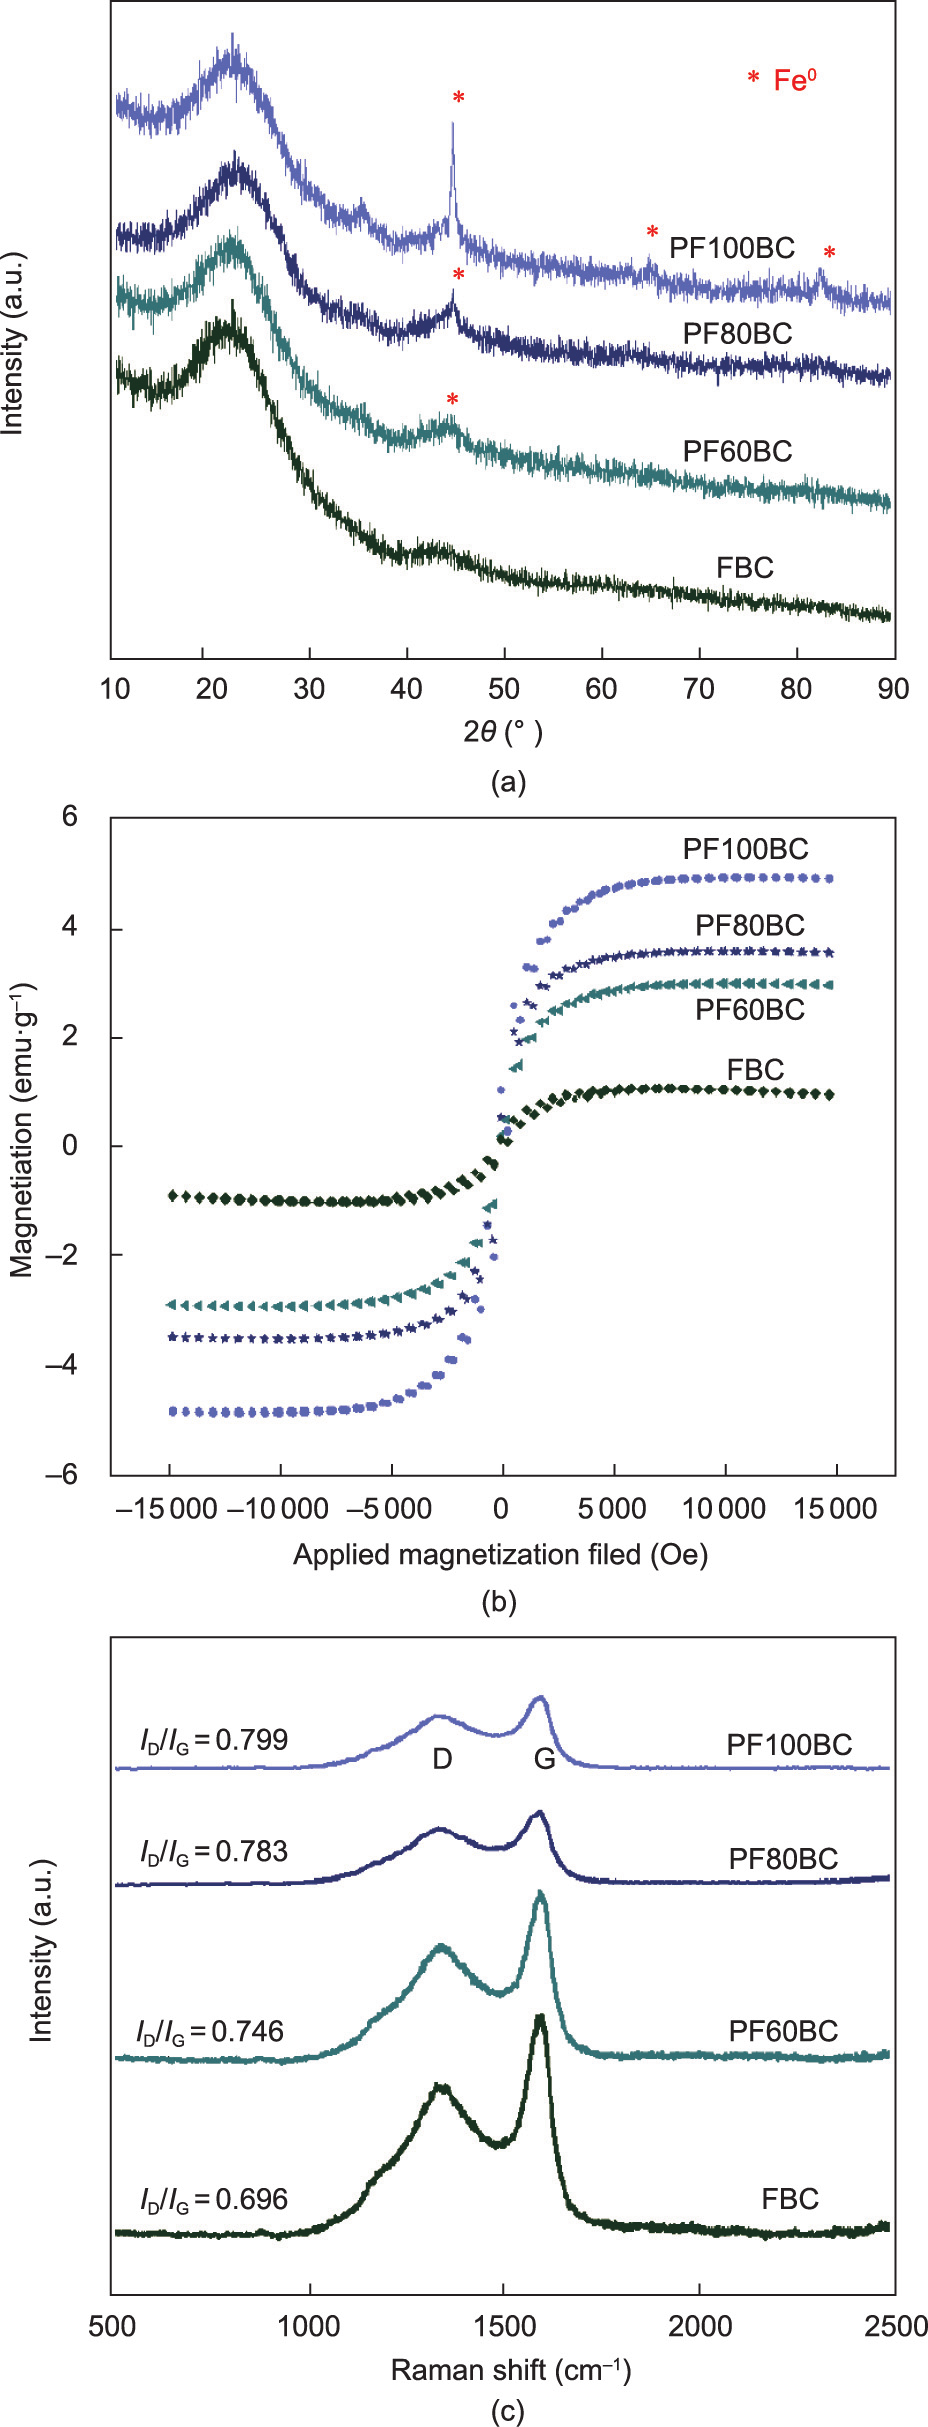
Fig. 1. (a) XRD, (b) VSM, and (c) Raman spectra of as-prepared BC. a.u.: arbitrary unit; 2θ: scattering angle.
(4) SEM and TEM analysis. SEM images of the morphologies of the BC, FBC, and PF100BC are shown in Appendix A Fig. S2(a) and Figs. 2(a)–(c) for comparison. In particular, the surfaces of the BC (Fig. S2(a)) and FBC (Fig. 2(a)) were smooth and had few particles. In contrast, PF100BC (Figs. 2(b) and (c)) was embedded with a large number of white particles, and some bright particles were present on the surface. This observation was further confirmed by comparison with PF80BC (Fig. S2(b) in Appendix A), and the white particles in PF80BC framed by the green box were not as numerous as in the PF100BC. Through TEM (Fig. 2(d)) analysis, we confirmed that the large amounts of white particles growing inside PF100BC were nZVI particles, and this result was consistent with other studies [31,32]. In addition, the Fe0 particles were on the nanoscale, with sizes below 100 nm. The white particles on the surface of PF100BC were believed to be other iron phase components, such as iron oxide; the presence of such particles was confirmed by XPS.
(5) XPS analysis. The element compositions of the prepared BCs were detected by XPS, and the results are listed in Appendix A Table S1, Figs. 2(e) and (f) and Appendix A Fig. S2(c). The content of Fe increased from BC (0.39%) to PF100BC (0.93%); this result was consistent with the XRD and VSM results. In addition, two typical satellite peaks at ~711 and ~724 eV were present in the spectra of FBC and PF100BC (Figs. 2(e) and (f)) and are believed to be the 2p3/2 and 2p1/2 satellite peaks from Fe2O3 [33,34]. Based on the results, the matter attached to the surface of FBC and PF100BC is likely to be Fe2O3. This compound might result from the incomplete reduction of Fe2O3 to Fe0 . Furthermore, the atomic percentage of Fe in the BC was equal to that in the FBC, but the signal peak of Fe2O3 did not appear in the BC (Figs. S2(b)), which might be due to the presence of iron on the surface of the RS as an elementary substance. Based on the above analysis, the nZVI–BC we prepared was composed of Fe0 inside the BC and a small amount of Fe2O3 on the surface.
(6) BET analysis. N2 adsorption/desorption isotherms and information on pore volume and sizes are shown in Figs. 2(g) and (h) and Appendix A Table S2. With the increasing introduction of Fe0 , the specific surface area (SBET) increased and the pore size (Dp) decreased, which might be attributed to the occupation of nano Fe0 particles inside the BC [26], as concluded by XRD, SEM, and TEM analyses.
《Fig. 2》
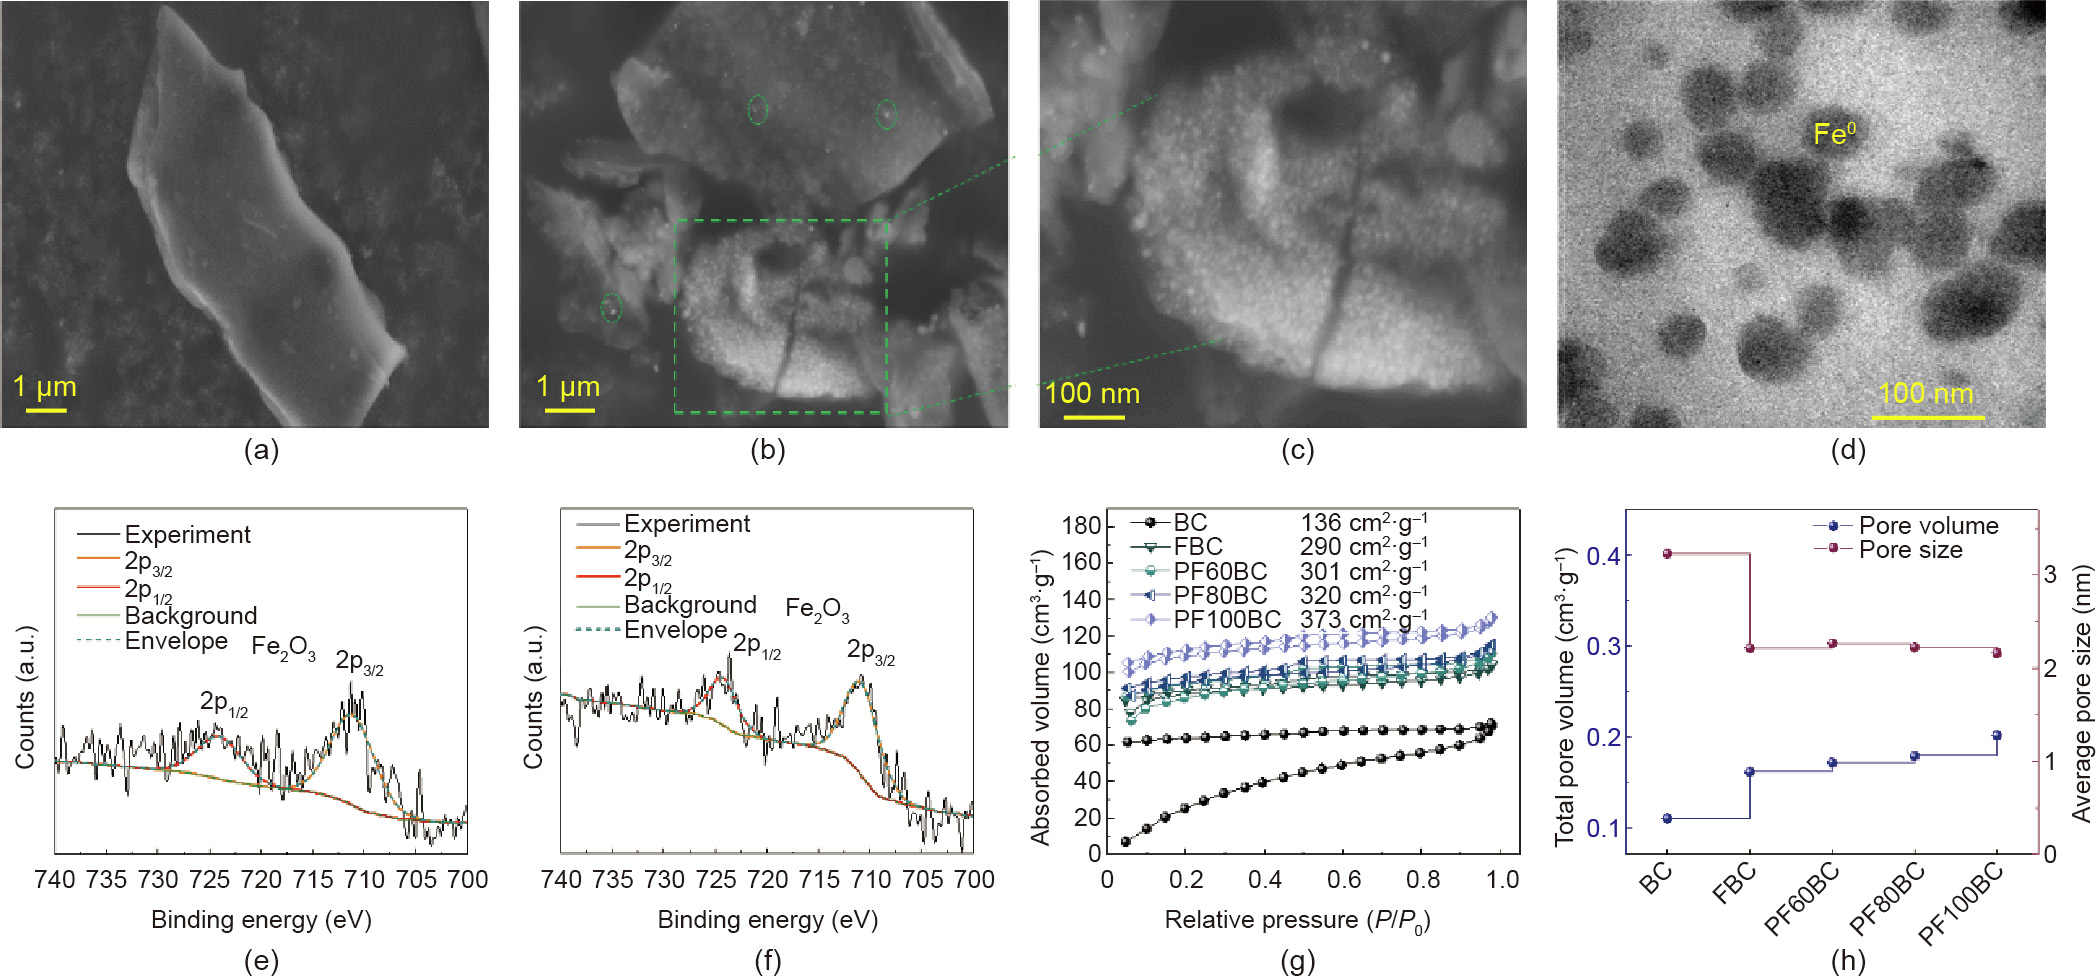
Fig. 2. SEM images of (a) FBC, (b, c) PF100BC; TEM of (d) PFBC; The high resolution Fe2p spectra of (e) FBC, (f) PF100BC; (g) N2 adsorption and desorption isotherms of asprepared BC; (h) pore volume and pore size of as-prepared samples. P0: standard atmospheric pressure.
Compared to the BC and FBC, the PFxBC displayed increases in SBET and total pore volume (Vtot) from 136 and 290 to 373 m2 ·g–1 , and 0.1100 and 0.1610 to 0.2015 cm3 ·g–1 , respectively, indicating the dispersion of Fe0 inside the BC. Moreover, the Dp of the prepared BCs had small mesopores (2–4 nm), and there were no micropores in the BC. However, due to the modification of the RS, as Fe0 was introduced, the micropore volume (Vmicro) increased, indicating that some small pores were blocked by Fe0 particles. Additionally, this result showed that it was better to modify the biomass to enhance its SBET before pyrolysis to BC, as this modification is beneficial for their application.
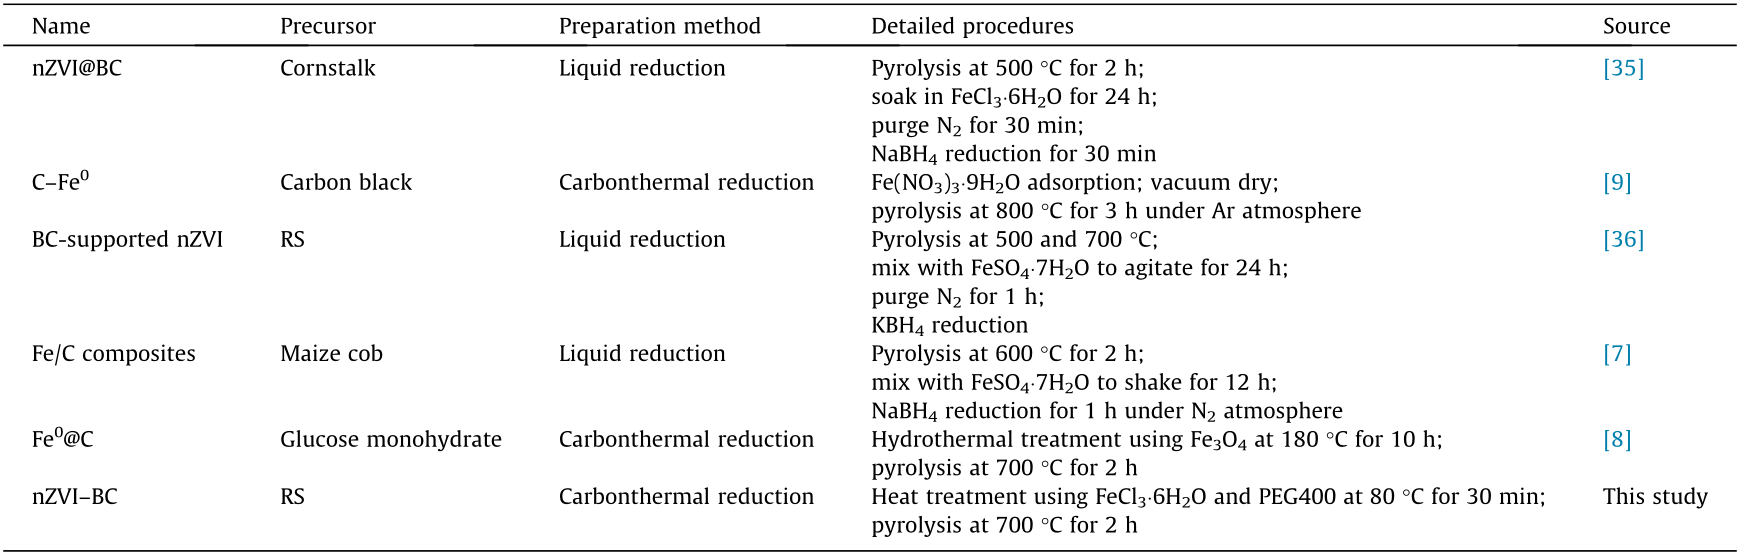
In summary, nZVI–BC can be successfully prepared by our modification method, and the synthetic material has excellent characteristics. Compared with other preparation methods of nZVI–BC (listed in Table 1 [7–9,35,36]), our method has the advantages of simplicity, short time, low cost, and environmental friendliness without an extra reducing agent.
《Table 1》
Table 1 Comparison of different nZVI–BC preparation methods.
In addition, as shown in Appendix A Fig. S3, we monitored the stability of prepared PF100BC via zeta potential at various pH and by XRD at different times. The results indicated that PF100BC has excellent stability over a wide pH range. The surface of the material carried a large amount of negative charge when pH > 6. The XRD results demonstrated that the material exhibited high stability at 240 days. The typical diffraction peak intensity of the Fe0 matched that of fresh Fe0 . No other oxidized substance was observed in the results.
In addition to the physical properties of nZVI–BC, the chemical structure was equally important. Information on the functional groups and chemical element species was obtained by FTIR and XPS (Fig. 3). Since BC and FBC were not composited with Fe0 , we selected PF100BC to conduct the contrast analysis with PFxBC.
3.1.2. Chemistry characteristics
(1) FTIR analysis. As shown in Fig. 3(a), the main bands in BC are as follows: a broad band at approximately 3433 cm–1 is the characteristic peak of O–H, and the band at 1617 cm–1 is assigned to C=C and C=O stretching in the aromatic ring [37], the peak at 1400 cm–1 is indicative of the presence of –COO or a lactone structure [38], the peak at 1091 cm–1 is due to the C–O–C, the bands at 1049 and 801, 880 cm–1 are, respectively attributed to the asymmetric stretching of Si–O–Si and symmetric stretching of Si–O–Si, and the band at 460 cm–1 is due to the bending of O–Si–O [39].
《Fig. 3》

Fig. 3. (a) FTIR spectra of BC, PF80BC, and PF100BC; the high resolution XPS O1s spectra of (b) BC, (c) PF80BC, and (d) PF100BC.
Both organic and inorganic functional groups were present in the BC, as they were in a previous report [40]. However, the FTIR spectra of the nZVI–BC showed different variations. PF80BC and PF100BC were found to show obvious changes at the positions of O–H and Si–O–Si and a weak difference in C=C. Based on the growth of the Fe0 peak in the PF80BC and PF100BC spectra, it undoubtedly occupied some reaction sites on the BC. The Si–O–Si peaks at 880 and 1049 cm–1 were significantly decreased or eliminated, suggesting that a reaction occurred between Fe0 and Si–O– Si, as occurred a previous study [36]. The O–H functional group shifted from 3428 to 3445 cm–1 ; this shift was attributed to the effect of iron attachment [39]. In addition, the peaks indicating C=C and C=O bonds in the aromatic ring, which appeared at 1617 cm–1 , were enhanced from a broad and irregular band to a strong and narrow peak. The exposed aromatic skeleton was derived from the lignin fractions of RS pyrolysis under high temperature because of the thermal destruction of cellulose and the aliphatic alkyl groups in the side chain [37].
FTIR analysis preliminarily demonstrated that the Fe0 embedded inside the BC was bonded in the form of Si–O–Fe. It had a strong C=C skeleton, and the Fe0 particles were dispersed inside the aromatic structure, avoiding aggregation and oxidation. To further determine the linked form of Fe0 in nZVI–BC, the changes in the surface oxygen species of BC and PFxBC were detected by XPS.
(2) XPS analysis. Deconvoluting the XPS O 1s peak could help to identify the changes in prevalent oxygen species on the BC surface. The peaks at ~532.9, ~533, ~531, and ~530 eV correspond to SiO2, organic C–O, metal carbonates and metal oxides [41]. Evidently, the dominant oxygen species was inorganic SiO2 in BC (Fig. 3(b)), which had a relative abundance of 51.7%. This result can also be explained by XRD analysis of BC (Appendix A Fig. S4). Compared to those of other samples, the characteristic peaks of SiO2 only occurred in the XRD patterns of BC, indicating the high content of SiO2 in the BC. The SiO2 in PF80BC and PF100BC decreased from 51.70% to 43.75% and 24.35%, respectively (Figs. 3(c) and (d)). This decrease was due to the production of Fe0 particles, which reacted with the SiO2, as described in the FTIR analysis. Additionally, the oxygen species of organic C–O of P80FBC and PF100BC increased from 37.84% to 47.90% and 67.06%, respectively, and were the dominant oxygen species. The results confirmed the changes in chemical composition, including inorganic Si–O–Si and organic C–O functional groups in terms of content, and identified the iron oxides that were present on the BC surface. As described in Figs. 3(c) and (d), the metal oxide peaks demonstrated the presence of Fe–O, which was corroborated the presence of Fe2O3 on the surface.
Thus, it can be concluded that nZVI–BC consists of Fe–O (Fe2O3) and Si–O (SiO2) on the surface and Fe0 within the core of the C=C (derived from lignin) skeleton/shell. This ‘‘core–shell” construction is favorable for protecting the Fe0 from oxidation.
《3.2. RS modification mechanism》
3.2. RS modification mechanism
The characteristics of the synthesized BCs indicated that the FeCl3 modification of RS was enhanced by PEG400. To clarify the effect of PEG400 on RS modification, we explored the physicochemical structure changes of RS before and after enhanced modification.
3.2.1. RS structure changes
As shown in Figs. 4(a)–(c), the surface of unmodified RS is rigid, and it has large amounts of lignin. After FeCl3 modification, due to the acidic environment, the lignin was reordered and deposited on the F–RS surface in the form of droplets [36]. However, with the addition of PEG400, the structure of the PF80–RS became loose, and lignin was isolated by the solvolysis of the RS [42,43].
《Fig. 4》
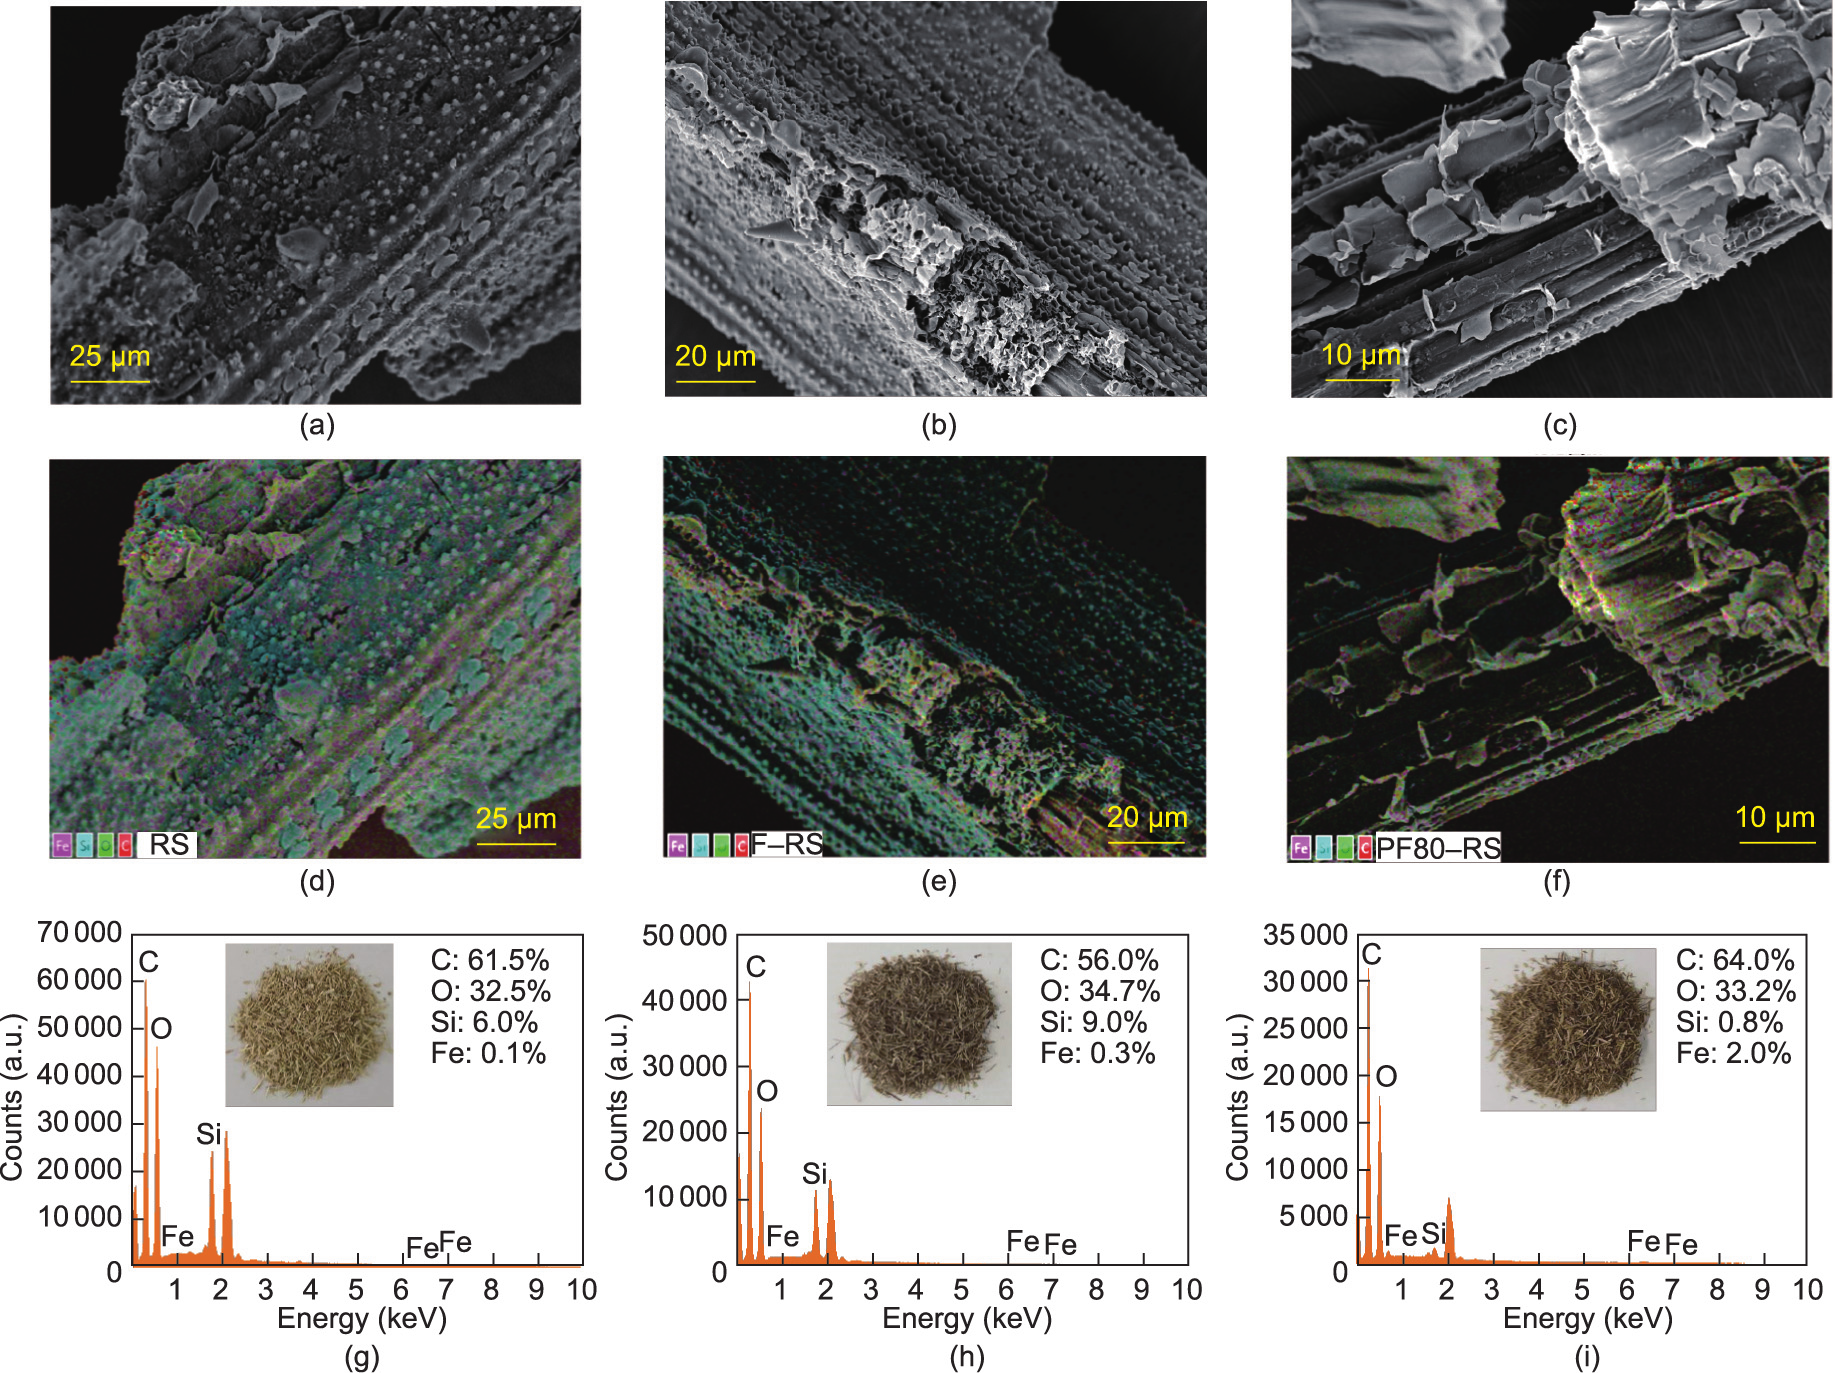
Fig. 4. SEM images of (a) RS, (b) F–RS, and (c) PF80–RS; EDS mapping of (d) RS, (e) F–RS, and (f) PF80–RS; EDS energy spectra and pictures of (g) RS, (h) F–RS, and (i) PF80–RS.
Additionally, the changes in RS from different modifications were reflected in the color and distribution of elements on their surface. It can be seen from Appendix A Fig. S5 that while the unmodified RS was yellow, the F–RS changed to black brown, and PF80–RS and PF100–RS were reddish-brown; this difference in color might result from the lignin or the mixture of lignin and iron oxide remaining on the surface of RS. In Refs. [44,45], biomass was pretreated with FeCl3 under high temperature and high pressure, showing delignification, and the corresponding chemical group signals weakened. However, in this study, the FeCl3 treatment conditions were normal pressure and temperatures below 100 °C. Thus, the treatment could not cause substantial lignin removal or obvious changes in chemical structure, as displayed in the FTIR analysis (Appendix A Fig. S6).
In addition, EDS mapping pictures and energy spectra (Figs. 4(d)–(i)) showed that the content of Fe increased from 0.1% in RS and 0.3% in F–RS to 2.0% in PF80–RS, indicating that the introduction of PEG400 to the system was favorable for iron phase deposition. Moreover, the species of the iron phase were confirmed to be Fe2O3 by XPS (Fig. 5). Two typical satellite peaks occurred in F–RS and PF80–RS at positions of ~711 and ~724 eV, which were attributed to the 2p3/2 and 2p1/2 satellite peaks from Fe2O3. Clearly, the peak intensity of PF80–RS was stronger than that of F–RS. The Fe content was 3.33%, which was 9.4-fold higher than that of F–RS (0.32%). This result was in line with those of the EDS energy spectra. In addition, more Fe (5.47%) covered the PF100–RS, as listed in Appendix A Table S3, suggesting that the elevated temperature was better for the conversion of FeCl3. This result supported the conjecture of color changes due to lignin and iron oxide.
《Fig. 5》
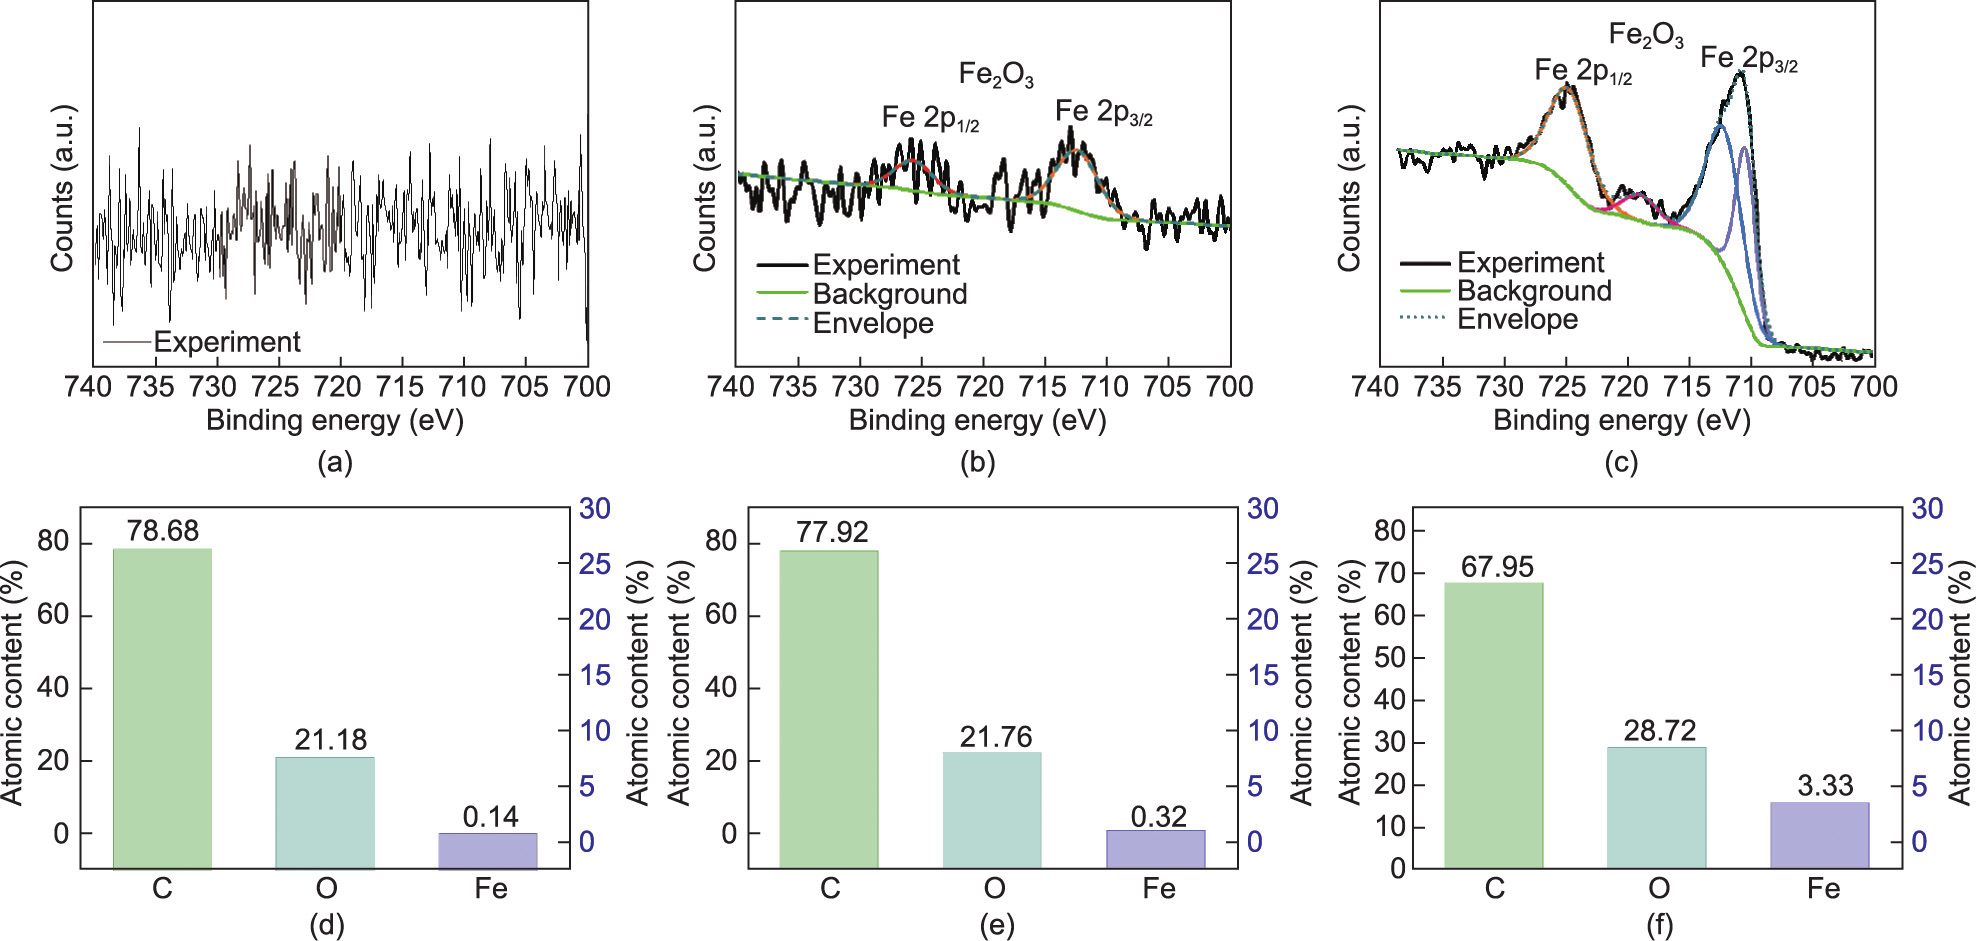
Fig. 5. The high resolution XPS Fe 2p spectra of (a) RS, (b) F–RS, and (c) PF80–RS; the percentage of element atomic content of (d) RS, (e) F–RS, and (f) PF80–RS.
Therefore, PEG400 played dual roles in the structural changes of RS and enhanced the production of Fe2O3 compared with RS modification by FeCl3 alone.
3.2.2. Proposed iron phase transfer mechanism
PEG is a bifunctional amphiphilic polymer with reactive –OH groups on both ends [46], and it is usually considered a phase transfer catalyst [47]. The quantity of protons decreases as the amount of PEG increases in a liquid phase system [48]. In the RS system modified by FeCl3, FeCl3 could hydrolyze because of heating. Once Fe(OH)3 was deposited on RS and dried, it was converted to Fe2O3, as shown in Eqs. (1) and (2):
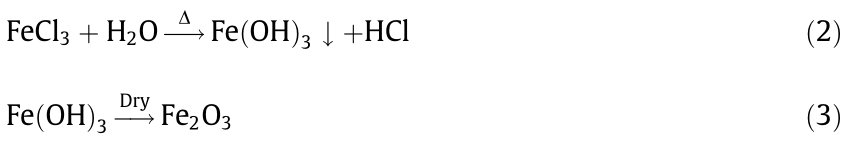
However, the hydrolysis of FeCl3 under this condition might be weak, and it was restrained by the produced H+ . Thus, a small amount of Fe2O3 was detected in the F–RS (Figs. 4(h) and 5(e)). Adding PEG400 and increasing the temperature led to the consumption of H+ [48] and promoted the positive movement of the hydrolysis reaction, and more Fe2O3 was produced (Figs. 4(i) and 5(f)).
Beyond that, the structural changes in RS caused by the addition of PEG400 also played an important role in the production of Fe2O3 on the surface of RS. After modification by FeCl3, the F–RS surface was still rigid (Fig. 4(b)) and not conducive to the adsorption of Fe(OH)3. However, the surface of PF–RS was rough and exposed cellulose, which might provide convenience for the adsorption of Fe(OH)3, so more Fe2O3 was produced after drying.
Above all, it can be concluded that PEG400 led to increased hydrolysis of FeCl3 to Fe(OH)3, and the modification system enhanced the change in the RS surface structure, promoting the transfer of Fe(OH)3 onto the RS and the production of Fe2O3. This result was important to Fe0 formation in the following pyrolysis. We called the modification ‘‘iron phase transformation,” and the proposed mechanism diagram is shown in Fig. 6.
《Fig. 6》

Fig. 6. Proposed iron phase transfer mechanism of enhanced FeCl3 modification of RS by PEG400.
《3.3. Pyrolysis mechanism of modified RS to nZVI–BC》
3.3. Pyrolysis mechanism of modified RS to nZVI–BC
Fe0 formation in the pyrolysis was mainly attributed to reduction by carbon and reducing gas (i.e., CO and H2) [49], which were produced from biomass pyrolysis. The volatiles released from the pyrolysis of biomass play an important role in the reduction process [50]. Fe2O3 was reduced to Fe0 with the help of these reducing gases. The type and output of reducing gas affected the quality of the reduction reaction. The release of gases depended on the pyrolysis temperature [51]. According to previous studies, we knew that CO was produced from hemicellulose over the whole pyrolysis temperature range. However, cellulose produced a relatively small amount of gas, while gas produced from lignin mainly occurred at temperatures higher than 600 °C [17]. CH4 was mainly released from the C–C crack of lignin at 500–580 °C, and H2 was mainly produced from breaking of the C–H bond as the temperature continued to increase [52].
FTIR spectra of PF100–RS and PF100BC are shown in Fig. 7, and assignments of absorption bands are shown in Appendix A Table S4 [15,53,54]. Visually, the main bands at 1384, 1245, 1163, 1061, and 898 cm–1 of cellulose and hemicellulose disappeared, indicating the breaking of the C–H, C–O, and C–O–C bonds. The bands related to the aromatic skeleton vibration of lignin only disappeared at 1513 cm–1 , suggesting that the breaking of the C–C bonds was not easy. This bond breakage led to the formation of a matrix structure of BC. The breakage of the C–O and C=O bonds at 1732 cm–1 mainly led to the formation of CO and CO2. H2 was produced from the breaking of C–H at 2919 and 1384 cm–1 . The small amount breaking of the C–C bonds resulted in a low CH4 yield. Previous literature demonstrated that the gas yield would increase with increasing temperature [18]. As these gases formed, Fe2O3 reacted with them and was reduced to Fe0 . Notably, the temperature was set to 700 °C in this work; this temperature was higher than the abovementioned temperature. Moreover, the modified RS was not substantially destroyed. PEG400 only enhanced the production of Fe2O3 and improved the RS surface structure, and lignin was retained in the RS. Therefore, the modified RS could provide nearly all the necessary biomass components for gas production. Additionally, the reduction of Fe2O3 by CO and H2 to produce Fe0 would result in two intermediates, Fe3O4 and FeO (at temperatures above 570 °C) [14]. Under these conditions, Fe2O3 can be reduced to Fe0 under enough reducing gases. The formation of Fe0 was explained by Eqs. (4)–(9).
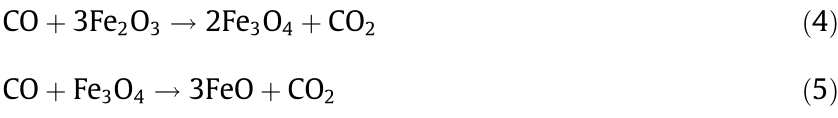

《Fig. 7》
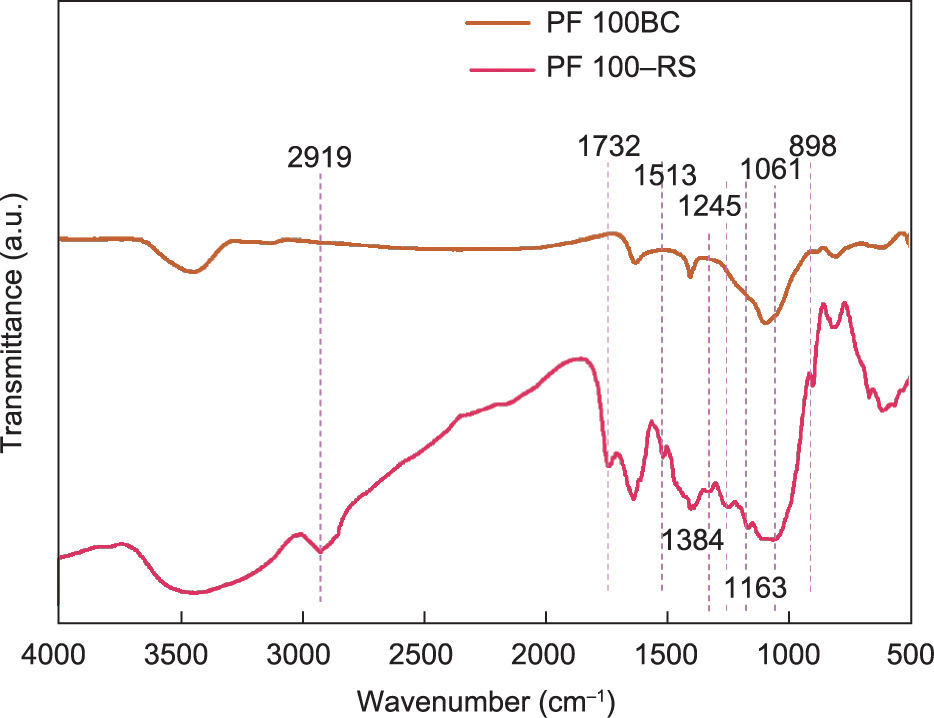
Fig. 7. FTIR spectra comparison of PF100–RS and PF100BC before and after pyrolysis.
Furthermore, to investigate whether Fe2O3 can be reduced to Fe0 at lower pyrolysis temperatures, we used PF80–RS and PF100–RS to carry out pyrolysis experiments at 500 °C for comparison. The result was detected by XRD (Appendix A Fig. S7). The diffraction peak of Fe0 at ~44.7° was absent, indicating that the gases released from pyrolysis at 500 °C were not enough to completely reduce Fe2O3 to Fe0 . Some reports have demonstrated that as the temperature increased, CO, CH4, and H2 were generated or increased [51]. Therefore, if we want to form BC with Fe0 by carbothermal reduction, an appropriate pyrolysis temperature is crucial. This result was consistent with those of previous studies [49].
In addition to the low yield of gas production caused by low temperature (500 °C), carbon also played a role in the reduction of Fe2O3. The iron reduction process has been known to occur in gaseous phases such as CO and H2 rather than reaction on solid carbon materials [55]. Carbon can affect the reduction of CO2 according to Eq. (10).

During pyrolysis, CO2 was mainly produced at low temperature (< 500 °C) from hemicellulose at a high temperature (> 500 °C) [17]. As shown in the XPS spectra (Appendix A Fig. S8) and Appendix A Table S5, the O/C ratios of PF80BC and PF100BC decreased from 0.120 and 0.130 to 0.110 and 0.086, respectively, at 500 and 700 °C. The sp2 -C at ~284.4 eV and sp3 -C at ~285.0 eV (Appendix A Figs. S8(a) and (b)) in the carbon material increased (from 36.19% to 47.77% and 36.31% to 55.68%) and decreased (from 38.19% to 32.94% and 37.25% to 27.72%), respectively, indicating that the degree of graphitization of nZVI–BC improved [56]. This result might be due to the amorphous carbon involved in the reduction of CO2; the produced CO continued to participate in the reduction of Fe2O3 to Fe0 according to Eqs. (4)–(6).
In this study, Fe0 was obtained by in situ carbothermic reduction, decreasing the release of greenhouse gases and environmental pollution; thus, this nZVI–BC preparation method can be regarded as a green production process. To better explain the formation of iron, the mechanism diagram is shown in Fig. 8.
《Fig. 8》

Fig. 8. Schematic pyrolysis process of nZVI–BC.
《3.4. Application test of nZVI–BC in CR removal》
3.4. Application test of nZVI–BC in CR removal
To confirm the ability of PF100BC (that is, nZVI–BC) to remove pollution, we conducted an advanced catalytic oxidation experiment of CR, employing PF100BC as a catalyst. Control experiments of PS oxidation and PF100BC absorption alone were also performed.
3.4.1. CR removal analysis
As shown in Figs. 9(a) and (b), compared with that of oxidation using PS alone, the removal rate of PF100BC for CR increased sharply. During the same monitoring time, the remaining concentration of CR using PF100BC as a catalyst was much lower than that without using PF100BC, indicating that PF100BC had performed the CR removal by advanced oxidation. The catalytic effect of PF100BC was satisfying. Within 5 min, PF100BC showed a highly efficient absorption ability of 70.6%. Additionally, the concentration of CR decreased from 30.0 to 7.3 mg·L–1 , and the removal rate reached 75.67% by advanced catalytic oxidation with PF100BC. However, at this point, the removal rate of CR by PS oxidation alone was 4.3%. Therefore, under the catalysis of PF100BC, the oxidation efficiency of CR increased 17.6-fold. At 60 min, the CR concentration decreased to 3.0 mg·L–1 , and the removal rate reached 90%. However, the absorption removal of CR by PF100BC was as low as 61.3%, which might be due to the desorption of PF100BC. The oxidation efficiency of CR by PS was just 8.3%, indicating that the advanced oxidation reaction was slow without the activation of nZVI. Moreover, as shown in Appendix A Fig. S9, the modeling results demonstrated that the catalytic degradation of CR by PF100BC complied with pseudo-first-order kinetics [57].
《Fig. 9》

Fig. 9. Catalysis oxidation experiment of CR removal. (a) Degradation behavior of CR under different time by three methods; (b) CR removal efficiency under different conditions; (c) UV–vis scanning of CR after three removal approaches; (d) XRD spectra of fresh and used PF100BC by absorption and catalytic oxidation; (e) FTIR spectra of fresh and used PF100BC by absorption and catalytic oxidation; (f) EDS mapping image of used PF100BC by catalytic oxidation. Experimental conditions: CR 30.0 mg·L–1 , PF100BC 0.5 g·L–1 , PS 1.8 mmol·L–1 , temperature 30 °C.
In addition, wavelength scanning of the CR solution was performed after the three reactions (Fig. 9(c)). After the oxidation of PS, the CR still had distinct absorbance peaks at 498 nm. After the absorption of nZVI–BC, the peak decreased, but the chromogenic absorption peak did not disappear. After advanced oxidation with PF100BC, the peak disappeared, demonstrating that the cleavage of the azo chromophore from CR might be related to nZVI [58].
3.4.2. The role of nZVI–BC on CR removal
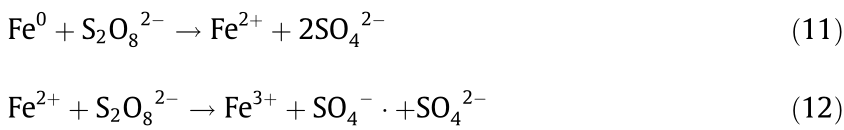
To explore the effect of PF100BC on CR removal, the XRD spectra (Fig. 9(d)) of fresh and used PF100BC were monitored. They were nearly unchanged, and only the peak of ZVI decreased after use, which was attributed to the reaction of ZVI and S2O82– (Eqs. (11) and (12)). Due to the formation of SO4–, CR was decolored and degraded quickly.
The FTIR spectra (Fig. 9(e)) displayed different results. The bands of –COO and –OH disappeared after absorption and catalytic oxidation. This disappearance might be due to the –COO and –OH groups forming hydrogen bonds with dye anions of –NH2 [59]. Thus, rapid adsorption was demonstrated. From the results of unstable absorption and increased advanced catalytic oxidation, it could be explained the CR was absorbed on the PF100BC relying on the bonding of functional groups, simultaneously degraded by the SO4– . generated from the activation of S2O82– via Fe0 , with the electron transfer [28,35]. The mapping picture (Fig. 9(f)) of the nZVI–BC after advanced oxidation showed the presence of iron oxide on its surface, indicating the redox reaction of Fe0 . Throughout the whole process, absorption promoted the advanced oxidation degradation of CR [33].
In summary, the PF100BC prepared by our method displayed a quick and excellent ability to be applied in dye removal as a catalyst. Experiments to determine the optimal conditions for the efficient, advanced oxidation of CR, such as the dose of PF100BC, initial CR concentration, and pH of the CR solution, are being conducted. Further investigations on the detailed electron transfer mechanism of ZVI, free radical mechanism of ·OH or O2– . and CR degradation pathway are being studied.
《4. Conclusions》
4. Conclusions
In this work, RS was modified by the improved strategy of introducing PEG400 into the FeCl3 reaction system, and the modified RS was successfully prepared to magnetic nZVI–BC by carbon thermal reduction. In the RS modification, PEG400 promoted the hydrolysis of FeCl3 and improved the RS surface structure, realizing the production of Fe2O3 on the RS surface. In the later pyrolysis process, carbonized RS and Fe2O3 underwent a redox reaction with reducing gas participation to form nZVI–BC. The obtained magnetic nZVI–BC was pure, and Fe0 was embedded inside the carbon skeleton, protecting it from oxidation. nZVI–BC was tested for the advanced oxidation of CR, exhibiting a rapid absorption of 70.6% within 5 min and highly efficient catalytic degradation of 90% removal at 60 min. The novel modification method we proposed is simple, lowcost, time-saving, and environmentally friendly.
This study has significant implications for guiding the conversion of biomass to BC and great potential to drive the scale production of nZVI–BC, which is expected to be applied in batches for environmental remediation in the future.
《Acknowledgments》
Acknowledgments
This work was supported by the National Natural Science Foundation of China (51978204), the State Key Laboratory of Urban Water Resource and Environment (Harbin Institute of Technology) (2020DX06), the Heilongjiang Postdoctoral Science Foundation (LBH-TZ2012), and the Fundamental Research Funds for the Central Universities.
《Compliance with ethical guidelines》
Compliance with ethical guidelines
Sheng-Nan Zhuo, Hong-Yu Ren, Guo-Jun Xie, De-Feng Xing, and Bing-Feng Liu declare that they have no conflicts of interest or financial conflicts to disclose.
《Appendix A. Supplementary data》
Appendix A. Supplementary data
Supplementary data to this article can be found online at https://doi.org/10.1016/j.eng.2021.07.012.


 京公网安备 11010502051620号


