

《1. Introduction》
1. Introduction
《1.1. General background》
1.1. General background
General anesthesia has been defined as the presence of unconsciousness, amnesia, and immobility [1]. This concept includes the suspension of not only the conscious activities performed by the brain, but also of the neurological and psychological factors mediated by the spinal cord. Every year, tens of millions of patients are placed under general anesthesia, which suppresses the treasured psychological attribute of consciousness. The ability of anesthesiologists to induce safe and reversible loss of consciousness (LOC) has proven invaluable. However, clinical monitoring systems for anesthesia are still lacking in their development, and the neurological mechanism of anesthetic-induced LOC remains unclear.
Research on unconsciousness under anesthesia has been conducted at both the micro- and macro-levels. At the micro-level, many studies have explored the mechanisms of action of general anesthetics on ion channels, receptors, and other molecules. Different anesthetics act on different molecular targets, which may play an important role in explaining various mechanisms of LOC caused by general anesthesia. The  -aminobutyric acid type A (GABAA) receptor is the main inhibitory receptor in the brain and plays a pivotal role in LOC caused by general anesthetics. Researchers have found that mutations in the GABAA receptors alter the sensitivity of the brain towards anesthetics [2]. N-methyl-D-aspartic acid (NMDA) receptors, which are present in presynaptic and postsynaptic structures, are also targets of general anesthetics. Most inhaled anesthetics inhibit the NMDA receptors, but the level of inhibition differs for various anesthetics [3]. General anesthetics can cause the opening of tandem two-pore potassium (K2Ps) channels. Studies have shown that K2P knockout mice have reduced sensitivity to inhaled anesthetics, suggesting that K2P channels are also the target of general anesthetics [4]. In addition to the three targets mentioned above, the effects of anesthetics on the brain are also mediated by other targets, which have not been fully studied [5].
At the macro-level, the development of neuroimaging technologies has enabled the investigation of the effects of anesthesia on multiple scales. However, the results from early anesthesia research and clinical testing are not as accurate as those reported more recently. Initially, anesthesia was studied primarily in the context of its clinical application and mainly depended on the measurement of the blood pressure, heart rate, respiration, and other physiological indicators. However, these indicators generally reflect indirect reactions caused by reduced levels of consciousness. In 1965, the minimum alveolar concentration (MAC) value was proposed as an indicator of the level of consciousness [6]. The MAC value is a measure that reflects the efficacy of inhalation anesthesia, which refers to the alveolar concentration of anesthetic gas necessary to prevent a bodily reaction to skin incisions in 50% of patients who inhaled anesthetic gas combined with pure oxygen at 1 atm (1 atm = 101 325 Pa) of pressure. However, the MAC value assesses anesthesia only at the somatic level and is merely an index of spinal nerve reflexes under noxious stimulation, which is not equivalent to unconsciousness [1,7,8] and is also affected by analgesic administration [9]. To overcome these limitations, researchers have recently attempted to investigate how anesthetics act on physiological targets [10] and to identify the mechanisms through which anesthetic drugs induce LOC.
Indirect reactions aside, the change in the brain’s ability to integrate information is the direct physical correlation of a transition between consciousness states; such changes in integration should be the focus of our research. Based on recent neuroimaging studies, several different theories have been proposed to explain the mechanisms of anesthesia, including aberrations of cortical and thalamic connections [11–13], disrupted sleep–wake cycles [5,14,15], and cortical fragmentation [16,17]. Anesthetics can produce unconsciousness by blocking the interactions between specific brain regions and/or by reducing the transmission of information [18–20], and it has also been suggested that the cortex may represent the main target of anesthetics, given that the effect of both propofol and sevoflurane appears later in the subcortex compared with the cortex [21]. Notably, anesthetized and sleeping brains have long been revealed to show significant similarities; for example, the spindle waves observed during dexmedetomidineinduced sedation are similar to those that occur during normal sleep [22]. Natural sleep and wakefulness are controlled by multiple arousal pathways [23]. Anesthetics can affect the thalamus and cortex, suppress the wakefulness phase, and enhance the sleep phase. The sleep–wake cycle in the brain is a bistable system without an intermediate process, which coincides with the typically rapid return of wakefulness once anesthesia is discontinued [5]. Although general anesthetics can affect various targets in the sleep–wake cycle, the direct targets of these anesthetics remain to be elucidated [14]. Moreover, the neural mechanisms of general anesthetics, from molecular targets to the whole-brain level, remain unclear. General anesthetics can regulate the interactions between different brain regions by activating and/or inhibiting specific receptors within the central nervous system, eventually affecting the whole-brain networks and triggering reversible LOC.
In the study of anesthesia, various neuroimaging methods have been combined with network analyses. However, the clinical monitoring of anesthesia still lacks in its development and relies primarily on bodily reactions. Importantly, a lack of bodily reactions does not necessarily indicate unconsciousness. For anesthesia monitoring, unconsciousness should be judged from the perspective of connectivity (interaction between brain regions) [24]. The ideal monitoring equipment for assessing the depth of anesthesia (DOA) must meet the following requirements:
(1) Accurate monitoring of the patient’s state of sedation and good correlation with clinical sedative performance;
(2) Accurate and reliable data;
(3) Compact equipment that is convenient to set-up and use;
(4) The ability to provide useful information to clinicians for decision-making;
(5) A lack of susceptibility to electromagnetic interference and interference from other equipment.
Unfortunately, the existing clinical anesthesia monitoring system does not meet these requirements. In practice, anesthesiologists often judge the DOA through observing the reactions of patients that is highly relying upon the empirical experience. There are various scoring criteria for the evaluation of the state of sedation, including the Ramsay Sedation Scale (RSS) [25], the Motor Activity Assessment Scale (MAAS) [26], and the Sedation–Agitation Scale (SAS) [27]. Scores on these scales are based on the patient’s unresponsiveness to external disturbances, such as sound stimulation and noxious stimulation. Currently, the existing clinical anesthesia monitoring methods are far from meeting the prerequisites for precisely controlled anesthesia, and the risk of intraoperative wakefulness is relatively high. Unlike studies focused specifically on consciousness, the clinical application of anesthesia monitoring also needs to eliminate responses to noxious stimuli and prevent the patient from remembering any intraoperative events. Existing clinical anesthesia monitoring methods are not sufficiently accurate for the monitoring of consciousness, analgesia, and postoperative trauma. Additionally, individual differences have become a major obstacle to the precise application of anesthesia. Existing clinical anesthesia monitoring simplifies the complexity of brain monitoring for convenience, but also ignores much of the abundant information available for measurement within the brains of sedated patients. Hence, to meet the needs of anesthesia in the future, it is necessary to develop a method that takes advantage of this wealth of information, but it is also convenient to use in a clinical setting. Connectivity and network analysis based on electroencephalography (EEG) have provided us with a new idea for a system that directly reflects the change in consciousness at the whole-brain level, which offers great potential for developing comprehensive and holistic anesthesia monitoring and eliminating individual differences.
《1.2. Aim and overview》
1.2. Aim and overview
This study reviews the development of brain connectivity research in the field of anesthesia, with a particular focus on the context of clinical anesthesia monitoring. Most of these studies investigated the mechanisms of anesthesia, from which we can obtain a clearer and more reliable understanding of anesthesia. A few studies have explored the combination of anesthesia mechanism research and clinical anesthesia monitoring. We performed an in-depth investigation and concluded that the study of brain functional connectivity (FC) and network during anesthesia is likely to give rise to clinical applications. To summarize the progress of anesthesia mechanism research in recent years and to identify the potential nexus of clinical monitoring and brain network research, this review focuses on the trends in the development of complex EEG-based network analyses in anesthesia and consciousness research over the last five years. In summary, this paper intends to highlight how brain FC and network analysis can be used to identify states of consciousness under anesthesia and propose future research directions that deserve attention to promote the development of anesthesia monitoring.
The main structure of this review is divided into the following four parts:
(1) We summarize the mechanism of anesthesia from both micro- and macro-scale perspectives. At the micro-level, we introduce the mechanism of general anesthetics at the level of molecular channels, receptors, and other molecules. At the macro-level, we discuss cortical and thalamic connections, the sleep–wake cycle, and cortical fragmentation.
(2) We introduce different neuroimaging methods of anesthesia, including functional magnetic resonance imaging (fMRI), positron emission tomography (PET), functional near-infrared spectroscopy (fNIRS), and EEG. Furthermore, we summarize the advantages and disadvantages of these techniques.
(3) We analyze the shortcomings of the current electrophysiological anesthesia-monitoring methods in clinical use and compare them with the methods used in basic research. We also introduce the theory of brain connectivity and graph theoretical analysis, with a focus on the role and importance of this conceptual framework in anesthesia research. There has been a focus on discovering the brain connectivity and networks in anesthesia over the past five years; furthermore, based on the literature from this period, we discuss the potential combination of these techniques in clinical and research applications and the potential improvement of monitoring systems.
(4) We propose that low- and medium-density EEG can optimize current clinical anesthesia monitoring methods. Moreover, the combination of small-scale network structure analysis and FC analysis provides a potential opportunity for clinical applications. It is hoped that medium-density EEG will expand the clinical monitoring of responses to different anesthetics and resolve the issue of individual differences in anesthesia monitoring. Furthermore, if mediumdensity EEG is used in the study of noxious stimuli under anesthesia, it may be possible to monitor the analgesic effects of narcotic drugs during noxious stimulation. Finally, we suggest future directions for dynamic FC and machine learning to help open new avenues for identifying underlying consciousness states under anesthesia.
《2. Neuroimaging studies of anesthesia》
2. Neuroimaging studies of anesthesia
In July 2021, we conducted a literature survey of neuroimaging studies of anesthesia in the Web of Science database using different keyword combinations (Fig. 1). In this section, we briefly introduce the neuroimaging studies of anesthesia. Given that most anesthesia studies were conducted using EEG techniques, the current review focuses mainly on EEG studies of anesthesia and consciousness in Section 3. Moreover, recent findings of anesthesia studies using EEG- and fMRI-based brain network methods are presented in Section 4, considering that most brain network studies were performed using these two modalities.
《Fig. 1》
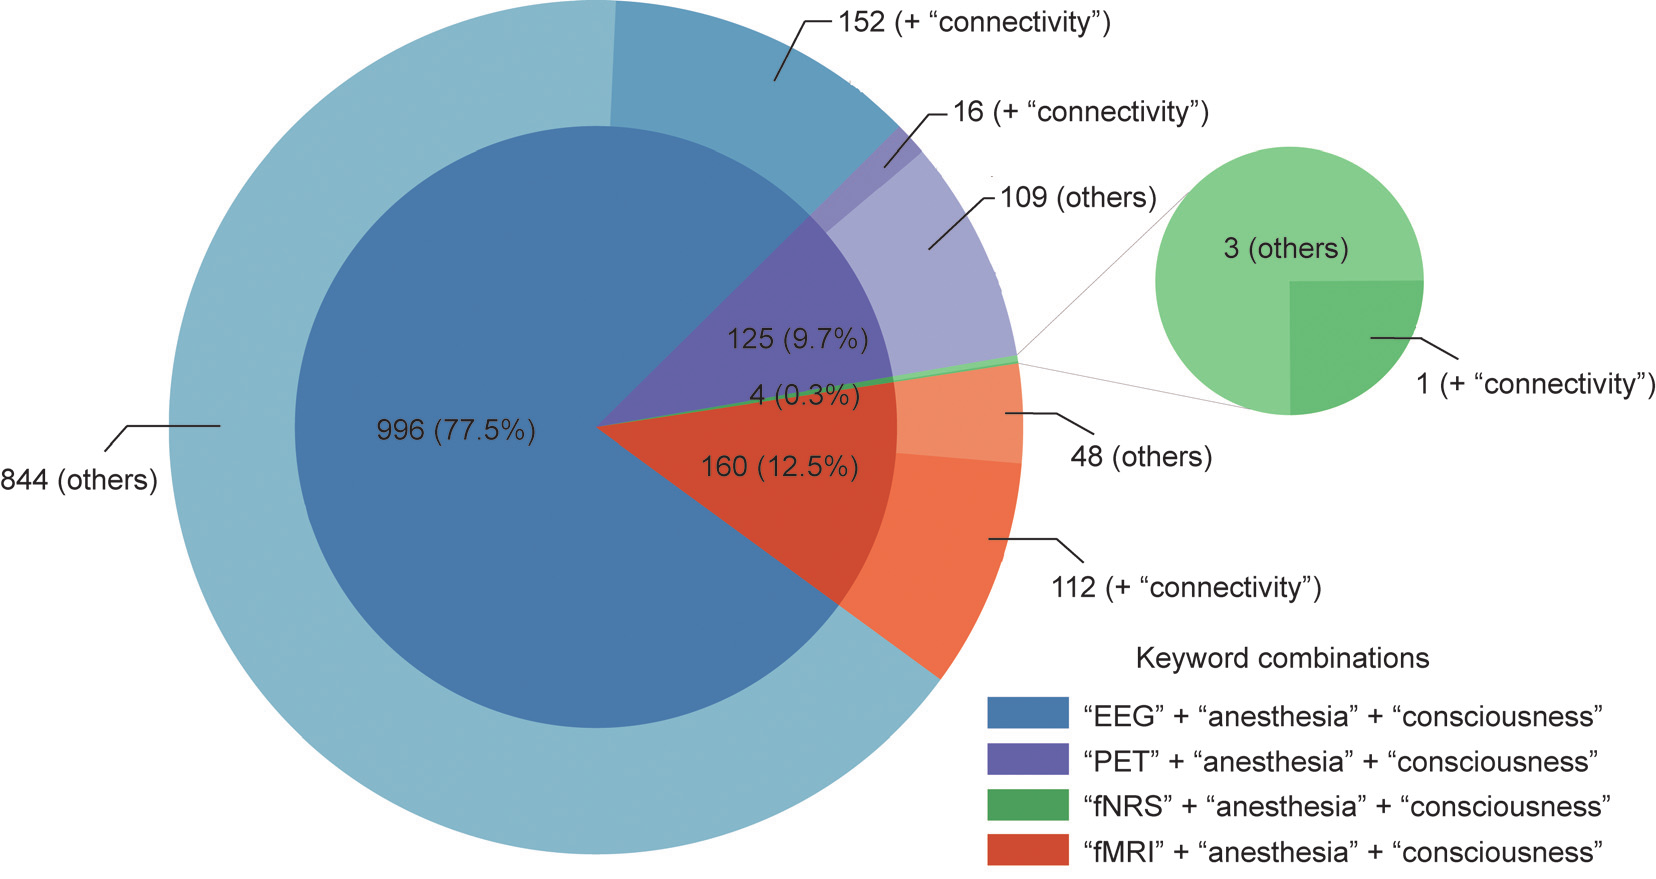
Fig. 1. Neuroimaging studies of anesthesia in the Web of Science database searched in July 2021. The pie chart in the center are the number and percentage of neuroimaging studies of anesthesia that are categorized according to different imaging methods (i.e., EEG, fMRI, PET, and fNIRS). The circular diagram stands for the number of brain network studies (added with the keyword ‘‘connectivity”) and other studies of anesthesia.
《2.1. Functional magnetic resonance imaging》
2.1. Functional magnetic resonance imaging
fMRI detects hemodynamic changes caused by neuronal activity, with moderate temporal resolution (i.e., at the second scale) and high spatial resolution (i.e., at the millimeter scale). Because of its high spatial resolution, fMRI has been widely used in the study of spatial activity patterns in the brain, especially in the default mode network (DMN), which exhibits high activity and metabolism [28]. fMRI has also been widely used in anesthesia studies. Many studies have explored the effects of anesthetics on brain activation during stimulation (e.g., tactile, auditory, and visual stimuli). Kerssens et al. [29] studied six male volunteers breathing sevoflurane via a laryngeal mask for a set end-tidal concentration. They tested the volunteers’ memories after recovery and imaged the fMRI responses to auditory stimulation. The results showed that sevoflurane induced the dose-dependent suppression of auditory blood oxygen level-dependent signals, which likely limited the word processing during anesthesia and compromised memory. Dueck et al. [30] used fMRI to monitor responses to auditory stimulation under propofol anesthesia and found that the ability to process auditory information decreased in a dose-dependent manner; however, primary cortical responses to sound were intact; a response was still observable following auditory stimulation under general anesthesia. Plourde et al. [31] observed the same result and found that the cortical areas involved in language and vocabulary were inhibited under anesthesia. Lower-level cortical responses of the auditory cortex were preserved under anesthesia, whereas higher-level cortical responses were absent. There have also been accumulating studies on visual stimulation under anesthesia. Ramani et al. [32] studied visual stimulation under sevoflurane at 0.25 MAC and found that this anesthetic affected the primary visual cortex and certain higher-order association cortices. In studies of brain activation under different stimulation conditions, it has been shown that stimulus- and task-related activity in this state affects not only regional activities but also FC (including interhemispheric connectivity) [33]. Specific brain network configurations are necessary for awareness [34]. Anesthetic drugs preferentially act on higher-order rather than lowerorder connections [35–37]. Peltier et al. [38] found that sevoflurane affected the temporal synchrony of the motor cortex in a dosedependent manner, and a transition from bilateral to unilateral FC was also observed in the network.
《2.2. Positron emission tomography》
2.2. Positron emission tomography
PET is widely used in brain imaging and brain metabolism research. PET exploits the annihilation of negative electrons and emitted positrons from isotope decay, detecting gamma rays generated by annihilation events after compounds labeled with positron-emitting isotopes are injected into the human body. As a result, the distribution of radionuclides in the human body can be traced, enabling three-dimensional tomography. PET is often used to measure changes in regional cerebral metabolic rate (rCMR) and regional cerebral blood flow (rCBF) to reflect changes in brain function. In 1995, Alkire et al. [39] used PET to study human brain metabolism during anesthesia for the first time. Six volunteers underwent two PET scans each, with one scan assessing conscious baseline metabolism, and the other scan assessed metabolism when the volunteers were unresponsive. The whole-brain metabolic rate was found to decrease during anesthesia compared to wakefulness. The decrease in the metabolic rate varied in different brain regions. In the following studies, Alkire et al. [40,41] used PET to study the effects of different drugs on brain metabolism while further studying thalamic metabolism [8] and proposed a thalamocortical connection model. Since then, several studies have been published, for example, Fiset et al. [35] used PET to scan global cerebral blood flow (CBF) and rCBF during propofol anesthesia and found that thalamic metabolism and blood flow during anesthesia decreased with increasing anesthetic concentrations. Synergistic changes between thalamic and midbrain blood flow confirmed the connectivity between these two regions. This result supports the hypothesis that narcotics induce concentrationdependent effects on specific neuronal networks rather than a nonspecific, generalized effect on the brain. Bonhomme et al. [42] also studied the supply of blood to the thalamus and cortex under vibratory stimulation during anesthesia. In the awake state, vibratory stimulation caused an increase in CBF in the left thalamus and parts of the cortex, whereas under propofol anesthesia, changes in the thalamus, parietal lobe, and prefrontal cortex were reduced in a concentration-dependent manner. The effect of propofol on vibratory stimulation first appeared in the somatosensory cortex and then in the thalamic region.
《2.3. Functional near-infrared spectroscopy》
2.3. Functional near-infrared spectroscopy
fNIRS uses near-infrared light to irradiate one or more tissues and collects the reflected light for further analysis. It can measure cerebral hemodynamic response. Compared to fMRI, the advantages of low cost, portability, relatively high temporal resolution, and capability of long-term recording make fNIRS an increasingly popular neuroimaging technique for brain function research in recent years, especially in resting-state brain studies. In contrast to other methods for anesthesia monitoring, near-infrared spectroscopy (NIRS) can monitor changes in circulatory oxygenation in the cerebral cortex, which can reflect tissue oxygen consumption. Owen-Reece et al. [43] compared the hemodynamics between awake and anesthetized patients using NIRS and concluded that NIRS has the potential to distinguish between an awake state and an anesthetized state. Lovell et al. [44] organized 36 healthy patients who were randomly allocated to undergo anesthesia induction with etomidate, propofol, or thiopental. Dosedependent changes in CBF were observed for each anesthetic. Curtin et al. [45] found that changes in oxygenated hemoglobin (HbO2) in the dorsolateral prefrontal cortex were correlated with changes in propofol. Although fNIRS showed a concentrationdependent change in some anesthetics, studies have reported that midazolam, aminophylline, and isoflurane may affect the DOA despite having no effect on oxygen saturation [46]. One of the widespread uses of fNIRS is to detect resting-state FC and describe the topological network of the brain. However, few studies to date have used fNIRS to study FC associated with anesthesia. There is no doubt that these studies offer evidence for the capacity of fNIRS to aid in the assessment of anesthetic depth.
《2.4. Electroencephalography》
2.4. Electroencephalography
EEG has always been essential in neuroimaging studies of the brain in various cognitive/mental states. During anesthesia, the changes in various frequency bands in the EEG are correlated with the concentration of the anesthetic agent. In previous studies of the neural mechanism underlying anesthesia, high-density EEG was commonly used to monitor regional changes in the cerebral cortex under different anesthesia conditions, while single- or dualchannel EEG is mainly used in clinical applications for anesthesia monitoring. In fact, single- or dual-channel EEG and the corresponding calculated indicators have been widely used in clinics. However, it has been found that single-channel EEG has a significant limitation in monitoring anesthesia [47–49]. Given that most of the anesthesia studies were performed using EEG techniques, a detailed review of EEG studies of anesthesia and consciousness is provided in Section 3.
《2.5. Brief summary》
2.5. Brief summary
In summary, the widely used neuroimaging techniques for anesthesia studies include fMRI, PET, fNIRS, and EEG. The characteristics of these techniques are summarized in Table 1. Heuristically, fMRI and fNIRS detect hemodynamic responses related to neuronal behavior, while fNIRS can detect changes in both oxyhemoglobin and deoxyhemoglobin related to neuronal behavior. PET can measure changes in the rCMR and regional CBF, which can also uniquely reflect molecular metabolism. EEG is a general reflection of electrophysiological brain activity. Due to the apparent limitations imposed by the large size of the equipment, PET and fMRI are unsuitable for long-term clinical monitoring, especially during surgery. EEG and fNIRS, however, are more portable and can be combined with other clinical monitoring equipment, giving them great promise for clinical studies.
《Table 1》
Table 1 Characteristics of neuroimaging techniques in anesthesia studies.

《3. EEG studies of anesthesia and consciousness》
3. EEG studies of anesthesia and consciousness
《3.1. Low-density EEG in traditional clinical studies》
3.1. Low-density EEG in traditional clinical studies
The bispectral index (BIS) (Fig. 2) has been used to analyze the frequency and power of EEG signals [50]. The BIS mostly monitors changes in EEG signals in the prefrontal region and results in a normalized index of 0–100. Researchers have compared the MAC and BIS in anesthesia monitoring with a large number of patients and concluded that both are prone to intraoperative awareness in the process of anesthesia monitoring and that there was no substantial difference in this effect across measures [51]. Notably, the BIS in the same state of consciousness tended to decrease with increasing age [52–55]. The BIS also varies greatly with different drugs, which suggests a lack of practicability for accurate monitoring of anesthesia when multiple drugs are used in combination [47–49]. Moreover, there was a significant difference in BIS scores across individuals [56].
《Fig. 2》
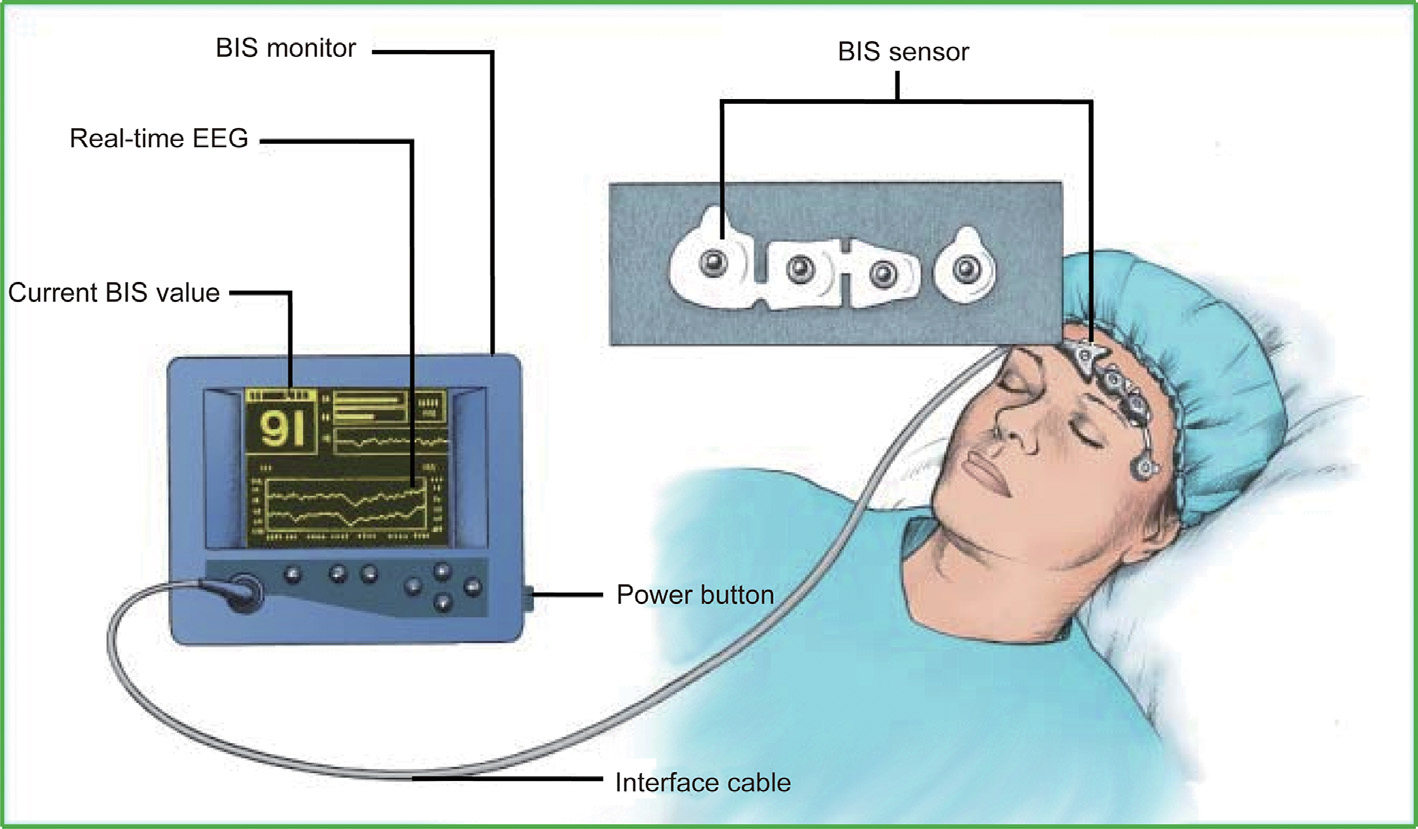
Fig. 2. A sketch of BIS measurement. The BIS sensor includes two channels for measurement and two channels for reference. The BIS is normalized as an index ranging from 0 to 100 for interpretation by anesthesiologists. Reproduced from Ref. [50] with permission of Dove Medical Press, ©2018.
Entropy is an index used to describe signal uncertainty. The main application of entropy in clinical anesthesia monitoring is the assessment of the M-entropy. The shortcoming of M-entropy is similar to that of BIS in that it reflects only part of the regional EEG and differs markedly depending on the drug used. This index loses effectiveness under certain conditions, such as during burst suppression [57,58].
Time-frequency analysis of EEG data can show changes in the EEG frequency spectrum over time. Purdon et al. [59] found that different EEG signal patterns appear under different anesthetics. Particularly, a single anesthesia index may not be suitable when a combination of drugs is used during anesthesia, but the characteristics of different drugs can be distinguished according to the EEG time–frequency map. This result was consistent with the view of Akeju et al. [60,61], who showed that time–frequency analysis of the EEG power spectrum may be a better indicator for anesthesia monitoring [62].
Intraoperative evoked potential (EP) monitoring was first reported in the late 1970s [63]. Auditory evoked potential (AEP) is the electrophysiological activity triggered by a sound stimulus in auditory pathways that reaches the primary auditory cortex via ascending auditory pathways originating from the brain stem. Among AEPs, the middle-latency AEP (MLAEP) shows a dosedependent decrease under most anesthetics; therefore, the MLAEP is particularly suitable as an anesthetic index [64]. Compared with the BIS value, an AEP is a superior reflection of the bistable characteristics of the brain sleep–wake cycle, changing rapidly during the transition from anesthesia to wakefulness [65,66]. However, similar to BIS, AEP shows significant individual differences [67], and recognition of this waveform is complex and vulnerable to external interference [68].
《3.2. High-density EEG in studies of anesthesia mechanisms》
3.2. High-density EEG in studies of anesthesia mechanisms
Given that the anesthesia process involves changes in multiple brain regions, there is a growing research interest in utilizing highdensity EEG to investigate the neural mechanisms of anesthesia, with the ultimate aim of revealing salient and practicable biomarkers for anesthesia monitoring. Moreover, to fully understand the electrical activity during anesthesia, especially in the cortical and subcortical structures, researchers have recruited patients with Parkinson’s disease using electrodes implanted in the brain to observe cortical and subcortical EEG activity under the sole action of either propofol or sevoflurane. They found that consciousness was reflected mainly in the activity of the cortex; however, subcortical structures could better predict the response to a noxious stimulus [21], and intracranial EEG revealed the first signs of recovery from deep anesthesia [69].
Alkire et al. [18] used transcranial magnetic stimulation to stimulate the anterior motor cortex and observed mutual transmission of information between brain regions. They concluded that LOC was related to the ability of the cortex to integrate information. When consciousness disappears, the transfer entropy (TE) between the cortical regions decreases. This phenomenon may be a common mechanism of anesthesia-induced unconsciousness and conforms to the cortical fragmentation theory. Furthermore, researchers have found that LOC is accompanied by a decrease in cortico-cortical connections from the frontal lobe to the parietal lobe [70–72]. The above studies have shown that LOC under anesthesia may be caused by a decrease in the ability to integrate across cortical regions.
Purdon et al. [73] recorded the sound of a mouse click every 4 s as a stimulus. They used high-density EEG (h-EEG) to observe changes in the brain and found that when the propofol concentration was increased, the low-frequency EEG power (< 1 Hz) increased. Meanwhile, the spatial coherence of the occipital alpha oscillation (8–12 Hz) was reduced. However, spatially coherent frontal alpha oscillations increased. Furthermore, the power of the 0.1–1.0 Hz band increased throughout the scalp and forehead, the power of the 8–12 Hz band increased in the forehead, and the power of the 25–35 Hz band mainly increased in the parietal lobe. Huang et al. [74] implanted electrodes into the bilateral anterior cingulate cortex, hypothalamus, periaqueductal gray, and sensory thalamus in patients with chronic pain. The subcortical alpha oscillations increased, whereas subcortical gamma oscillations decreased when the propofol concentration increased. Moreover, subcortical structures also exhibited oscillations similar to those of cortical structures, further indicating that the FC of the alpha oscillation may serve as a marker of consciousness. h-EEG has been widely used to assess brain network changes under anesthesia. It is usually observed that partial rather than overall connectivity is reduced under anesthesia. Propofol has been shown to preferentially reduce FC within the thalamic nuclei in a nonspecific manner. Certain anesthetics can also reduce high-order thalamocortical connectivity [75]. The mechanisms of these brain changes under anesthesia remain to be studied, and high-density EEG may represent a powerful method for such elucidation.
《4. Brain network studies of anesthesia》
4. Brain network studies of anesthesia
《4.1. Brain network and graph theoretical analysis》
4.1. Brain network and graph theoretical analysis
The human brain is highly complex in terms of structure and function. Therefore, investigating the functional and structural mechanisms of the brain may benefit from a systematic perspective. A variety of advanced brain imaging and processing techniques have provided some of the first insights into understanding the structure of the brain. Brain network analysis based on brain imaging technology has made it possible to assess whole-brain function. The human brain can be considered a connectome composed of large-scale networks. Many studies have shown that brain networks play an important role in neural communication, information processing, and integration. The rise of network neuroscience has brought new approaches to the multilevel analysis of the brain, exploring the structure, function, and efficiency of the brain from an integrated perspective, and seeking ways to map, record, analyze, and model the elements and interactions of this neurobiological system [76]. Network neuroscience uses various imaging techniques to obtain important information regarding the brain.
4.1.1. Connectivity analysis
Connectivity is the foundation for building brain networks. It evaluates the relationship between different brain nodes and constructs connections between brain regions as the basic edges of the brain network. A diagram of the EEG brain network construction is shown in Fig. 3 [77]. Heuristically, brain connectivity can be divided into three types: ① structural connectivity, the physical connections between brain regions (typically corresponds to white matter fiber tracts between pairs of brain regions); ② FC, the temporal dependency between the activities of spatially distant brain regions (that is usually estimated from fMRI and EEG data); and ③ effective connectivity, the direct or indirect causal influences of one brain region on another (that has been widely employed in EEG signal analyses) [78,79]. By combining graph theory with connectivity analysis, we can understand changes (both static and dynamic) in the rich topology of the brain, which is critical in the evolution of anesthesia studies. Connectivity methods can be applied not only to original EEG signals but also to broad or narrow bands within the original signals, such as delta (1–4 Hz), theta (4–7 Hz), alpha (8–12 Hz), beta (13–30 Hz), and gamma (30– 100 Hz). In Table 2 [80–98], we provide a brief introduction of several widely used methods for connectivity estimation. A more detailed description of connectivity estimation and their interpretation can be found in reviews of this topic [99–101].
《Fig. 3》

Fig. 3. The construction of an EEG-based brain network. An adjacency matrix (which can describe brain connectivity) was constructed through the relationship (computed by connectivity estimation methods) between the time series at sensor space or the time series at source space after source localization. Source localization is a method to estimate the location, direction, and intensity of the source neural activity in the brain according to the electrical signals measured at the scalp [77].
《Table 2》
Table 2 Methods for connectivity estimation.

N, t, e, j, *, sign(),  , and
, and  share the same meaning across the formulas in this table.
4.1.2. Graph theoretical analysis
In 1736, the Swiss mathematician Leonhard Euler introduced the famous ‘‘Seven Bridges of Konigsberg” problem. This problem introduced graph theory to mathematics as a new branch that has been prosperous ever since. Heuristically, graph theory is a mathematical analysis framework for the quantitative assessment of the topological architecture of a network. A paper published in Nature in 1998 [102] found that the neural network of the nematode Caenorhabditis elegans exhibited characteristics of a smallworld network. This influential paper led to the renaissance of network sine for investigating the topology of a wide variety of complex systems in various areas, including neuroscience, social science, communication, physics, biology, and computer science. In fact, many complex systems show remarkably similar macroscopic behavior, despite profound differences in the microscopic details of the elements of each system or their mechanisms of interaction.
Most recently, graph theory has become an important analytic method for studying complex networks in the field of neuroscience, and it is considered to be an important tool for describing the characteristics of brain networks. Convergent evidence has demonstrated that the brain is a small-world network characterized by a larger cluster coefficient and smaller characteristic path length than a random network. The small-world characteristics of human brain networks indicate that brain networks are organized in a particular pattern to maintain a balance between local segregation and global integration. That is, lower-level information can be processed locally and modularly, whereas higher-level information requires the integration of different functions distributed over the brain.
Here, we provide a brief introduction to several widely used graph theoretical analysis (Table 3). In Fig. 4, we provide a schematic diagram of several representative topological properties in the graph theoretical analysis. A more detailed description of the graph theoretical parameters and their mathematical formulations can be found in the reviews of the topic [103–105]. Open software toolboxes for graph theoretical analysis are available for those who are interested in practice [106–113]. It should be mentioned that the estimation of these network measurements should consider network characteristics (i.e., weighted/binary, directed/undirected) into account. According to the characteristics of the network, different mathematical formulas should be adopted.
《Table 3》
Table 3 Description of topological measures in graph theoretical analysis.

《Fig. 4》
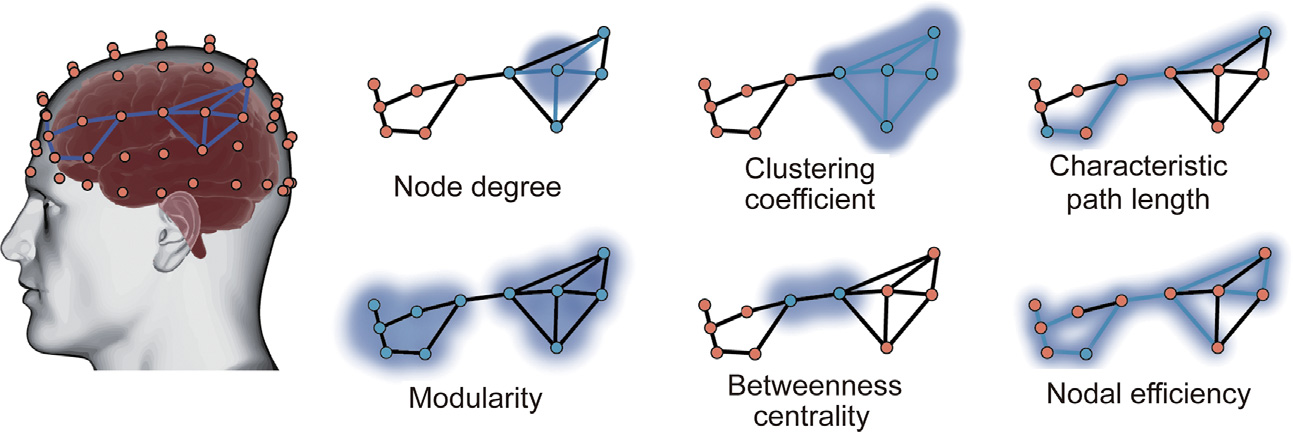
Fig. 4. Schematic diagram of several representative topological properties in graph theoretical analysis. The detailed descriptions and the formulas for graph theoretical analysis estimation were presented in Table 3.
4.1.3. Dynamic functional connectivity analysis
The brain dynamically integrates, coordinates, and responds to internal and external stimuli across multiple time scales, while the static characteristics described above cannot characterize the dynamic characteristics of brain networks. Given the known dynamics and conditional dependence of brain activity [114], it is natural to expect that FC indicators calculated from fMRI or EEG data will change over time, which implies that measures assuming stationarity over a full resting-state scan may be too simplistic to capture the full extent of resting-state activity [115]. In fact, dynamic FC (dFC) analysis is considered to be a more efficient way to uncover specific functional integration properties under various states [116]. Recently, several groups have presented thorough reviews pertaining to the methodological aspects and perspectives of dFC analysis [117–119]. Here, we would briefly introduce the basic concept of dFC analysis; for researchers who are interested in using dFC analysis, they could refer to the reviews.
Unlike static FC analysis, where brain networks were constructed in a fixed window, that is, an FC network was typically estimated during the whole scan period of several minutes in most resting-state fMRI network studies [120], dFC constructed a network in a temporal manner. The most widely used analytical strategy for investigating dFC consists of segmenting the time courses from spatial locations (brain voxels or regions) into a set of temporal windows, inside which their pairwise connectivity is probed, which is called the sliding-window approach. This process divides the entire scan time series into a windowed segment series. Given a sufficient number of data points for robust calculations, any metric that can be applied to the entire scan can, in principle, be used for sliding window analysis. The results of hard clustering (or fuzzy clustering, K-means clustering, principal component analysis, etc.) on dFC estimates can be used to calculate group-wise state measures and conduct statistical analysis. Finally, the temporal properties of dFC states and the topologies of dFC states (modularity, efficiency, etc.) were evaluated [117,119,121]. In Fig. 5, we provide a schematic diagram of the analysis framework for the dFC.
《Fig. 5》

Fig. 5. Schematic diagram of analysis framework for dFC construction and quantitative assessments. Step 1: construct the time-varying functional networks using the sliding window approach; step 2: identify the dFC states using K-means clustering, conduct the statistical analysis; step 3: perform the dFC analysis at global, meso, and local level as needed.
《4.2. Actual anesthesia studies using brain networks》
4.2. Actual anesthesia studies using brain networks
With the development of brain network analytic technologies in the field of neuroscience, an increasing number of scientists have used graph theoretical analysis to investigate state changes of consciousness under anesthesia, coinciding with the current conceptualization of anesthesia: the common cause of anesthesia-induced unconsciousness is persistent inhibition of the lateral frontal lobe or functional disconnection of the cortex [122]. Hence, we focused on brain network studies on anesthesia. Given that most of these studies were performed using EEG and fMRI, we separated the main findings accordingly.
4.2.1. Anesthesia studies using EEG-based brain networks
Among the 152 EEG-based articles (Fig. 1), 98 were published in the last five years. The search results were mixed with articles that were not directly related, such as including other neuroimaging methods, analysis of EEG power spectrum, and brain injury studies. Hence, articles that were not directly related to brain connectivity and network analysis, consciousness, or anesthesia were further excluded through manual verification, leading to the final 33 articles that met the inclusion criteria. Most of the included articles were methodological studies, and a few described indications for clinical applications. After screening these articles, we focused on anesthesia and consciousness research using the EEG brain network approach and selected 27 representative articles (Table 4 [85,123–148]). Based on the different principles of FC analysis, we divided these studies into three categories: spectral-based FC, entropy/complexity-based FC, and dFC.
《Table 4》
Table 4 Summary of EEG network studies on anesthesia in the last five years.
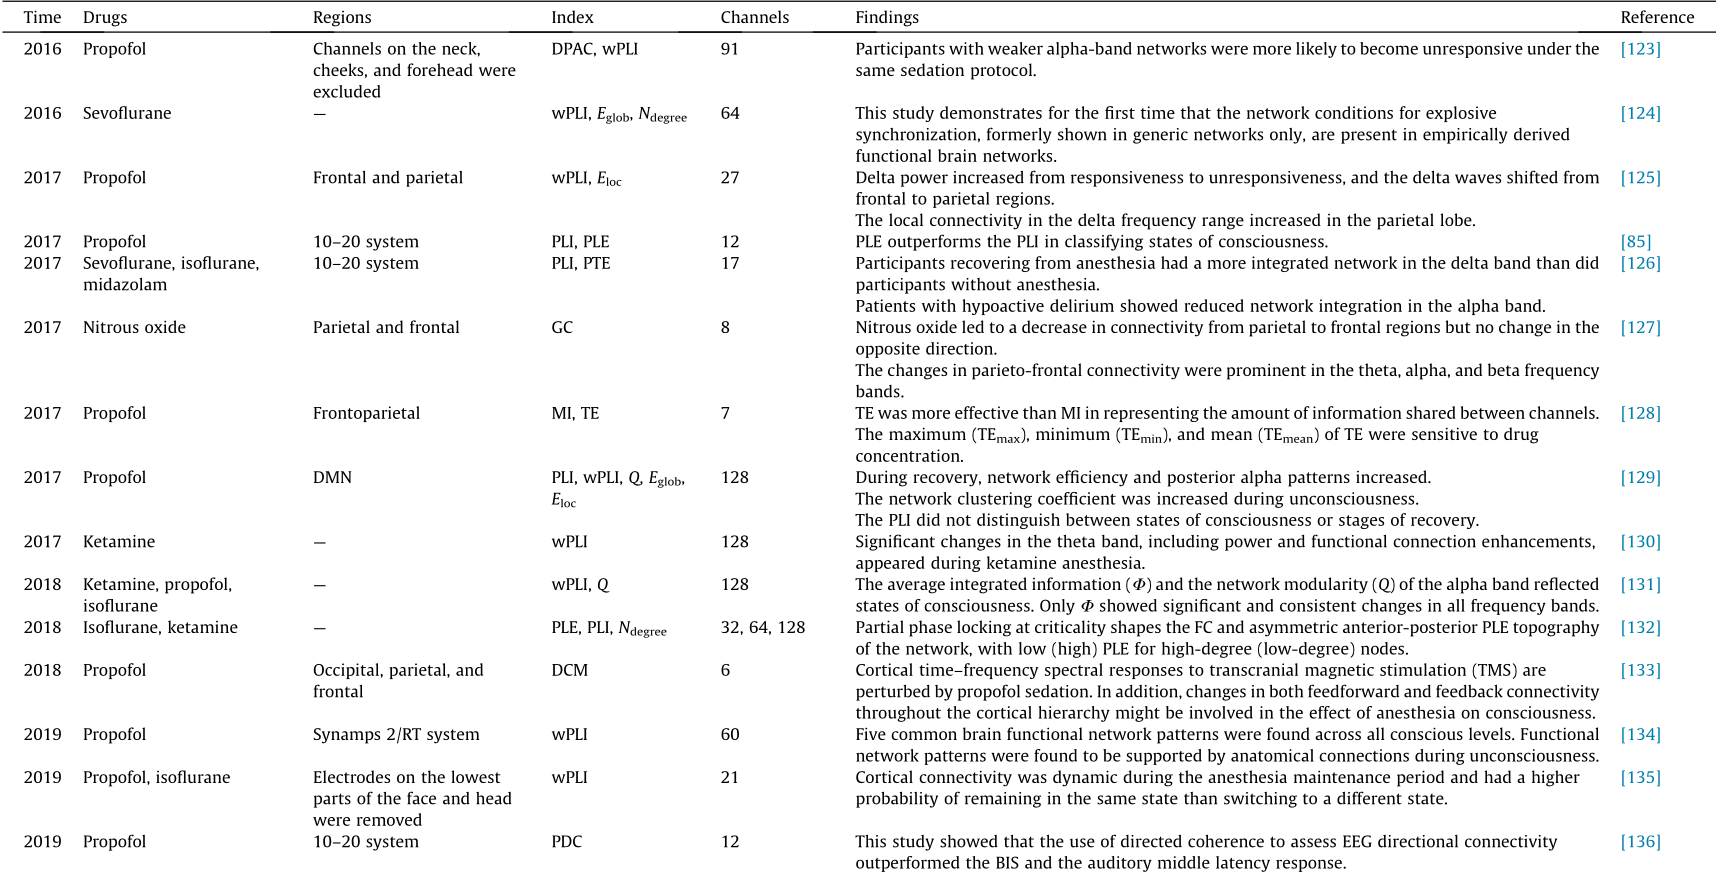


Spectral-based FC: EEG has the advantage of providing spectral information; hence, most of the FC indices were estimated in the spectral domain. Using weighted phase lag index (wPLI) and network analysis, Chennu et al. [123] found that participants with weaker alpha-band networks were more likely to become unresponsive under the same sedation protocol; Kim et al. [124] discussed the functional and topological conditions for explosive synchronization developed in human brain networks, and Lee et al. [125] found that the local connectivity in the delta frequency range increased in the parietal lobe. The wPLI is widely used in functional network studies of anesthesia [130,131,148]. Furthermore, using the basic version of wPLI, Blain-Moraes et al. [129] found that the phase lag index (PLI) did not distinguish between states of consciousness or stages of recovery; Numan et al. [139] reported that the PLI reflected the differences in sedation between midazolam and propofol. Many studies have analyzed coherence and its derivatives [136,137,146]. Furthermore, dynamic casual modeling-based methods, including Granger causality (GC), have been used in anesthesia studies [127,133,144]. As an extension of spectral-based FC at fixed frequency bands, cross-frequency coupling reflects complex interactions between different frequency bands [148–151]. In different tasks, one band of EEG has been shown to modulate other EEG bands [152], and this modulation includes amplitude–amplitude coupling [148], phase–amplitude coupling (PAC) [149–151], and phase–phase coupling [149,150]. This coupling can occur at different frequencies in the same cortex and across different cortical areas [153].
Entropy/complexity-based FC: Entropy and complexity measures of EEG can be used to evaluate information transfer in the cortex. Lee et al. [85] introduced a new metric, phase lag entropy (PLE), to calculate the diversity of time modes of phase relations using the concept of entropy. Unlike traditional phase synchronization methods, which focus on the strength of connectivity, the proposed method reflects whether a given interaction between two signals contains different or fixed connectivity modes. Thus, PLE better reflects the time-varying dynamics of phase relations embedded in neural communication. The results showed that PLE provided better performance in the classification of states of consciousness than did the PLI, a classical time-averaged connectivity method. PLE has been studied further [132,140]. Schreiber [154] proposed an information theoretic measure called TE, which quantifies the statistical coherence between systems evolving over time, which has been widely used in EEG studies to quantify the transfer information between channels. Cha et al. [128] found a high correlation between the TE and the plasma concentration of propofol, which was confirmed from the experimental results of clinical data in 39 subjects. Using normalized symbolic TE (NSTE), a derivative of TE, Zhao et al. [147] found a significant decrease in frontoparietal connectivity during anesthesia, which indicates that disruption of frontoparietal connectivity is a signature of propofolinduced anesthesia. Lobier et al. [91] proposed phase TE (PTE), a new measure of directed connectivity among neuronal oscillations using the concept of entropy, which quantifies the TE between phase time-series extracted from neuronal signals by filtering, for instance. PTE is beginning to be used in anesthesia studies [126] . Moreover, mutual information (MI)-based indices are increasingly being used in anesthesia studies [138,142] .
dFC: Several recent studies using EEG data to conduct dFC analysis have explored dynamic brain network characteristics under anesthesia. Zhang et al. [134] found five common brain functional network patterns across all conscious levels using 60-channel EEG data. Li et al. [135] and Vlisides et al. [155] characterized the dFC patterns via K-means clustering and Markov chain analysis, respectively, and the dFC patterns indicated that a single measure of FC will likely not be a reliable correlate of surgical and experimental anesthesia. The mechanisms of dFC patterns under anesthesia remain to be studied, and compared to fMRI, dFC analysis using EEG with a higher temporal resolution is more suitable for clinical application of anesthesia.
4.2.2. Anesthesia studies using fMRI-based brain networks
Among the 112 fMRI-based articles (Fig. 1), 59 were published in the last five years. After screening these articles, we focused on anesthesia and consciousness research using the fMRI brain network approach and selected 16 representative articles [156–171] introduced below.
Due to the high spatial resolution of fMRI, an increasing number of studies in recent years have used fMRI to investigate anesthesiainduced brain FC. Furthermore, FC analysis of brain activity has become a hallmark of lucidity. In low-consciousness states, FC of the brain reflects its anatomical substrates [156,172]. From a holistic point of view, the overall connectivity of brain networks is significantly reduced during the transition from awakening to anesthesia, especially in the parietal and frontal lobes [173]. Additionally, fMRI can reflect the functional relationship between cortical and subcortical structures and can reveal interactions between different cortical regions. Recent studies have shown that ketamine and other anesthetics can directly disrupt the transmission of information [157], while propofol reduces FC in the frontal cortex [158] and sevoflurane mainly acts on the FC between the cortex and the thalamus [159]. Various anesthetics act on different targets and affect regional connectivity [14]. These differential patterns are related to the electrical activity of the anesthetized cerebral cortex, described by Mukamel et al. [151] as fragmented in time and space, which exhibits an interruption in long-distance cortical communication and a reservation in short-distance cortical communication. In contrast, Wu et al. [160] found that although the local coherence in most brain regions was relatively high, it was reduced by the action of drugs (e.g., medetomidine and metoprolol), and isoflurane resulted in a decrease in local coherence in the cingulate cortex. A research [161] showed that cortical networks are significantly affected by LOC during temporal states of high integration, exhibiting reduced functional diversity and compromised informational capacity, whereas thalamocortical funcTable 4 tional disconnections emerge during states of higher segregation. The posterior regions of the brain’s DMN exhibit spatial reductions in both functional diversity and integration with the rest of the brain during LOC. These studies illustrate drug-specific differences based on the differential targets and effects of each drug on FC. Different anesthetic methods can produce distinctive FC patterns or a typical resting-state fMRI pattern [162], which also indicates that fMRI network connectivity analyses provide characteristic drug information. Moreover, Huang et al. [163] found that the induction and recovery phases of anesthesia may follow asymmetric neural dynamics.
Some studies have analyzed fMRI data from the perspective of whole-brain network features. Standage et al. [164] found that a higher isoflurane dose was associated with an increase in both the number and isolation of whole-brain modules, as well as an increase in the uncoordinated movement of brain regions between these modules. Luppi et al. [165] showed that dynamic states characterized by high brain integration are especially vulnerable to general anesthesia induced by sevoflurane, exhibiting attenuated complexity and diminished small-world characteristics. Furthermore, higher doses of sevoflurane (3% (in volume) and burstsuppression) also compromise the temporal balance of integration and segregation in the human brain. By studying resting-state FC under varying depths of isoflurane-induced anesthesia in nonhuman primates, Areshenkoff et al. [166] found that the apparent brain network fragmentation under anesthesia, rather than reflecting an actual change in network structure, can be simply explained as the result of a global reduction in FC. Vatansever et al. [167] found a persistent modular architecture, yet significant reorganization of brain hubs that formed parts of a wider rich-club collective using resting-state fMRI collected from a group of healthy participants under propofol-induced unconsciousness. The results of the study by Wang et al. [168] demonstrated that the rich-club reorganization in functional brain networks is characterized by the switching of rich-club nodes between the high-order cognitive and sensory and motor networks during propofol-induced alteration of consciousness and natural sleep.
Anesthesia studies using dFC analysis based on EEG are still in its infancy, and some researchers have opened up new horizons for anesthesia research using the dFC analysis based on fMRI. Tsurugizawa and Yoshimaru [169] developed a resting-state fMRI protocol to perform awake and anesthetized functional MRI in mice, which demonstrated a shift from frequent broad connections across the cortex, hypothalamus, and auditory-visual cortex to frequent local connections within the cortex only under light anesthesia compared with the awake state. Yin et al. [170] found a negative correlation between nodal entropy for the distribution of dFC patterns and static FC strength in anesthetized monkeys, but not in awake humans. Ma et al. [156] identified several quasi-stable patterns that dynamically recurred from the awake state into anesthetized states using the sliding window method and K-means clustering. Golkowski et al. [171] conducted a pooled spatial independent component analysis and K-means clustering of resting-state fMRI data obtained from 16 volunteers during propofol and 14 volunteers during sevoflurane general anesthesia, and the results indicated that higher-order brain regions play a crucial role in the generation of specific network patterns.
《5. Discussion》
5. Discussion
In recent years, differences in FC between the states of anesthesia and consciousness have mostly been studied using h-EEG and fMRI. Because of the low time resolution, high cost, and radiation-related risk of PET (although it does have a unique nuclide-tracking ability), it is seldom used in network research examining anesthesia and consciousness. Most research has focused on the overall network configurations under anesthesia and the interactions among specific cortical regions, which opens new research avenues for practical anesthesia monitoring in clinical settings. Based on the methodological concepts of graph theoretical analysis and recent findings in network studies of anesthesia, we summarize several potential ideas worth exploring below: ① the influence of EEG channels on anesthesia monitoring, ② accurate monitoring of different anesthetics, ③ individualized anesthesia monitoring, ④ monitoring the analgesic effects of narcotic drugs under noxious stimulation, and ⑤ combination with fNIRS for multimodal monitoring. We have also suggested methodological considerations and directions for future research.
《5.1. Influence of EEG channels on anesthesia monitoring》
5.1. Influence of EEG channels on anesthesia monitoring
A key question that might hinder the wide application of brain network analysis in clinical practice is the potential optimal scheme for EEG electrodes. More specifically, the potential optimal scheme of EEG electrodes contains the determination of the optimal number and position of the electrodes. Considering the apparent limitations and constraints in clinical settings, it is difficult to maintain a balance between the available data and the convenience of the system for anesthesia monitoring in clinical applications. Interestingly, not all channels are required for reliable anesthesia monitoring. Moreover, in terms of convenience and practicability, an excessive number of electrodes can affect patient wearing in a clinical setting. Generally, information between multiple channels in the same area is redundant. For instance, in most EEG-based network studies of anesthesia (Table 4 [85,123–148]), although high-definition EEG (i.e., 64 and 128 channels) was used for data acquisition, the main observations were obtained based on information from a few specific areas. In fact, the optimal location of electrodes that would capture salient anesthesia-related brain activity deserves further investigation. Nevertheless, the different choices of connectivity analysis methods and network sizes make it difficult to compare the results across different network studies of anesthesia. Through a survey of recent studies [174–176], we summarized the characteristics of EEG with different densities (Table 5). Particularly, the optimal setting of the channel number should take objective into consideration; one should not consider Table 5 as a recommendation. Furthermore, we found that the frontal and parietal lobes contributed the most features [42,70–72,173]. These findings conformed with those of another study [177], wherein thought was considered to be constrained automatically by the DMN and deliberately by the frontoparietal network, and modulation was conducted via the salience network. With the recent advances in machine learning methods, several attempts have been made to select channels with the most prominent features [178,179], which may provide an alternative data-driven approach for optimal channel selection and location determination.
《Table 5》
Table 5 Characteristics of EEG with different densities in anesthesia studies.

The characteristics of different densities are described in relative terms within the technique of EEG, that are independent of other neuroimaging techniques. The numbers of electrodes are summarized according to references [174–176].
《5.2. Monitoring of different anesthetics》
5.2. Monitoring of different anesthetics
One of the main drawbacks of the existing clinical monitoring equipment for anesthesia is its limited feasibility, that is, it is suitable only for some anesthetics. Among the various anesthesia monitoring indicators (including the BIS, AEP, entropy, power spectrum analysis, and cerebral state index), only the BIS has undergone comprehensive, large-sample, and multicenter clinical validation [56]. However, even the BIS, which is widely used in the clinic, is useful only under the action of propofol, sevoflurane, and a few other anesthetics. Moreover, the same BIS value cannot represent the same DOA under different anesthetics, and the effects of drugs also induce considerable differences. Even in the presence of anesthetics, such as nitrous oxide and ketamine, the BIS value increases during the unconscious state. In addition, BIS is affected by many factors, such as opioids and muscle relaxants, which limit the effectiveness of BIS in monitoring the combined use of narcotic drugs. Moreover, it has been shown that intravenous fentanyl (2 μg·kg–1 ) can significantly reduce the dose of general anesthetics needed to achieve LOC, which indicates that fentanyl can synergistically enhance the inhibition of consciousness by general anesthetics [180]. This finding makes the accurate monitoring of anesthesia impractical via dosage assessment of anesthetics. Moreover, the use of opioids brings great uncertainty to the current clinical anesthesia monitoring. In fact, the modern anesthesia process generally comprises a combination of multiple anesthetics. Currently, there are no clinical indicators that can comprehensively and accurately reflect brain states under different anesthetics. We believe that the development of new methods for accurate anesthesia would be significantly beneficial for a better understanding of the underlying neural mechanisms. For instance, Kim et al. [131] and Kim and Lee [181] proposed a method that estimates the degree of integration of brain information under anesthesia to distinguish different states under anesthesia. They compared changes in brain information integration during anesthesia with different anesthetics, such as ketamine, propofol, and isoflurane, and found that this method could help identify the state of consciousness, thereby providing clinical evidence to show the superiority of network methods in anesthesia monitoring with different anesthetics. In fact, the forehead or a single brain area signal acquisition approach employed in most traditional anesthesia monitoring methods limits the ability to effectively monitor the effects of ketamine. Studies have shown that ketamine and other anesthetics can directly disrupt information transmission between distinct cortical areas [85]. EEG changes in different brain regions may occur under the actions of a variety of drugs, accompanied by alterations in information transfer and changes in brain synergy. The use of EEG network analysis is therefore expected, which may provide novel indicators to improve practical anesthesia monitoring under conditions with complex anesthetics.
《5.3. Individualized anesthesia monitoring》
5.3. Individualized anesthesia monitoring
Another major drawback of the existing anesthesia monitoring system is the lack of sensitivity to account for individual differences in anesthesia monitoring. Heuristically, individual differences may result from considerable differences in drug sensitivities (or responses) among people of the same age, weight, sex, and other basic conditions. Although the anesthesia and operation times are almost the same under conditions of the same age and physical condition, there are obvious differences in the DOA or the recovery time of patients post operation [123]. Particularly, using the same amount of anesthetics, some patients may regain consciousness during the operation, while others may regain consciousness immediately after the operation, with some patients awake even hours after the operation. To aid clinicians in understanding the state of anesthesia, most indicators (including BIS, M-entropy, and AEP) quantify the DOA to 0–100 intuitive values. This numerical value makes it convenient for clinicians to judge the anesthesia status. Nevertheless, there is evidence to show that the incidence of intraoperative awareness increases with the use of BIS for DOA monitoring [182]. This finding reiterates the need to account for individual differences in interpreting BIS values. Otherwise, some patients would experience intraoperative awareness because of inadequacies. While simplifying clinical monitoring, existing anesthesia monitoring ignores the rich information from the whole brain during anesthesia. Therefore, it is difficult to describe the complex process of anesthesia using simple parameters. Recently, Chennu et al. [123] found that monitoring of the brain and consciousness in the clinic was influenced by different individual sensitivities to anesthetics. To solve this problem, they combined the evaluation of h-EEG spectrum connection networks before, during, and after propofol anesthesia with the measurement of blood drug concentrations. They found that participants were more sensitive to drugs when they had a weak alpha-band network without an anesthesia baseline, despite similar levels of blood drug concentrations. According to this study, it is possible for brain networks to predict individual susceptibility to propofol in clinical settings. If this can be applied to the clinic, it may resolve issues regarding individual differences that have confounded anesthesia monitoring over the years.
《5.4. Monitoring the analgesic effects of narcotic drugs under noxious stimulation》
5.4. Monitoring the analgesic effects of narcotic drugs under noxious stimulation
Unlike consciousness studies, general anesthesia in the clinic consists of three factors: sedation, analgesia, and muscle relaxation. When all three factors are in line during general anesthesia, they are indicative of optimal anesthesia. Current clinical anesthesia monitoring is adequate for evaluating the depth of sedation for muscle relaxation, but the evaluation of the DOA on analgesia requires further improvement. Analgesic monitoring under anesthesia is not the same as in traditional pain research. Pain is based on consciousness, and human pain involves subjective feelings. When patients lose consciousness during general anesthesia, pain mainly manifests as a stress response to a noxious stimulus and a series of simultaneous physiological reactions. This type of stress response to a noxious stimulus is usually monitored by hemodynamic parameters, such as blood pressure and heart rate, as well as by eye pupil movement, breathing, sweating, and other indicators. The most obvious method is to observe the physical responses after noxious stimuli are delivered. However, these indices have great individual differences, and their specificities are not strong. Because EEG signals have good temporal specificity and can extract signals with different spectral characteristics, EEG may have great potential in assessing the effects of anesthesia on analgesia. Noxious stimulation has been shown to alter subcortical activity, while the BIS index reflects the electrical activity of the cerebral cortex; hence, the BIS cannot monitor the levels of analgesia and stress [183]. However, other studies have shown that noxious stimuli have an activating effect on the cerebral cortex [184,185]. Cumulatively, the evidence suggests that the physiological basis of the cortical EEG response to noxious stimuli during general anesthesia is complex. Most current anesthesia/analgesia monitoring methods are multimodal to characterize complex brain responses to noxious stimuli. For example, the qNOX index [186] takes different EEG frequency band data and electromyography (EMG) data as inputs into a fuzzy inference neural network, which is trained to return a composite index ranging from 0 to 99 to describe a noxious stimulus by referring to the body movement stimulated by laryngeal mask intubation. Because of the introduction of the EMG signal, qNOX will be affected when neuromuscular blocking agents are used. For monitoring responses to noxious stimuli, rich information within high-density EEG data has great potential. For instance, Hartley et al. [187] proposed and validated an EEG-based monitoring method for infant noxious stimulation. Using principal component analysis to analyze the time window of interest and defined the EEG template induced by noxious stimulation, they statistically compared the multichannel EEG patterns with the control group. Specifically, a t-test was used to calculate each electrode at each time point, indicating significant differences in brain activity induced by noxious and non-noxious stimuli. When the t statistic was higher than the 97.5% threshold, only eight electrodes were recorded, where the Cz electrode had the most significant activity. Notably, Hartley et al. [187] aimed to solve the problem in which babies cannot express their pain to doctors, which is similar to the conditions of anesthetized patients being unable to verbally report pain.
《5.5. Combination with fNIRS for multimodal monitoring》
5.5. Combination with fNIRS for multimodal monitoring
As we have briefly introduced in Section 2, fNIRS can measure the changes in the parameters related to tissue oxygenation and hemoglobin (Hb) and indirectly measure the effect of blood–nerve activity on hemodynamics and oxygen consumption. These characteristics may compliment the single-modal electrophysiological monitoring. It is noteworthy that both EEG and fNIRS signals were recorded to estimate the most widely used BIS. The feasibility of using single-modal fNIRS as an alternative method for anesthesia classification in clinical practice has already been assessed. For instance, Hernandez et al. [188,189] placed a single-channel fNIRS probe on the right side of the forehead and found that there were significant differences in HbO2 and Hb between the patients in the maintenance and recovery period. From the maintenance period to the recovery period, HbO2 and total Hb levels decreased significantly. Then, they used fNIRS-related indicators as features to train a support vector machine (SVM) classifier. Compared to BIS and MAC, the SVM classifier achieved higher sensitivity and specificity. More importantly, they found that the proposed fNIRS–SVM approach could identify patients’ awakening earlier before movement. Moreover, the application of multichannel fNIRS may further improve the monitoring of cerebral hemodynamic changes during anesthesia. Liang et al. [190] designed a multichannel fNIRS system specifically for anesthesia and proved its effectiveness for monitoring the DOA. More recently, multimodal EEG–fNIRS has begun to show its feasibility for anesthesia and/or consciousness monitoring. In a recent study, Yeom et al. [191] used EEG–fNIRS to investigate the electrical and hemodynamic responses during sedation using midazolam and propofol. A gradual increase in EEG power at low frequencies (< 15 Hz) at the frontal and parieto-occipital areas and decreasing EEG power at high frequencies (> 15 Hz) were revealed when consciousness was lost, while the spatio–temporal changes were reserved during the recovery of consciousness (ROC) from unconsciousness. These spatio–temporal EEG patterns were independent of the sedatives used. Moreover, sudden phase shifts in fronto-parietal connectivity at the LOC and ROC, together with mild hemodynamic fluctuations, were also observed. It is noteworthy that although both EEG and fNIRS were identified to be relevant to clinical applications, few studies to date have used fNIRS to study the FC and brain network associated with anesthesia (Fig. 1). In contrast, EEG-based FC and network studies have matured; simultaneously, EEG-based anesthesia monitoring has been widely used in clinical practice. Considering that the brain network plays a pivotal role in the studies of anesthesia, we posit that the fNIRS-based brain network may be a future trend for studies of anesthesia, which may serve as a complementary method to provide comprehensive information for anesthesia monitoring. Given that multimodal EEG–fNIRS inherits the advantages of both techniques, including insusceptibility to electromagnetic interference and convenience for wearing of fNIRS, as well as high temporal resolution and flexible configuration of EEG, we believe that EEG–fNIRS combined with advanced brain network analysis would be a promising method for the development of next-generation anesthesia monitoring systems.
《5.6. Methodological consideration and future directions》
5.6. Methodological consideration and future directions
In the past decade, research on brain network studies on anesthesia and consciousness has been gaining momentum, which has not only significantly improved our understanding of the complex neural mechanisms underlying anesthesia and consciousness, but also demonstrated great promise in the application of brain networks in various clinical applications. Here, we propose two main future research directions that deserve attention to promote the development of a practical method for accurate and convenient anesthesia monitoring.
EEGs are known to be susceptible to external disturbances. Existing EEG analysis techniques to solve the nonstationary characteristics of EEG and various physiological artifacts (e.g., eye blink, muscle activity, heartbeat, etc.) in a nonclinical environment have gradually become mature [192,193]. However, the complex environment of clinical surgery and requirements for real-time anesthesia monitoring present a great challenge to EEG artifact removal. High electromyographic activity and electric device interference can cause a spuriously increased BIS value [194]. Furthermore, there are few automated methods for removing electromyographic artifacts in real-time monitoring systems. For instance, García-Cossio et al. [195] discomposed EEG into components using canonical correlation analysis to remove electromyographic components. Nevertheless, advances in EEG artifact removal would still be an important research direction in the future. Moreover, the network analysis approach for most EEG network studies of anesthesia was a static network, which did not show the advantage of EEG in terms of high temporal resolution. Specifically, current techniques for measuring the connectivity between neurophysiological signals do not adequately explain the temporal dynamics of synchronous patterns. For instance, phase synchronization methods, including phase lag [81], and phase locking [84], assume stationarity during the measurement process, and the phase synchronization value is estimated by averaging the phase differences over a period of several seconds, thereby ignoring the temporal dynamics within the window. Moreover, the model-based methods (i.e., GC, partial directed coherence (PDC), directed transfer function (DTF), etc.) require a certain length of time series for model construction [144]. There is also no widely accepted method to estimate the PAC [97], in which current methods have relatively poor sensitivity and require long segments of experimental data. Recently, methods based on information theory have attracted considerable attention. Lee et al. [85] introduced PLE, which calculates the diversity of the temporal patterns of the phase relationship. In contrast to the typical methods of phase synchronization, in which the strength of connectivity is of interest, the proposed measure reflects whether a given interaction between two signals consists of diverse or stereotypic connectivity patterns. Thus, PLE better reflects the time-varying dynamics of phase relationships. Samiee and Baillet [196] proposed the time-resolved PAC to estimate the dynamic PAC that can resolve up to one, optimally two cycles of the underlying low-frequency component. As discussed above, high time resolution FC estimation methods have been adopted in anesthesia studies. What needs to be explained is the application of the dFC framework to EEG studies of anesthesia. First, the sliding window technique used in several recent studies [135,155] has some apparent limitations. Conversely, the choice of window length has always been controversial, given that too short a window length increases the risk of introducing spurious fluctuations in the observed dFC, while a window length that is too long would impede the detection of the temporal variations of interest [119]. However, current studies have limitations originating from the use of a typical rectangular window that might increase the sensitivity to outliers in the detection of dFC, as the inclusion/exclusion of instantaneous noisy observations would appear as a sudden change in the dFC time-course [197]. Window optimization approaches adopted in many studies [198–200] should be considered to eliminate the risk of a rectangular window. Second, dynamic graph analysis is a popular avenue for extracting brain network information from the dFC. Conversely, existing anesthesia research has focused on the transition process of brain states and has lost insight into the continuous functional reorganization of the brain with respect to different network features. Furthermore, the application of dFC state extraction (i.e., through K-means clustering) for anesthesia monitoring is debatable, given that the state extraction process requires long-time signal sampling. Although dFC analysis has been widely applied in the diagnosis of schizophrenia [201], autism [202], and mild cognitive impairment [203], the high time resolution requirement of real-time monitoring of anesthesia will be a great challenge for the application of dFC. Given that accumulating evidence has suggested that brain networks are dynamically connected, dynamic EEG connectivity analysis that characterizes spontaneous changes in network-level communication on a fine time scale and the corresponding temporal network measures are increasingly needed to unpack the complex neural mechanisms of anesthesia.
Recently, machine learning methods have been widely developed and utilized in the field of brain disease diagnosis. In this work, we limited our primary focus to the studies of consciousness evaluation and did not elaborate on the applications of machine learning in disease diagnosis. For researchers who are interested in using machine learning to diagnose brain diseases, they could refer to the reviews [204–206] and original articles [207–210]. In the field of consciousness evaluation under anesthesia, machine learning methods have been used to discriminate between awake and anesthetized patients in the early 1990s [211,212]. As anesthesia depth indices such as BIS have become increasingly popular, neural networks and other machine learning methods have been used to analyze EEG data to approximate BIS using other EEG characteristics [213]. Recent studies have used artificial intelligence techniques and spectrum analysis to directly analyze EEG signals to estimate the DOA and compared the accuracy of the quadratic discriminant analysis to analyze the EEG power in different frequency bands [214]. For instance, Shalbaf et al. [215] put a combination of features (including beta-index, sample entropy, Shannon permutation entropy, etc.) to a new neurofuzzy classification algorithm, an adaptive neurofuzzy inference system with linguistic hedges, and obtained 92% accuracy. Hashimoto et al. [216] identified and summarized several themes of artificial intelligence applications in anesthesiology and reviewed the application of machine learning to the DOA monitoring, in which over 40 papers related to EEG and machine learning research on anesthesia monitoring were found. Recently, machine learning analysis of EEG connectivity features has been used for anesthesia monitoring. For instance, Lioi et al. [136] used directed coherence as a feature to identify the DOA and compared its performance with that of the conventional BIS index and the auditory middle latency response. They found a superior performance in discriminating wakefulness from anesthesia (i.e., accuracy = 95%) of machine learning analysis of FC features. Using 128-channel EEG recording, Duclos et al. [148] compared an envelope-based measure (i.e., amplitude envelope correlation (AEC)) and a phase-based measure (i.e., wPLI) of FC to classify states of consciousness, in which a machine learning pipeline implemented using scikit-learn in Python was used for classification. The results showed that AEC showed higher overall classification accuracy, particularly for distinguishing anestheticinduced unconsciousness from baseline (83.7%). It is noteworthy that the combination of machine learning and brain networks for consciousness and anesthesia monitoring is still in its infancy, and novel methods/techniques could be adopted from studies in relevant fields, including disease classification and cognitive state monitoring. In a recent study, Gao et al. [217] reviewed the application of complex networks and deep learning for EEG signal analysis, covering a wide range of applications, including brain– computer interfaces, neurological disorders, and cognitive analysis.
Heuristically, it is necessary to label anesthetic EEG data according to the state of consciousness prior to applying supervised machine learning techniques to anesthesia monitoring. Evaluating the state of consciousness under anesthesia currently relies on subjective scores (i.e., RSS, MAAS, and SAS), which are based on the patient’s unresponsiveness to external disturbances [25–27]. Nevertheless, consciousness is a subjective experience that is not necessarily coupled with connectedness or spontaneous responsiveness during anesthesia [24]. We are usually conscious, connected to our environment, and react to it when we are awake. When we fall asleep, our ability to react and connect to our environment decreases, but it is only during early non-rapid eye movement (NREM) sleep (rich in slow-wave activity) that we become unconscious. Consciousness emerges during NREM sleep at night and comes alive during dreams in rapid eye movement sleep, although we remain disconnected from and largely unresponsive to our environment [24]. Unresponsiveness is not equivalent to unconsciousness under anesthesia, which provides the ideal objective of anesthesia sedation: inferring the underlying consciousness level. Alternatively, although the temporal and spectral features generated by current anesthesia monitoring equipment correlate well with the delivered anesthetic concentration, they provide limited insight into the cerebral mechanisms underlying anesthetic unconsciousness [218]. As discussed in Section 1.1, the potential of brain connectivity and network analysis quantifies the global organized behavior of neural circuits and provides insight into the neural mechanisms underlying LOC under anesthesia, which might become the gold standard for evaluating the underlying consciousness level under anesthesia. This leads us to conclude that the brain network plays an irreplaceable role in consciousness level recognition under anesthesia compared with spectral analysis. Combining machine learning with complex networks may be a valuable research direction. The fusion of interpretable features from brain networks and advanced data-driven methods would help open up new avenues for identifying underlying consciousness states under anesthesia.
《6. Conclusions》
6. Conclusions
Research on anesthesia and consciousness has long been an essential topic in neuroscience. Despite various hypotheses, there is no valid theory to date that is widely accepted. Researchers are committed to using a variety of methods to study the state transfer of brain consciousness under anesthesia. Obviously, the anesthesia process is not solely caused by the suppression of a single brain region. Whole-brain monitoring methods provide rich information, and the analysis of network architecture provides some of the first quantitative insights into the complex neural mechanisms of anesthesia. To date, most clinical indicators and monitoring systems are based on single- or dual-channel EEG to assess the level of consciousness. Nonetheless, accumulating studies have reported that such a configuration would lead to an inaccurate prediction of the DOA. The development of new technologies that are convenient to use in the operating room can provide accurate and objective monitoring of anesthesia. Beginning with a brief introduction of the nascent technique of the brain connectome, this review summarizes recent network studies on anesthesia and consciousness. Moreover, we have identified potential research directions to extend the current studies with regard to embracing new technologies (including machine learning and multimodal neuroimaging). We believe that incorporating network analysis with a portable EEG system will lead to a promising solution for accurate anesthesia monitoring in clinical applications.
《Acknowledgments》
Acknowledgments
This work was supported by the Zhejiang Provincial Natural Science Foundation of China (LGF19H090023), the National Natural Science Foundation of China (81801785 and 82172056), the National Key Research and Development Program of China (2019YFC1711800), and the Key Research and Development Program of Shanxi (2020ZDLSF04-03). This work was partly supported by the grants from the Zhejiang Lab (2019KE0AD01 and 2021KE0AB04), the Zhejiang University Global Partnership Fund (100000-11320), the Shanghai Municipal Science and Technology Major Project (2021SHZDZX0100), and the Fundamental Research Funds for the Central Universities.
《Compliance with ethics guidelines》
Compliance with ethics guidelines
Jun Liu, Kangli Dong, Yi Sun, Ioannis Kakkos, Fan Huang, Guozheng Wang, Peng Qi, Xing Chen, Delin Zhang, Anastasios Bezerianos, and Yu Sun declare that they have no conflict of interest or financial conflicts to disclose.


 京公网安备 11010502051620号


