

《1. Introduction》
1. Introduction
X-ray diffraction (XRD) is the most common method for crystal structure determination. When an X-ray beam interacts with a crystalline material, diffraction occurs if Bragg’s equation is satisfied [1]:

where  is the wavelength of the incident X-ray beam, d is the spacing between the diffracting crystal planes (hkl), and θ is the angle between the incident beam and the normal of the entrance surface (i.e., the angle of diffraction is 2θ). Eq. (1) sets the foundation for an analysis of crystal structure and lattice constants.
In recent years, a great deal of attention has been paid to the signal enhancement of XRD experiments. Firstly, high-throughput material fabrication technology such as a combinatorial materials chip can integrate hundreds or more samples onto a single substrate [2,3]. To fully materialize the benefits of this technology, it is necessary to have a rapid XRD technique with an adequate signal-to-noise (S/N) ratio for micro-area thin-film samples so that the measurement speed of a material chip can match that of the sample preparation [4,5]. Secondly, the in situ characterization of the material dynamic process of phase change or phase formation in real time requires XRD with a microsecond or faster timescale [6,7]. Moreover, there is a demand for an ever-increasing XRD detection limit to accommodate the characterization of micro- or nano-sized samples and embryos of crystals. In these scenarios, synchrotron radiation light sources are often used due to their high photon flux.
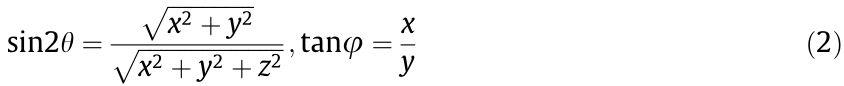
Powder diffraction is primarily conducted in two forms. Angleresolved X-ray diffraction (ARXRD), as depicted in Fig. 1(a), uses a single wavelength incident beam to generate a series of diffraction cones, each of which corresponds to one of the crystal planes satisfying Eq. (1). When a single-point X-ray detector is used, a scan across a range of 2θ angles is required to collect a full diffraction pattern of the material. To speed up the process, a twodimensional (2D) detector array has been used in ARXRD experiments (referred to as 2D-ARXRD) [4,5] to cover a wide range of diffraction angles simultaneously. Thus, point-to-point mechanical scanning is no longer necessary. Furthermore, when the 2D detector is large enough to cover the whole circle or a substantial part of the diffraction rings (with the same 2θ), the intensity is significantly enhanced over the single-point detector, as the signal is an integration along each Debye ring over the azimuth angle (φ). The relationship between detector coordinates (x, y, z) and angle (2θ – φ) is given in Eq. (2):
The combination of these two factors has improved the measurement speed by a few thousand times [4,5].
In the energy-dispersive X-ray diffraction (EDXRD) [8–10] approach, a continuous wavelength X-ray source is used to generate diffraction signals, as shown in Fig. 1(b). Consider an incident beam of white X-rays with an energy range [Emin, Emax]; a photon with maximum energy Emax produces diffraction at the lowest angle  for a given (hkl) plane with d-spacing dhkl , and a photon with minimum energy Emin produces diffraction at the highest angle
  . Therefore, all diffraction signals from the lattice plane (hkl) are enveloped in the space between the two extremity cones. EDXRD has the advantage of utilizing the full spectrum of the X-ray source. If a single-point energy-dispersive detector with an active area Sp (shown as the red dot in Fig. 1(b)) is placed at a fixed position in space, a complete diffraction pattern as a function of energy (or wavelength) is collected simultaneously at a constant diffraction angle, with no need for an angular scan [6,7]. In addition to the benefit of energy integration of the diffraction signal, the Xray fluorescence (XRF) signal is included in the EDXRD spectrum [11], which allows composition and structural data to be acquired on the same spot at the same time.
《Fig. 1》
Fig. 1. Schematics of (a) ARXRD with a single-point detector scanner and a 2D detector array (2D-ARXRD); (b) EDXRD with a single-point energy-dispersive detector and a 2D energy-dispersive detector array (2D-EDXRD).
The EDXRD signal can be further enhanced using improved detector coverage. Drakopoulos et al. [12] were able to multiply the signal by setting up multiple single-point energy-dispersive detectors along a small portion of the cone (with the same diffraction angle of 2θ (zenith angle) but a different azimuth angle φ, in what is referred to as one-dimensional (1D)-EDXRD). When a 2D energy-dispersive detector array containing N pixels is used (referred to as 2D-EDXRD), as shown in Fig. 1(b), it is possible to integrate the energy-dispersed diffraction photons along both the θ and φ angles. To a first-order approximation, the collected diffraction signal from the (hkl) plane is proportional to the solid angle coverage by the detector, and the signal is enhanced by a factor of N over a single-point detector. O’Flynn et al. [13,14] employed an 80 × 80 pixelated 2D energy-dispersive detector array called HEXITEC in a 2D-EDXRD setup. However, since the HEXITEC detector is limited to an energy resolution of about 800 eV (1 eV = 1.602176 × 10⁻¹⁹ J), this setup is only adequate for the quick discrimination of known substances. For a technique aimed at identifying unknown material structures, a much higher energy resolution is required for the energy-dispersive detector.
Portable devices have been developed for the in situ or in-field analysis of various art and archeological samples [15,16]. Among these, a 1024 × 256 pixels Peltier-cooled energy-dispersive charge-coupled device (CCD) 2D detector with an energy resolution of 230 eV is employed for the combined detection of XRD and XRF signals. Satisfactory results have been demonstrated when identifying paint pigments using this device. However, the acquisition time is 100–600 s due to the limited power of the X-ray tube [11], which is far from meeting the demand for high-throughput analysis for materials. One possible way to overcome this problem is to make use of a synchrotron radiation light source that generates X-rays with high flux.
Table 1 summarizes the characteristics of the five abovementioned diffraction setups in relation to measurement speed. In principle, all EDXRD techniques integrate the signal in wavelength, which is one more dimension than the spatial dimensions of the detector, whereas the corresponding ARXRD techniques only integrate within the spatial dimensions of the detector. For example, 2D-EDXRD is able to integrate signals in both directions, as well as in wavelength, and is therefore perceived as a good candidate for a high-throughput characterization technique.
《Table 1》
Table 1 Characteristics of XRD methods.

In this paper, we demonstrate the effectiveness of 2D-EDXRD as a high-throughput material characterization technique for targeting unknown structure identification based on a synchrotron bending magnet X-ray source. Since a 2D energy-dispersive detector array with a sufficient energy resolution is not commercially available at the present time, we simulate an 88-pixel 2D detector array by moving a single-point silicon-drift detector (SDD) in an (11 × 8)-point grid in space (Fig. 1(b)). The energy resolution of the SDD is about 125 eV at 5.9 keV [17], which is sufficient for phase identification. Our results show that the diffraction signal generated by a white X-ray beam over monochromic light under the experimental conditions is estimated to be about 104 times higher. Furthermore, by using the 2D detector array, XRD and XRF data can be obtained simultaneously, and the signal strength for both applications can be enhanced in proportion to the pixel numbers. Subsequently, the S/N ratio is also significantly improved, which makes the data quality adequate for rapid materials phase identification. Moreover, it is possible for EDXRD to achieve the same or even a smaller full width at half maximum (FWHM) as ARXRD.
《2. Experiments》
2. Experiments
The CeO2 powder sample was constructed with a thin layer of powder wrapped with magic tape and then sandwiched between two glass slides. The powder is of 99.99% purity (Aladdin Company, China), packed into a sample with a thickness of 35 μm and an effective density of about 1.66 g∙cm-3 . The experimental apparatus was set up at the bending magnet beamline BL14B1 in the Shanghai Synchrotron Radiation Facility (SSRF). The synchrotron operates at an electron energy of 3.5 GeV and a current of 300 mA. The divergence of the X-ray beam on the sample is 93.24 μrad (x axis) and 1.583 μrad (y axis).
The EDXRD experiment was carried out in transmission mode. A white X-ray beam of energy with a range from 4 to 26 keV (wavelength  = 3.0996–0.4769 Å) came out of a beryllium (Be) window about 400 mm away from the sample. The beam was narrowed down to 1 μm 1 μm through a slit. An Amptek X-123 FAST SDD® detector with an energy resolution of 125 eV at 5.9 keV was installed on a three-dimensional (3D) translational stage on the other side of the sample. The detector-to-sample distance was 609 mm, making a 2θ angle of 28.2°. The detector surface was oriented normal to the line between the detector center and the sample. The detection area was 17 mm2 (4.6 mm in diameter), corresponding to an angle span of 0.433°. The detector was calibrated by the fluorescence peaks of molybdenum (Mo), selenium (Se), and nickel (Ni) and by monochromatic light energy at 8.00, 10.00, 12.00, 14.00, and 16.00 keV to establish a one-on-one relationship between the X-ray energy and the index of the SDD channels. The data acquisition time was 40 s for each position.
In the subsequent 2D-EDXRD experiment, the same sample, white X-ray beam, SDD, and acquisition time were used. The 2D energy-dispersive detector array was simulated by moving the detector around the EDXRD experiment position in 10 mm steps in both the x and y directions. Measurements were taken at 11 × 8 positions to form a virtual 88-pixel 2D detector array, as shown in Fig. 1(b), in order to cover part of the upper-right quadrant of the diffraction band (2θ ranged from 22.6° to 34.4°) with a total solid angle of 0.004 sr, which is 88 times greater than that of a singlepoint detector. During the measurement, the SDD orientation remained unchanged.
For comparison purposes, a 2D-ARXRD experiment was also conducted in transmission mode on the same sample and stage. The same white X-ray beam was turned into a monochromatic beam using a silicon (Si) (111) double-crystal monochromator (DCM) with a photon efficiency of 13.3% (at 0.1% bandwidth) at 20 keV, calculated by the OASYS software [18]. The 20 keV energy monochromatic X-ray beam ( = 0.6199 Å) was focused to a spot size of 400 μm × 200 μm. The beam was finally narrowed down to 2 μm × 2 μm through a slit before being illuminated onto the sample. A Mar345 plate detector (marXperts GmbH, Germany) with an active area of 345 mm in diameter and a 150 μm × 150 μm pixel dimension (corresponding to an angle span of roughly 0.086°, which is about 1/5 of that of the energy-dispersive detector) was placed about 100 mm behind the sample perpendicular to the beam, covering diffraction angle 2θ from 10° to 40°. The data acquisition time was 40 s.
《3. Results and analysis》
3. Results and analysis
《3.1. Energy-dispersive X-ray diffraction》
3.1. Energy-dispersive X-ray diffraction
Fig. 2(a) shows the diffraction spectrum collected by a singlepoint energy-dispersive detector at a diffraction angle of 2θ = 28.2°, including a series of sharp peaks and a broad background. Multi-peak fitting is performed using the data analysis and graphing software Igor Pro (WaveMetrics, Inc., USA), with a Gaussian function for the sharp peaks (black dots) and a log-normal function for the background (blue line). The background function is fitted as
with the fitting parameters w = {47.08, 673.99, 11.115, 0.37665}. The sharp peaks are fitted as the function

with the parameters listed in Table 2 for each peak. It was found that both the fluorescence and diffraction signals were collected simultaneously, which could be used for the analysis of the composition and structure of the same material. Among the angleindependent peaks shown in Fig. 2(a), five fluorescence peaks below 8 keV correspond to the cerium (Ce) element in the sample [19], with energy at Lα1 = 4.823 keV, Lβ1 = 5.262 keV, Lβ2 = 5.613 keV, and  = 6.052 keV, respectively; the two other peaks at 10.551 and 12.614 keV match the lead (Pb) element Lα1 and Lβ1 [19], respectively. The Pb element comes from the collimator in front of the SDD, rather than from the sample.
《Fig. 2》

Fig. 2. (a) EDXRD spectra with and without background at the diffraction angle 2θ = 28.2° (a.u.: arbitrary unit); (b) EDXRD data collected by the simulated 88-pixel energy-dispersive detector array, with the background subtracted.
《Table 2》
Table 2 Fitting parameters for the Gaussian peaks in the EDXRD spectrum at 2θ = 28.2°.
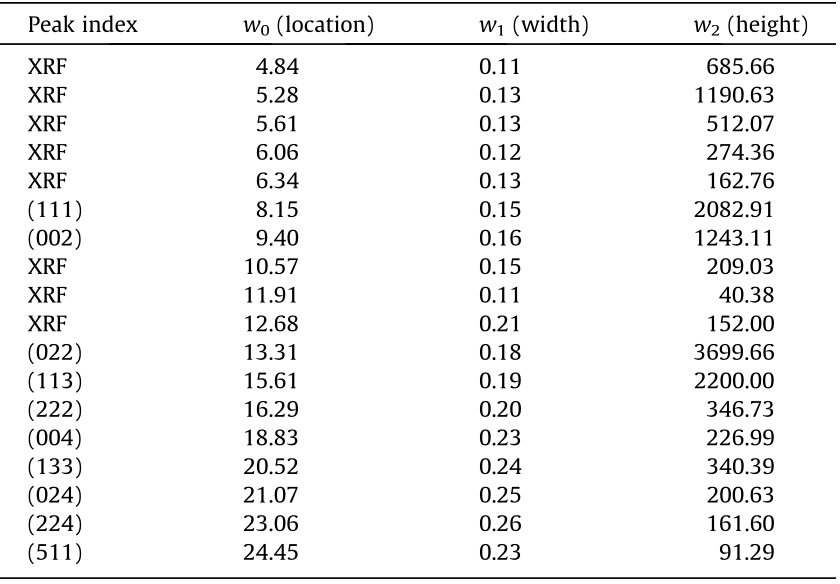
Fig. 2(b) presents the as-acquired energy-dispersive spectra collected by the simulated 88-pixel detector array. The diffraction energy for the same peak shifts with the position of the detector (with a diffraction angle of 2θ), while the fluorescence peaks are solely dependent on the elements present in the sample and do not change with pixel position. As a result, the fluorescence and diffraction can be easily distinguished by comparing the spectra measured at multiple diffraction angles [10,14]. Fig. 2(b) also shows that, for the same peak (hkl) in EDXRD, the peak position shifts in the lower energy direction as the diffraction angle 2θ increases. The range of detectable lattice spacing is determined by the X-ray beam energy spectrum and is dependent on the diffraction angle 2θ, according to Bragg’s law. A wider range is covered for a larger 2θ, which is beneficial for analyzing a complicated structure.
《3.2. Correction of EDXRD peaks》
3.2. Correction of EDXRD peaks
It is important to point out that the relative ratio of intensities between different diffraction peaks is considered to be part of the fingerprints for a given crystal structure, which are critical for a phase analysis of unknown samples based on XRD. However, as will be shown in the upcoming part of this article, the peak ratios from EDXRD spectra (which are taken from a wide X-ray spectra) in Fig. 2 are not consistent with those from ARXRD (which are taken from a single wavelength). Thus, an intensity correction must be performed for the EDXRD data used in crystallographic analysis.
The signal dependency on the energy of the diffraction peaks is mainly attributed to two sources: hardware-related factors (i.e., source intensity, detector sensitivity, and setup geometry) and sample absorption-related factors. The factors related to hardware sensitivity were identified by Scarlett et al. [20] as follows: ① the intensity distribution of the X-ray source with energy, Isource; ② the quantum efficiency of the detector in different energy, Idetector; and ③ the absorption by air, Iair, which is a function of the experiment geometry. The overall hardware sensitivity-related correction can be expressed as follows:

Since the background of an EDXRD spectrum is affected by all three factors of Ihardware, the normalized log-normal function of the background signals can be used as hardware correction calibration in real practice. Fig. 3(a) shows an Ihardware curve obtained for an EDXRD spectrum at 2θ = 28.2°. However, it should be pointed out that, since the XRF signal can only be generated by photons with energy higher than the peak value, XRF peaks are not in proportion to the source intensity at that energy. Therefore, the Ihardware correction is not applicable to XRF peaks. Moreover, the three factors in the Ihardware have no impact on the relative peak height for ARXRD.
《Fig. 3》

Fig. 3. (a) Correction curve Ihardware for the hardware sensitivity of the synchrotron EDXRD experiment given by Eq. (5) at 2θ = 28.2°; (b) correction factor A(θ, E) for the absorption of the CeO2 sample given by Eq. (6) with 2θ = 28.2°; (c) the angular factor Φ(θ).
The absorption correction factor of a sample [20] describes the effect of absorption on the intensity of the diffracted beam, which is a function of the product of the mass absorption coefficient (α) and the sample thickness (ds) in the relation given in Eq. (6):

Furthermore, the angle dependency of the peak intensity is related to diffraction geometry due to the Lorentz polarization, as given by Ref. [1]:
where I0 is the flux of the X-ray; R is the distance between the detector and sample; e and m are the charge and mass of the electron, respectively; c is the speed of light; V is the diffraction volume of the sample; V0 is the volume of the unit cell; Fhkl is the structure factor of the (hkl) plane; P is the multiplicity factor; Φ(θ) is the angular factor; and e-2M is the temperature factor. For a given diffraction peak (hkl), Eq. (7) can be rewritten as a product of one hkl structurally related term  a function of the diffraction angle, and A(θ, ), which can be written equivalently as A(, E). When the change in the diffraction angle is small, A(θ, E) is approximately a function of energy only; that is
Since an EDXRD spectrum is acquired at each pixel with a location-dependent diffraction angle, and at different 2θ angle, the same diffraction occurs under different energies, all spectra should be corrected according to Eqs. (5), (6), and (8) to make them energy and angle independent. The correction curves are shown in Fig. 3.
《3.3. Analysis of EDXRD data》
3.3. Analysis of EDXRD data
Because the data in Fig. 2(b) is collected over a range of diffraction angles, it is very convenient to distinguish the fluorescence signal from the diffraction signal without any ambiguity. The resulting peaks are naturally divided into two groups: the fluorescence peaks, whose positions do not change with the diffraction angle (Fig. 4(a)), and the diffraction peaks, whose positions vary with the diffraction angle converted to q-space (1/d) (Fig. 4(b)). The background is subtracted before the separation of the fluorescence and diffraction spectra.
The diffraction spectra are first corrected with Ihardware, as plotted in Fig. 3(a), and A(E), and then converted to a function of q-space according to Bragg’s equation (Eq. (1)), as shown in Fig. 4 (c). The most prominent change after hardware correction is that the (111) peak surpasses (022) to become the strongest peak, which is the case for the ARXRD data. Meanwhile, the angular dependency is reduced. Finally, using the diffraction angle and wavelength-dependence correction  and Φ(θ), the diffraction angle dependence is essentially eliminated, as shown in Fig. 4(d).
《Fig. 4》

Fig. 4. Spectra separated from the data collected by the simulated 88-pixel energy-dispersive detector array: (a) pure fluorescence spectra; (b) pure diffraction spectra converted to a function of 1/d; (c) data of (b) corrected by Ihardware and A(E); and (d) data of (c) corrected with and Φ(θ).
《3.4. Comparison with 2D-ARXRD》
3.4. Comparison with 2D-ARXRD
3.4.1. Relative intensities
Fig. 5(a) shows the ARXRD data, as measured by the Mar345 plate detector. A set of uniform and concentric Debye rings are collected, suggesting that the CeO2 powders are randomly oriented. The diffraction spectrum in Fig. 5(b) is obtained by integrating the whole rings. The diffraction peaks are located at 2θ from 10.5° to 40.6°, and the d-spacing matches well with the CeO2 powder diffraction file (PDF) card [11].
《Fig. 5》

Fig. 5. (a) The diffraction Debye rings received by a 2D area detector on a CeO2 powder sample at an X-ray energy of 20 keV; (b) the integrated diffraction spectrum; (c) a comparison of the corrected ARXRD diffraction peak and the EDXRD peak relative intensity, with both values normalized to the (113) peak.
It can be seen from Figs. 2(a) and 5(b) that the relative intensities of the diffraction peaks for ARXRD and EDXRD are significantly different, although the peak positions of the two experiments align perfectly. For example, (111) is the strongest peak in ARXRD, and is significantly higher than (113) and (022). However, (022) is the strongest diffraction in EDXRD. It is well established that the diffraction intensity of ARXRD is affected by the Lorentz polarization factor [1] in addition to the structure factor, multiplicity, absorption, and temperature. Therefore, the 2D-ARXRD data must be divided by the angular factor Φ(θ)cos2θ, where cos2θ comes from the correction of R (R/cos2θ, the real distance between the detector and sample) before being compared with the EDXRD data. In Fig. 5(c), the sum of the EDXRD data from 88 pixels in Fig. 4(d)—that is, corrected for hardware, sample absorption, angle, and wavelength factors—is compared with the corrected data of 2D-ARXRD in q-space, in which both curves are normalized to the intensity of the (113) peak. The relative intensities of the corrected EDXRD diffraction peaks agree nicely with those from 2D-ARXRD.
3.4.2. Signal intensity
As stated earlier, 2D-EDXRD is able to integrate signals in both the X-ray wavelength and the detector size dimensions, whereas the corresponding ARXRD techniques only integrate within the dimensions of the detector. Therefore, 2D-EDXRD is perceived to be more efficient as a high-throughput characterization technique. The integrated intensity for the (111) peak area by 2D-EDXRD and 2D-ARXRD is determined to be 3.65 × 10⁶ and 5.69 × 10⁵ , respectively.
In the 2D-ARXRD experiment, when the diffraction ring is fully obtained, as is the case for the CeO2(111), (002), and (113) peaks in this study, the integrated intensity should be half of the total diffracted signal (the other half goes to the reflection mode); that is, the solid angle coverage is effectively 2π sr. In the previous section, we calculated that the solid angle coverage of 2D-EDXRD experiment is 0.004 sr, which is 1570 times smaller than that of 2DARXRD. Thus, the gain of EDXRD over ARXRD for the CeO2(111) diffraction signal can be estimated as follows:

This result suggests that the same intensity can be collected with a much smaller detector with EDXRD than with ARXRD. The 2D-EDXRD technique could be extremely advantageous when the sample volume is small, such as in the microscale region of thin films. This can be especially beneficial when the experimental space is tight and/or the budget is limited.
3.4.3. Full width at half maximum
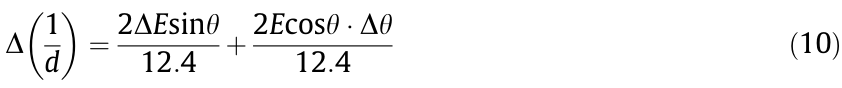
It can be seen from Fig. 5(c) that the EDXRD peaks are broader than the ARXRD peaks. A quantitative fitting of the (022) peak using the Voigt function indicates that the FWHM of ARXRD (0.0054 Å-1 ) is about half of that of EDXRD (0.0119 Å-1 ). This suggests that the q-space resolution of EDXRD does not quite match that of ARXRD under our experimental conditions. There are two primary reasons for the peak broadening in EDXRD: ① the energy resolution of the SDD; and ② the angle span of the SDD when collecting the signal. For EDXRD, 1/d can be expressed as follows, according to Bragg’s law:

where E is the energy of the incident X-ray in keV, and d is the lattice spacing in Å. For a specific (hkl), the FWHM of 1/d can be obtained by taking the full derivatives of Eq. (9):
where  is the energy resolution of the SDD,
  is half of the angle span of the SDD (0.125 keV and 0.433° or 0.00756 rad, respectively, in this case). Applying Eq. (9) to Eq. (10) to eliminate E yields the following:

Eq. (11) shows that the FWHM of a given diffraction in q-space consists of two terms that are related to the uncertainty of the energy resolution and the diffraction direction, respectively, both of which are a function of the diffraction angle. Fig. 6 shows the theoretical energy resolution term, the angular uncertainty term under three detector pixel angle spans, and the corresponding total peak width (FWHM) in q-space calculated for the CeO2(022) plane (d = 1.9132 Å) as a function of the diffraction angle 2θ. The energyresolution-dependent term starts from 0 while 2θ → 0 and increases almost linearly with increasing 2θ. However, the detector span angle term approaches  when 2θ → 0 and decreases with increasing 2θ. As a result, the total FWHM reaches a minima near the crossover point of the two terms. With smaller pixel size, the value of the minima diminishes and the crossover points shift toward a lower angle. For the experimental data collected at a diffraction angle (2θ) of 22.6° and 34.2°, the FWHMs of the (022) peak are 0.0115 and 0.0126 Å-1 , respectively. In comparison, the calculated values according to Eq. (11) are 0.0138 and 0.0123 Å-1 , which are within 20% of the experimental values. Fig. 6 also shows that it is possible for EDXRD to achieve the same or even smaller FWHM as ARXRD if the pixel angle span is small enough, either by reducing the pixel size or by moving the detector far away. For example, the FWHM of ARXRD (0.0054 Å-1 ) can be obtained should the angle span of the detector be under 0.1°. If the angle span is reduced further to 0.05°, the FWHM of EDXRD will be better than that of ARXRD between a 2θ of 6° and 26° under the present energy resolution of the detector. However, the detectable range of lattice spacing will be limited under a low diffraction angle.
《Fig. 6》
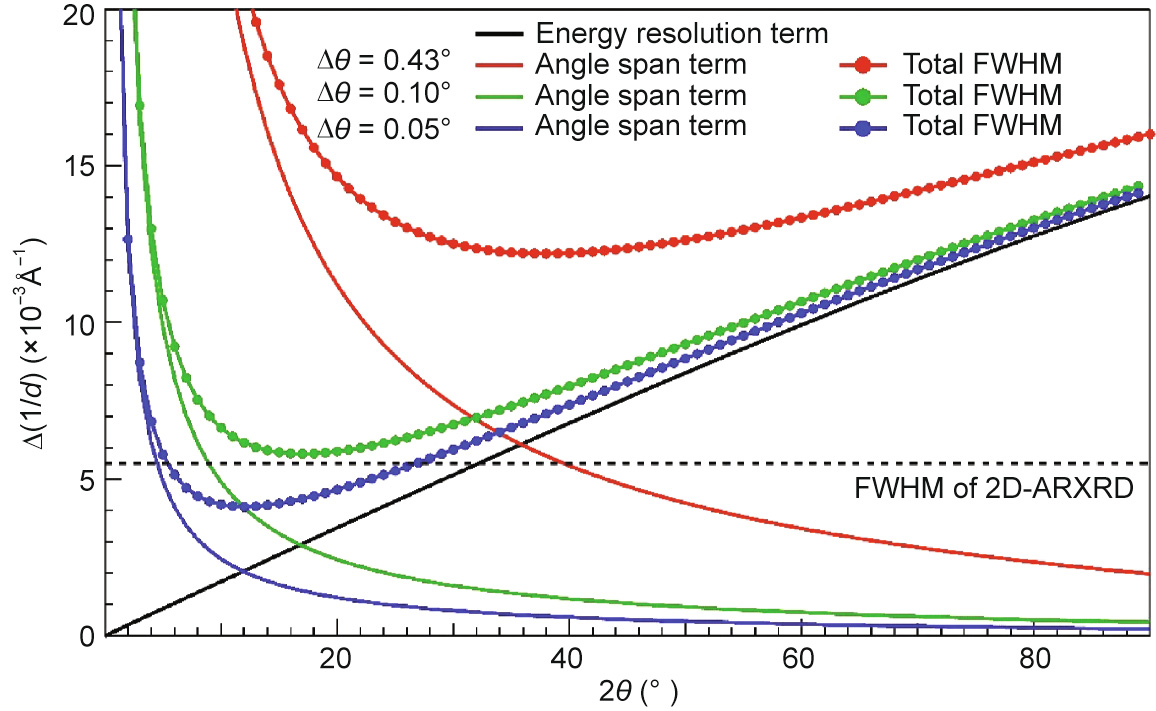
Fig. 6. FWHM of the CeO2(022) diffraction peak in q-space at diffraction angle 2θ at three detector angle spans.
3.4.4. Signal-to-noise ratio
The S/N ratio of EDXRD increased with the pixels of the detector. The S/N ratio of the (111) peak was about 2250/22–100 for a single pixel at 28.2°, and increased to about 188 600/250–750 for 88 pixels, in comparison with 248 600/250–1000 for 2D-ARXRD in this experiment. Statistically, it is well established that the S/N ratio of a measurement is enhanced by multiplication, and it improves proportionally to the square root of the repeat number. Theoretically, in EDXRD, each pixel receives the whole spectrum, the same as other pixels. Thus, the spectra can be added and averaged to result in a better S/N ratio. It is natural to expect that the S/ N ratio for 2D-EDXRD will continue to improve with a further increase in the pixel numbers of the detector.
《3.5. Further comments》
3.5. Further comments
It should be noted that the principle of 2D-EDXRD is also applicable to lab-scale X-ray sources. However, a lab X-ray tube contains narrow but sharp characteristic peaks, which are often a couple of orders of magnitude higher than the white light background. However, the integrated total X-ray photon flux is merely a few times greater than that of the characteristic peak (e.g., three times for a tungsten (W) target). Therefore, the benefits are limited. In comparison, a synchrotron source offers white X-rays whose flux is only mildly dependent on energy within a fairly wide bandwidth. The total flux of white X-rays can be several orders of magnitude higher, which yields a much higher enhancement in the diffraction signal. For a lab X-ray to have the same enhancement, it would be necessary to equip a different type of X-ray source with flatter spectral characteristics than the ones that are commonly in use at present.
In addition to intensity enhancement, another important feature associated with EDXRD is that a complete XRD spectrum with a correct ratio of various peak heights can be obtained regardless of whether a single point or a 2D array is used. This results in significant convenience for experiments. In comparison, ARXRD must cover enough diffraction angles and an entire diffraction ring (or an equal fraction of all peaks) to obtain the same information, or else the relative intensity will be biased.
EDXRD is typically considered to provide fast but lower quality diffraction data in comparison with ARXRD. Our analysis shows that this may not always be true. It is possible for EDXRD to achieve the same or even smaller FWHM as ARXRD if the experimental parameters are properly chosen. The S/N ratio of EDXRD can also be improved by integrating the data from multiple pixels. This means that the potential of EDXRD may have been underestimated. Therefore, it is worthwhile to further develop 2D-EDXRD as a high-throughput technique for simultaneous structure and composition characterization with adequate data quality.
In the end, we would like to point out that the benefits of 2DEDXRD are based on the premise that a mature integrated energy-dispersive detector array is available that offers sufficiently high energy resolution [21]. The energy resolution of a Peltiercooled CCD is 230 eV at present [16]. Several efforts toward improving the energy resolution have been reported. For example, an array energy-dispersive detector pnCCD with a low dynamic range was launched by PNDetector GmbH in Germany [22]. A Maila array energy-dispersive detector was developed at Berkeley in the United States [23], and the HEXITEC detector was developed in the United Kingdom [13,24]. It is anticipated that commercial versions of high energy resolution 2D array detectors will appear in the next several years.
《4. Conclusions》
4. Conclusions
2D-EDXRD is considered to be a good candidate as a highthroughput characterization technique, since it integrates signals in two spatial directions, as well as in wavelength. In this paper, a CeO2 powder sample was measured at SSRF using setups of 2DARXRD, EDXRD, and 2D-EDXRD, in which a moving single-point SDD was used to simulate an 88-pixel 2D detector array. In the EDXRD experiment, both XRD and XRF data were collected simultaneously. Furthermore, the range of detectable lattice spacing increased with an increasing diffraction angle, given the energy range of the X-ray source. The 2D detector array not only proportionally increased the signal counts, but also improved the S/N ratio. The XRD data from 2D-EDXRD were corrected for hardware-related factors and diffraction angle dependency, resulting in relative peak heights that were well consistent with ARXRD. It was shown that the diffraction signal enhancement by 2DEDXRD over 2D-ARXRD under the experimental conditions was about 104 -fold. The measured FWHM of the EDXRD peaks in q-space was consistent with the theoretical analysis. For a given Xray source, the FWHM is a function of the diffraction angle and pixel angle span. Sharper peaks matching ARXRD quality can be achieved by choosing the experimental parameters properly.
《Acknowledgements》
Acknowledgements
This work is supported by the National Key Research and Development Program of China, China (2017YFB0701900) and HighLevel Special Funds (G02256401 and G02256301). X.-D. Xiang is also supported by the fund of the Guangdong Provincial Key Laboratory (2018B030322001) and the Guangdong–Hong Kong–Macao Joint Laboratory (2019B121205001).
《Compliance with ethics guidelines》
Compliance with ethics guidelines
Xiaoping Wang, Weiwei Dong, Peng Zhang, Haoqi Tang, Lanting Zhang, Tieying Yang, Peng Liu, Hong Wang, and X.-D. Xiang declare that they have no conflict of interest or financial conflicts to disclose.


 京公网安备 11010502051620号


