《1. Introduction》
1. Introduction
Hydrogen sulfide (H2S) is a gasotransmitter that plays a critical role in various cellular signaling pathways [1–3]. The physiological functions of H2S include relaxing blood vessels, lowering blood pressure [4,5], suppressing apoptosis of gastric epithelial cells [6], reducing inflammation [7] and oxidative stress [8]. On the other hand, an increased endogenous H2S level in the pancreas and peripheral tissues contributes to both the pathogenesis and complications of diabetes [9].
According to World Health Organization (WHO) statistics, 39% of adults aged 18 years and above were overweight in 2016, and 13% were obese [10]. Adipose tissue and adipocytes are the epicenters of obesity, as they store and metabolize lipids in the body [11,12]. Preadipocyte differentiation to mature adipocytes, termed adipogenesis, has been the focus of obesity-related cellular studies. The role of H2S as an adipogenic inducer has been reported in 3T3L1 cells [13,14]. Yang et al. [15] observed that H2S stimulated peroxisome proliferator-activated receptor  (PPAR) transactivation via its S-sulfhydration, leading to increased adipogenesis of 3T3L1 cells. Their study also implied that adipogenic promoters (insulin, 3-isobutyl-1-methylxanthine (IBMX), and dexamethasone (DEX)) increase the expression of cystathionine -lyase (CSE), generating more H2S in differentiating preadipocytes.
The role played by adipocyte hyperplasia (i.e., increased cell number) in obesity development has been controversial [16–18]. It was proposed that hyperplasia with a smaller adipocyte size may be protective [19]. Adipose tissues have limited storage capacity, and the presence of more adipocytes may allow the storage of excess energy in the form of lipids to decrease lipotoxicity. Other studies have suggested that adipocyte hyperplasia may occur later than adipocyte hypertrophy (i.e., increased cell size) and may be associated with greater severity and less reversibility of metabolic consequences related to obesity [20–22]. In a chronic state of positive energy balance, hypertrophic adipocytes become metabolically inactive after reaching a critical cell size, which is characterized by lipid overload and insulin resistance. At this point, additional adipose precursor cells are recruited to repair the metabolic alterations [23]. In a case of constant overnutrition, the hyperplasia of adipocytes causes adipose tissue to expand, and the newly recruited adipocytes under excess energy become hypertrophic. With this vicious cycle, the hyperplasia and hypertrophy of adipocytes are both responsible for increasing adipose tissue mass and triggering obesity and obesity-associated metabolic complications [24].
To date, the role of H2S in obesity development has been predominantly studied using 3T3L1 cells. However, this immortalized white preadipocyte cell line does not replicate the physiological characteristics of preadipocytes in vivo. Furthermore, this cellular model cannot fully address the complexity of obesity development at the adipose tissue level and whole-body level [24]. Moreover, current understanding of the role of H2S in adipocyte hypertrophy and hyperplasia is lacking. Hence, we investigated the effects of exogenous and endogenous H2S on adipocyte differentiation, hypertrophy, and hyperplasia in mouse preadipocytes and adipose tissues, along with the underlying mechanisms.
《2. Material and methods》
2. Material and methods
《2.1. Lipid extraction from adipose tissue and H2S production rate assay》
2.1. Lipid extraction from adipose tissue and H2S production rate assay
Wild-type (WT) mice were maintained on a C57BL/6J × 129SvEv background. In-house-bred homozygous cystathionine -lyase-knockout (CSE-KO) mice were generated after a backcross of at least ten generations of heterozygous CSE-KO mice with WT mice with the same genetic background [4]. All WT and CSE-KO mice used in this study were verified by genotyping. Each group of WT and the matching CSE-KO mice (eight weeks old, male) came from the same generations. Epidydimal and subcutaneous adipose tissue fat pads were removed; lipid was then extracted from the tissues using the Bligh and Dyer extraction method [25–27] and normalized with adipose tissue weight. All animal experiments were in compliance with the Guide for the Care and Use of Laboratory Animals published by the US National Institutes of Health (NIH Publication No. 85-23, revised 1996) and approved by the Animal Care Committee of Laurentian University, Canada.
The H2S production rates of WT and CSE-KO adipose tissues were measured as described previously [15,28,29]. In brief, mouse adipose tissues were isolated and homogenized using 50 mmol·L–1 ice-cold potassium phosphate buffer (pH 6.8). The tissue homogenates were then incubated with 10 mmol·L–1 L-cysteine (Sigma– Aldrich, Canada) at 37 °C. After 90 min, trichloroacetic acid (Sigma–Aldrich) was added to stop the reaction. The level of methylene blue generated by the interaction of H2S with N,N-dimethyl-p-phenylenediamine sulfate (Sigma–Aldrich) was detected at an absorbance wavelength of 670 nm with a FLUOstar OPTIMA microplate spectrophotometer (BMG LABTECH, Germany).
《2.2. Cell culture》
2.2. Cell culture
Preadipocytes were isolated from mouse epididymal adipose fat pads [30]. After cleaning out the attached blood vessels, the tissues were pooled and washed three times in sterile Krebs–Ringer buffer (118 mmol·L–1 NaCl, 4.8 mmol·L–1 KCl, 1.3 mmol·L–1 CaCl2, 1.2 mmol·L–1 KH2PO4, 1.2 mmol·L–1 MgSO4, 24.8 mmol·L–1 NaHCO3) supplemented with 3% bovine serum albumin, 5 mmol·L–1 glucose, 100 units·mL–1 penicillin, and 0.1 mg·mL–1 streptomycin. The tissues were minced using scissors and digested with collagenase type II at 3 mg·mL–1 for 45 min at 37 °C with gentle agitation. The cell suspension was filtered through 250 μm filters. The remaining undigested tissue debris was discarded. The filtered cell suspension was centrifuged at 450 g (g = 9.8 m·s–2 ) for 10 min at room temperature. The infranatant containing mature adipocytes was discarded, and red blood cell lysing buffer (Sigma–Aldrich) was added to lyse the erythrocytes. Subsequently, the cells were filtered through a 40 μm mesh and centrifuged (450 g, 10 min at room temperature). The resulting pellet of stromal-vascular cells (i.e., preadipocytes) was resuspended in Dulbecco’s Modified Eagle medium (DMEM) containing 10% fetal bovine serum (FBS) and antibiotics. Following cell counting with 0.4% trypan blue (cell viability > 95%), the cells were seeded in multi-well plates and cultured for 24 h at 37 °C in a humidified atmosphere of 95% air with 5% CO2. The cells were grown, trypsinized, and plated in 12-well plates at 8 × 10⁴ cell per plate. After the cells became confluent, the media was replaced with adipogenic media (ADP) containing IBMX (0.5 mmol·L–1 ), DEX (0.25 μmol·L–1 ), and insulin (10 μg·mL–1 ). Adipogenesis was induced for the cells for six days. The cells were further cultured with ADP for two days. Then, the media was aspirated and switched to DMEM containing only insulin (10 μg·mL–1 ) for the next four days. To study the impact of nutrient overload, we used palmitic acid (PA, 350 μmol·L–1 ) as a nutrient to treat primarily cultured preadipocytes for 20 days. To study the energy imbalance model, we stimulated preadipocytes with high glucose (HG, 25 mmol·L–1 ) and high insulin (HI, 50 μg·mL–1 ) for 20 days in the presence of ADP with or without sodium hydrosulfide (NaHS; 60 μmol·L–1 ).
In different experiments, ADP-differentiated preadipocytes were treated with the protein kinase B (Akt) inhibitor capivasertib [31,32] at 5 μmol·L–1 for all six days or with the cyclin-dependent kinase 2 (Cdk2) inhibitor 3-[1-(3H-Imidazol-4-yl)-meth-(Z)-yli dene]-5-methoxy-1,3-dihydro-indol-2-one (SU9516) at 5 μmol·L–1 [33,34] for the first three days of adipogenic induction.
《2.3. Oil red O staining and triglyceride quantification》
2.3. Oil red O staining and triglyceride quantification
Oil red O dye can combine with triglycerides. An oil red O working solution was prepared by diluting 6 mL of oil red O solution (O1391, Sigma–Aldrich) with 4 mL of distilled water, filtered through a 0.22 μm filter. Four groups of cells were used, and each group received 0, 10, 30, 60, and 100 μmol·L–1 NaHS treatments. Group 1 served as a control, with WT preadipocytes in DMEM. Group 2 consisted of WT preadipocytes in ADP. Group 3 consisted of WT preadipocytes in ADP + DL-propargylglycine (PPG), DL denotes racemic mixture. Group 4 comprised CSE-KO preadipocytes in ADP. After six days of adipogenesis induction, the cells were washed with phosphate-buffered saline (PBS) three times and fixed with 4% formalin solution for 1 h. After the removal of formalin, the cells were washed with PBS three times. Next, 500 μL of 60% isopropanol was added to the plate and then removed quickly. After the plates were completely dry, 500 μL of oil red O working solution was added to the cells. The processed cells were observed under a microscope 20 min after of oil red O addition. If the stain was not taken up by the cells (as observed under a microscope), we kept the cells in the oil red O solution for an additional 10 min. The cells were then washed with distilled water to remove all stain residues and again observed microscopically. Images were taken using an IX71 Inverted microscope (Olympus, Canada). All images were processed using DP2-BSW Version 2.1q.
To quantify the triglyceride in the stained cells, oil red O stain was extracted from the cells using 1 mL of 100% isopropanol. The isopropanol was mixed well by pipetting up and down. The absorbance of the resulting oil red O extract in isopropanol was taken at 510 nm, using a FLUOstar OPTIMA microplate spectrophotometer (BMG LABTECH). A standard triolein calibration curve was prepared according to the work of Ramirez-Zacarias et al. [35]. Triolein, which represents the lipid accumulation level, was dissolved in chloroform at various concentrations; the solvent was evaporated by nitrogen (N2) purging and left overnight in a ventilation hood. The triolein solidified in Eppendorf tubes and was stained with oil red O working solution. After 20 min, the oil red O residue was washed with double distilled water 3–5 times. The oil red O taken up by the triolein was then extracted using isopropanol, and its absorbance was detected at 510 nm. A standard curve was prepared with the fixed amounts of triglyceride for determining the unknown triglyceride content (mg) in preadipocytes.
《2.4. Lipolysis assay》
2.4. Lipolysis assay
The adipose tissues or preadipocytes from the WT and CSE-KO mice were assayed for their non-esterified free fatty acid (FFA) content, using an NEFA Colorimetric Assay Kit from Elabscience (China) [36,37]. The tissue or cell homogenate was used to measure the total FFA content. The total lipid accumulation was compared with the ratio of lipid content to FFA concentration which can be described as: FFA release (mmol·L–1 ) per milligram protein divided by lipid content (mg) per milligram protein.
《2.5. Microscopic evaluation of adipocyte diameter and cell surface area》
2.5. Microscopic evaluation of adipocyte diameter and cell surface area
The diameter and surface area of the oil red O-stained cells were measured and digitally analyzed using ImageJ 1.52a software (NIH, USA).
《2.6. Glucose consumption assay for mouse adipocytes》
2.6. Glucose consumption assay for mouse adipocytes
After 20 days of adipogenic induction, the cells were washed with PBS and serum starved for 24 h using FBS-free DMEM containing a low glucose level (5.5 mmol·L–1 ). After being rewashed with PBS, the cells were incubated with DMEM containing 10% FBS, 25 mmol·L–1 glucose, and 50 μg·mL–1 insulin for 12 h. The culture media were collected and tested for glucose concentrations using a Glucose Colorimetric Assay Kit (ab282922) from Abcam (USA). Glucose consumption was calculated as the difference between the original glucose concentration (25 mmol·L–1 ) and the concentration after 12 h incubation in the culture media.
《2.7. Reagents and antibody》
2.7. Reagents and antibody
Insulin and DEX were purchased from Sigma–Aldrich, IBMX from ACROS, USA, and NaHS from Calbiochem (USA). Antibodies against phospho-mitogen-activated protein kinase kinase (MEK) (1:1000, sc-81503), MEK (1:1000, sc-81504), hormone-sensitive lipase (HSL) (1:1000, 4107), and p-HSL (1:1000, 45804) were purchased from Santa Cruz Biotechnology, Inc. (USA). Antibodies against phospho-Akt (1:1000, 9271), Akt (1:1000, 9272), phospho-insulin receptor β (IrβY1146) (1:500, 3023), Irβ (1:500, 3025), adiponectin (1:1000, 2789), PPAR (1:1000, 95128), CCAAT/enhancer-binding protein β (C/EBPβ) (1:1000, 3082), and glyceraldehyde-3-phosphate dehydrogenase (GAPDH) (1:2000, 5174) were purchased from Cell Signaling Technology (UK). Capivasertib was obtained from MedChem express, and SU9516 from Selleck Chemicals LLC (USA).
《2.8. Western blotting》
2.8. Western blotting
The cells were first lysed on ice with radioimmunoprecipitation assay buffer (RIPA) supplemented with protease inhibitor cocktail (Sigma–Aldrich). Equal amounts of proteins (60 μg per 20 μL per well) were denatured and resolved with sodium dodecyl sulfate polyacrylamide gel electrophoresis (SDS-PAGE), and then transferred to nitrocellulose membranes (Pall Corporation, USA). Thereafter, the membranes were blocked with 5% milk followed by overnight incubation with primary antibody (1:1000) at 4 °C on a shaker. Peroxidase-conjugated secondary antibodies (1:2000) were used, and specific protein bands were visualized with enhanced chemiluminescence (GE Healthcare, UK).
《2.9. RNA isolation and reverse-transcription polymerase chain reaction》
2.9. RNA isolation and reverse-transcription polymerase chain reaction
To perform RNA isolation and reverse-transcription polymerase chain reaction (RT-PCR), the total RNA from cells was isolated using TriReagent (Invitrogen, USA). First-strand complementary deoxyribonucleic acid (cDNA) was prepared according to the protocol from New England Biolabs (Canada) by means of reverse transcription using reverse transcriptase and random oligo primers. The primers used for C/EBPβ were 5' -ACAGCGACGAGTACAAGATCC-3' (upstream) and 5' -GACAGTTGCTCCACCTTCTTCT-3'(downstream); those for cell division cycle 45 (Cdc45) were 5' -AA GGGGAATCTGCGAGAAAT-3' (upstream) and 5' -GGCCAGGAATTTATGCTTGA-3' (downstream); those for minichromosome maintenance 3 (Mcm3) were 5' -TGAGCAAGACTGTGGACCTG-3' (upstream) and 5' -CTTCCTCCTTTTCCGCTTCT-3' (downstream); those for goichi-ni-san1 (Gins1) were 5' -CTGGACGAGGGGATCTGATA-3' (upstream) and 5' -CCCATATTCCCACCTGAGTG-3' (downstream); and those for cell division cycle 25 (Cdc25) were 5' -CCATTCAGATGGAGGAGGAA-3' (upstream) and 5' -TTTAAGGCTCCCAGGATGTG-3'(downstream). Quantification of the messenger RNA (mRNA) expression level was done using SYBR green (BioRad, USA) polymerase chain reaction (PCR) master mix (Bio-Rad, Canada). This reaction was performed on the iCycler iQ5 apparatus (Bio-Rad) associated with the iCycler optical system software (version 3.1). Relative mRNA quantification was calculated by using ‘ [38], where
  is the difference between the threshold cycle of a given target cDNA and an endogenous β-actin gene reference.
  is the difference in between the target and control samples, where the latter are cells without ADP treatment.
《2.10. Statistical analysis》
2.10. Statistical analysis
All data are presented as means ± standard error. Statistical analyses were carried out by one-way analysis of variance (ANOVA) with Dunnett’s multiple-comparisons post hoc test. A p value of < 0.05 was considered to be statistically significant.
《3. Results》
3. Results
《3.1. Lipid content and H2S production rates》
3.1. Lipid content and H2S production rates
The CSE-KO adipose tissues, both the subcutaneous and visceral adipose depots, had significantly lower lipid contents and a lower H2S production rate than the WT adipose tissues (Fig. 1(a)). The difference in FFA concentrations was not significant between the WT and CSE-KO adipose tissues (Fig. 1(b)). The NaHS treatment did not change the FFA concentrations in the adipocytes isolated from WT and CSE-KO mice (Fig. 1(c)).
HSL is known as the chief enzyme for the catabolism of triglycerides to FFAs in adipose tissue [39]. Phosphorylation activation of HSL was at the same level in the WT and CSE-KO adipose tissues (Figs. 1(d) and (e)). Similarly, there was no significant difference between the phosphorylated HSL levels of the WT and CSE-KO primary adipocytes, which were not affected by NaHS at all (Figs. 1(d) and (f)).
The expression levels of the adipogenic markers PPAR and C/EBPβ were higher in the WT than in the CSE-KO adipose tissues and primary adipocytes (Figs. 1(d), (g), and (h)). NaHS treatment increased the expression of both the markers in the primary adipocytes from the WT and CSE-KO mice. (Figs. 1(d) and (h)).
《Fig. 1》
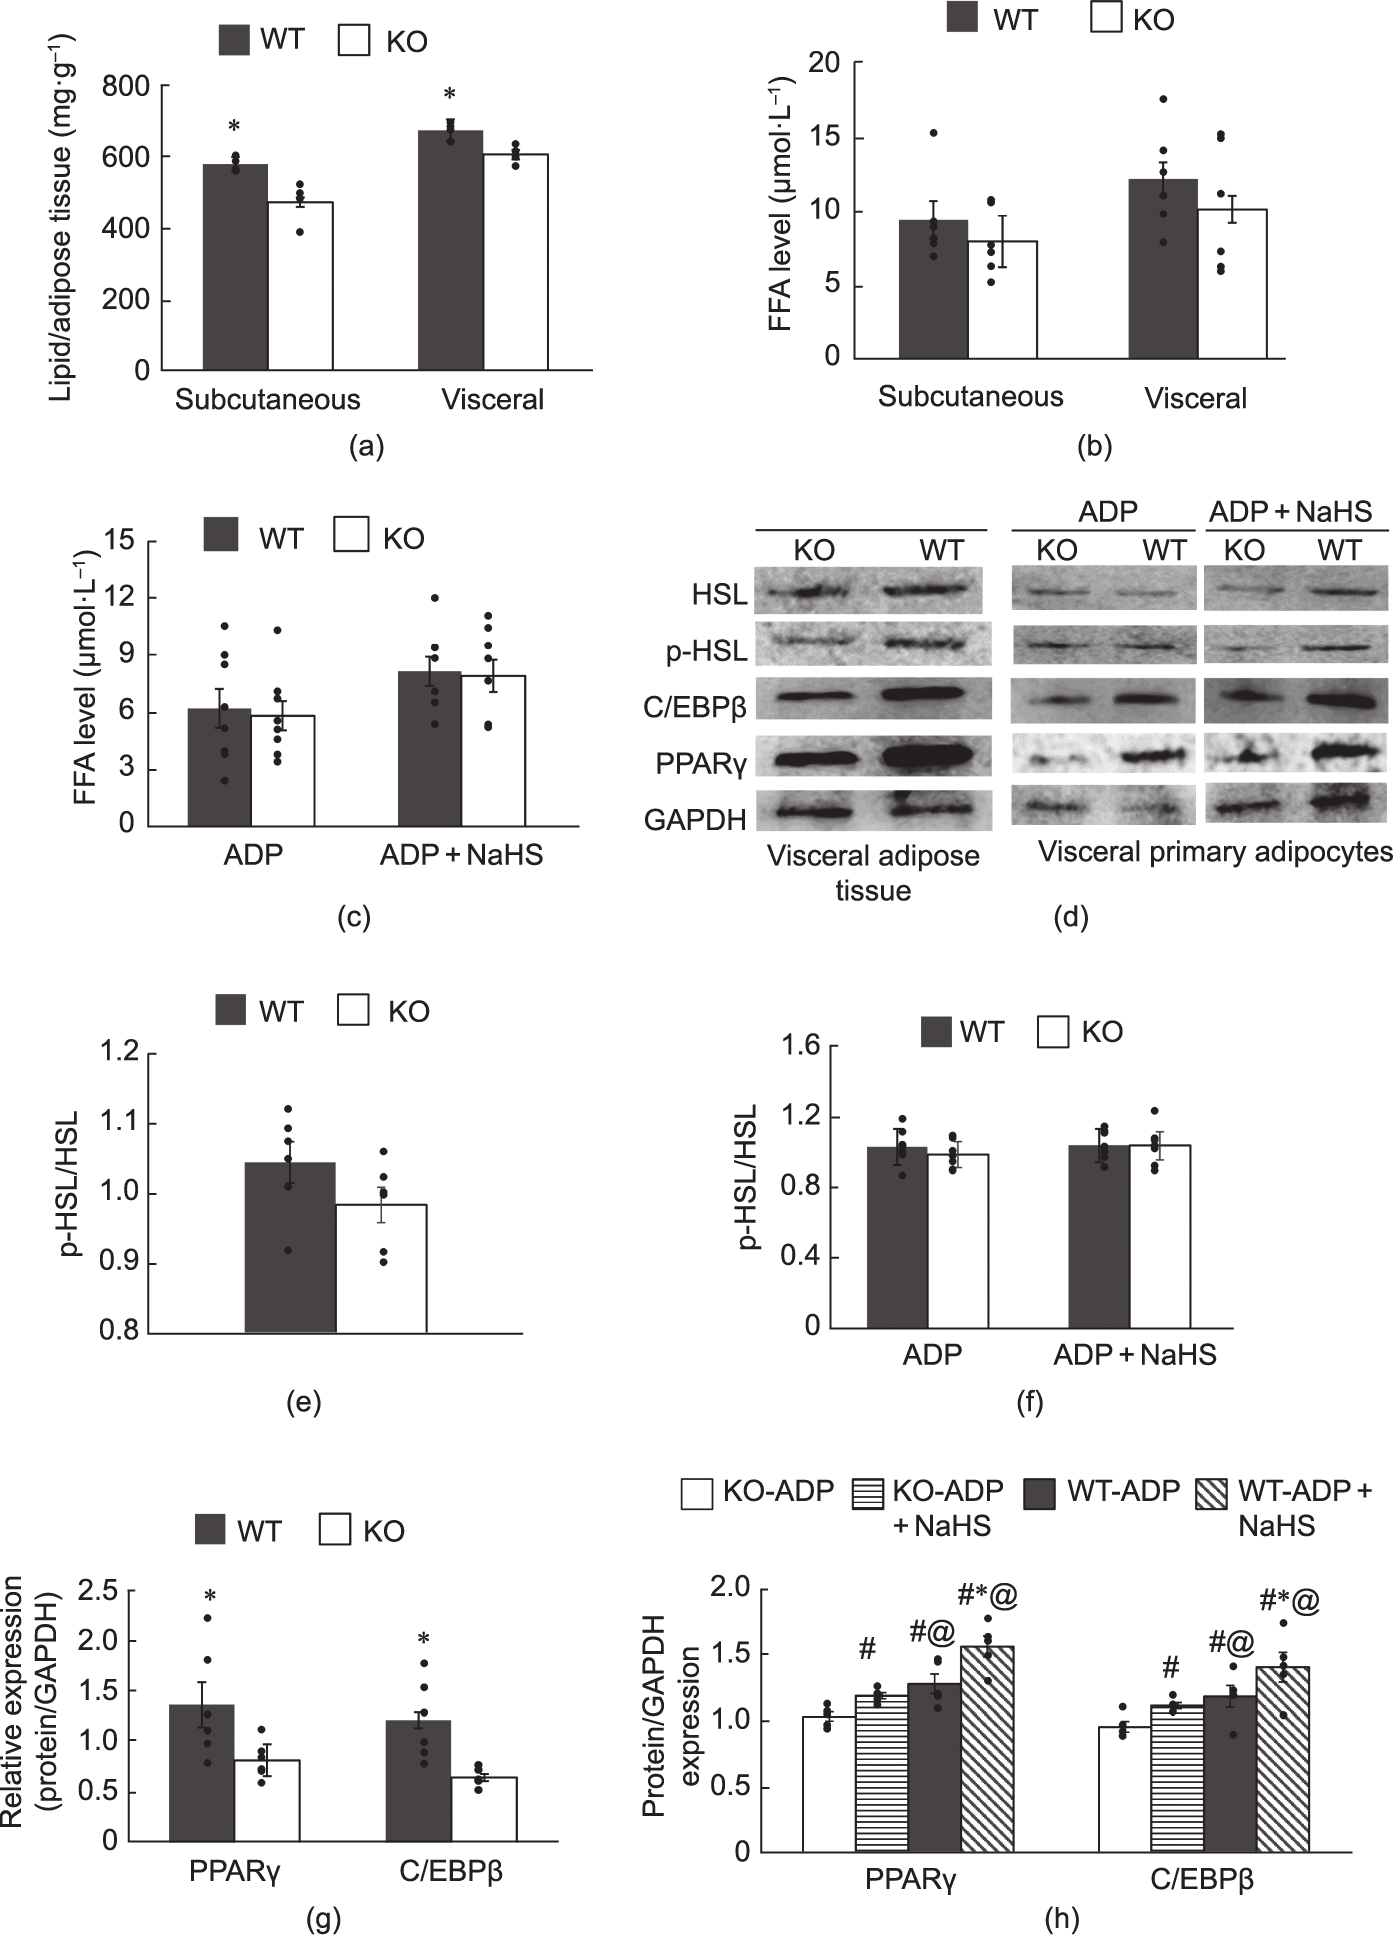
Fig. 1. Lipid accumulation and lipolysis in adipose tissues from CSE-KO (KO) and WT mice. (a) Lipid content in subcutaneous and visceral adipose tissues (*p < 0.05 between CSE-KO and WT adipose tissues, n = 6). (b) FFA levels of subcutaneous and visceral adipose tissues (μmol) per milligram tissue per milligram lipid (n = 6 for each group). (c) FFA levels in primary adipocytes isolated from WT and CSE-KO mice (μmol) per 106 cells per milligram lipid (n = 6). (d) Expression levels of different proteins in visceral adipose tissues and mouse primary visceral adipocytes. (e, f) p-HSL/HSL expression level in (e) visceral adipose tissues and (f) mouse primary visceral adipocytes (n = 6). Expression levels of PPAR and C/EBPβ in (g) visceral adipose tissue and (h) mouse primary visceral adipocytes (n = 6 for each group). KO-ADP and WT-ADP: ADP-induced adipocytes from CSE-KO and WT mice, respectively. #p < 0.05 versus KO-ADP, @p < 0.05 versus KO-ADP + NaHS, *p < 0.05 versus WT-ADP.
《3.2. Adipogenesis in mouse preadipocytes》
3.2. Adipogenesis in mouse preadipocytes
NaHS treatment (10–100 μmol·L–1 ) of the differentiated preadipocytes caused an increase in the lipid accumulation, with the highest oil red O staining being detected in the preadipocytes treated with 60 μmol·L–1 NaHS. In the absence of differentiating media (control group), treatment with 10–100 μmol·L–1 NaHS did not affect adipogenesis in the WT mouse preadipocytes. Incubation of the WT preadipocytes with the CSE inhibitor PPG significantly decreased adipogenesis (Figs. 2(a) and (b)). The differentiated CSE-KO preadipocytes (KO + ADP) had significantly lower oil red O staining than the WT preadipocytes. In the absence of NaHS treatment, there was no significant difference among CSEKO + ADP, WT + ADP + PPG, and the non-differentiating control groups. However, NaHS treatment at 60 and 100 μmol·L–1 resulted in preadipocyte differentiation of both PPG-treated and CSE-KO preadipocytes.
《Fig. 2》
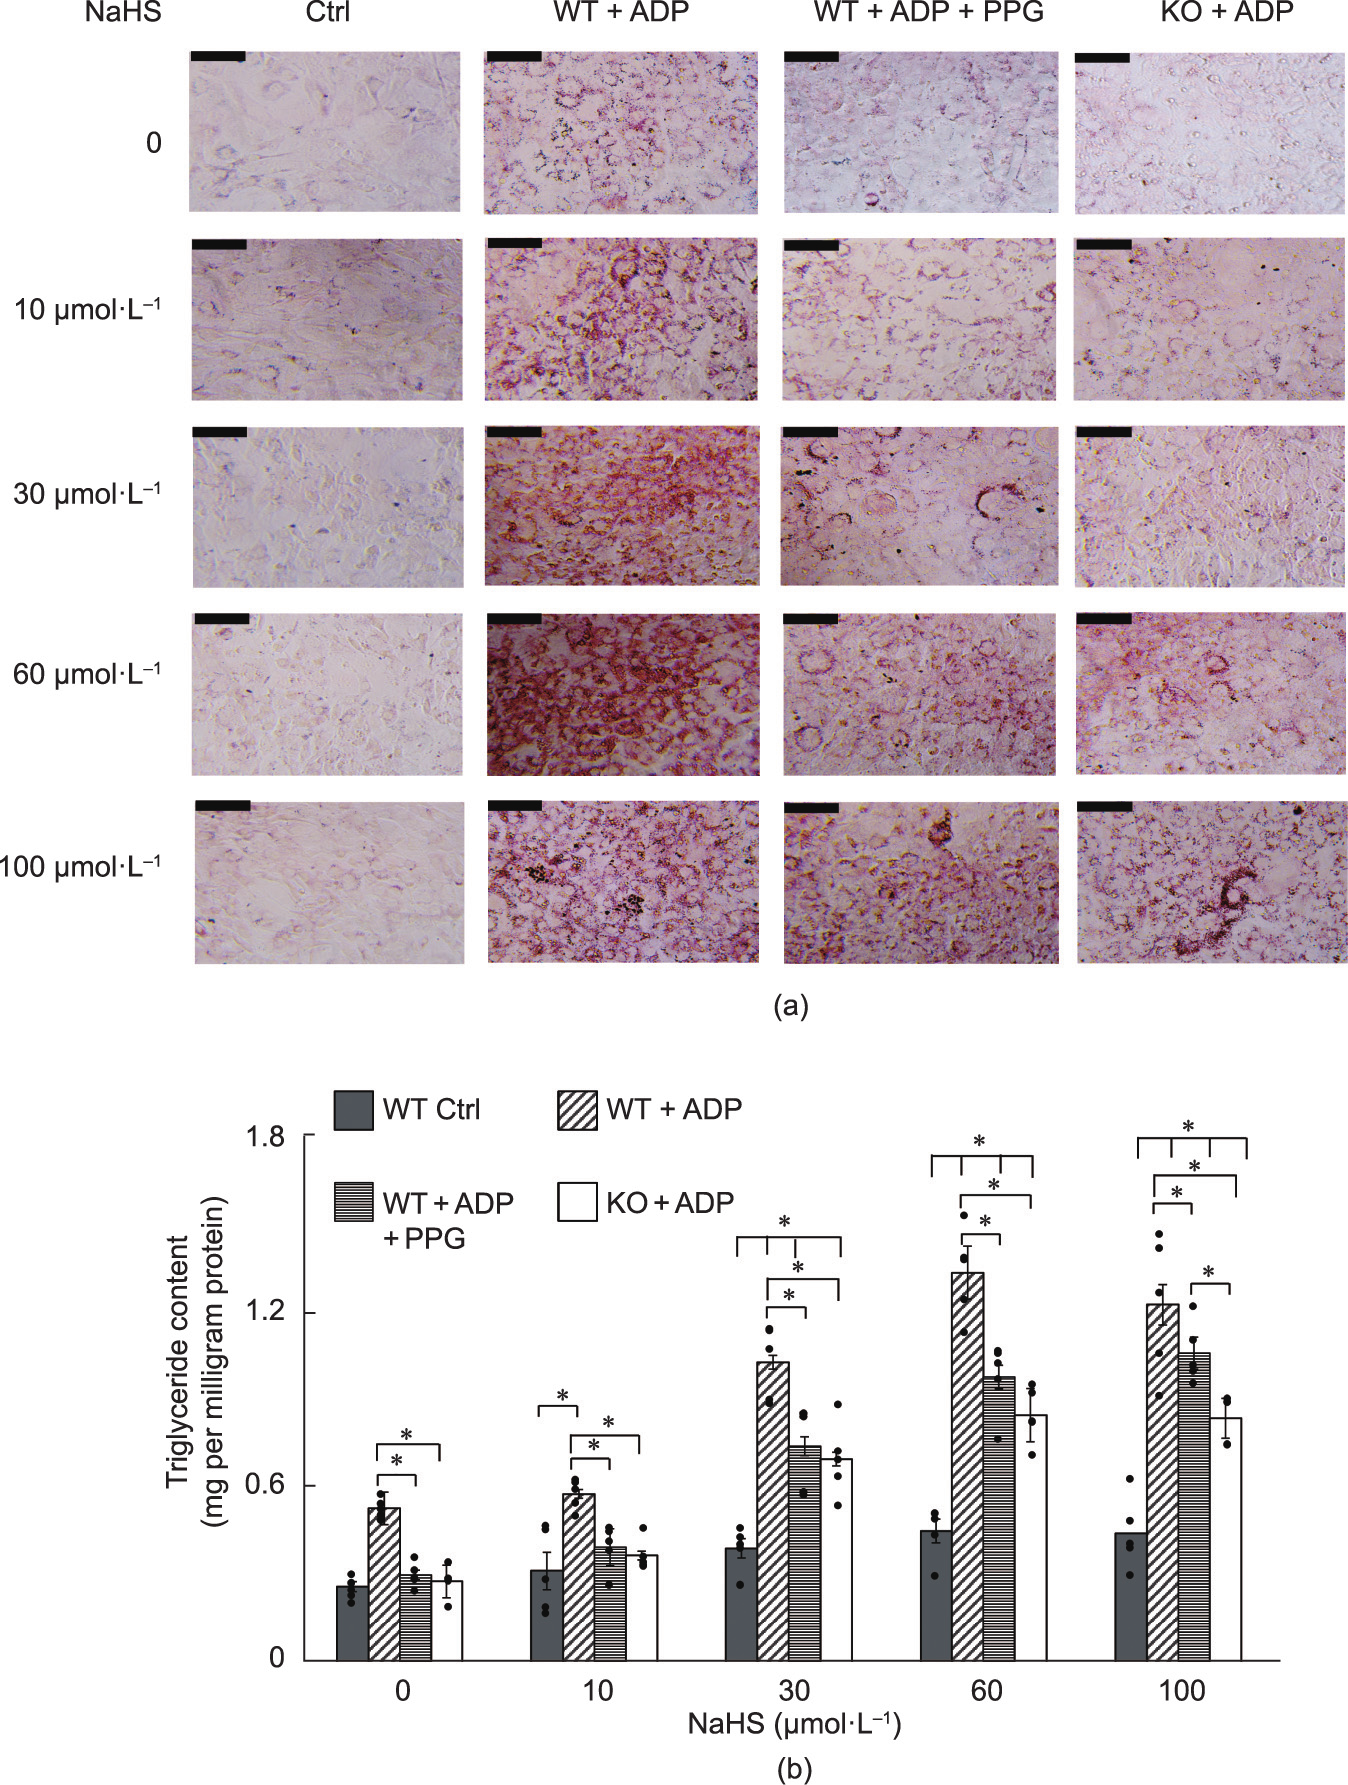
Fig. 2. Adipogenesis of preadipocytes isolated from WT and CSE-KO mice. (a) Cells were cultured under different conditions for six days; their differentiation was indicated by oil red O staining. Ctrl: the group of WT cells without any treatment; scale bars represent 200 μm. (b) Accumulation of triglycerides in different groups of mouse adipocytes (*p < 0.05; n = 6 for each group).
《3.3. NaHS-induced time-dependent adipogenesis》
3.3. NaHS-induced time-dependent adipogenesis
Fig. 3(a) describes the experimental design for the adipogenic induction of WT mouse preadipocytes for six days. The differentiating cells were also exposed to 60 μmol·L–1 NaHS for different periods (Fig. 3(b)). The first two days of NaHS exposure did not cause significant change in oil red O stain of differentiating cells. Prolonged NaHS exposure for four and six days significantly increased the extent of oil red O stain and lipid accumulation in the differentiating cells (Figs. 3(c) and (d)).
《Fig. 3》
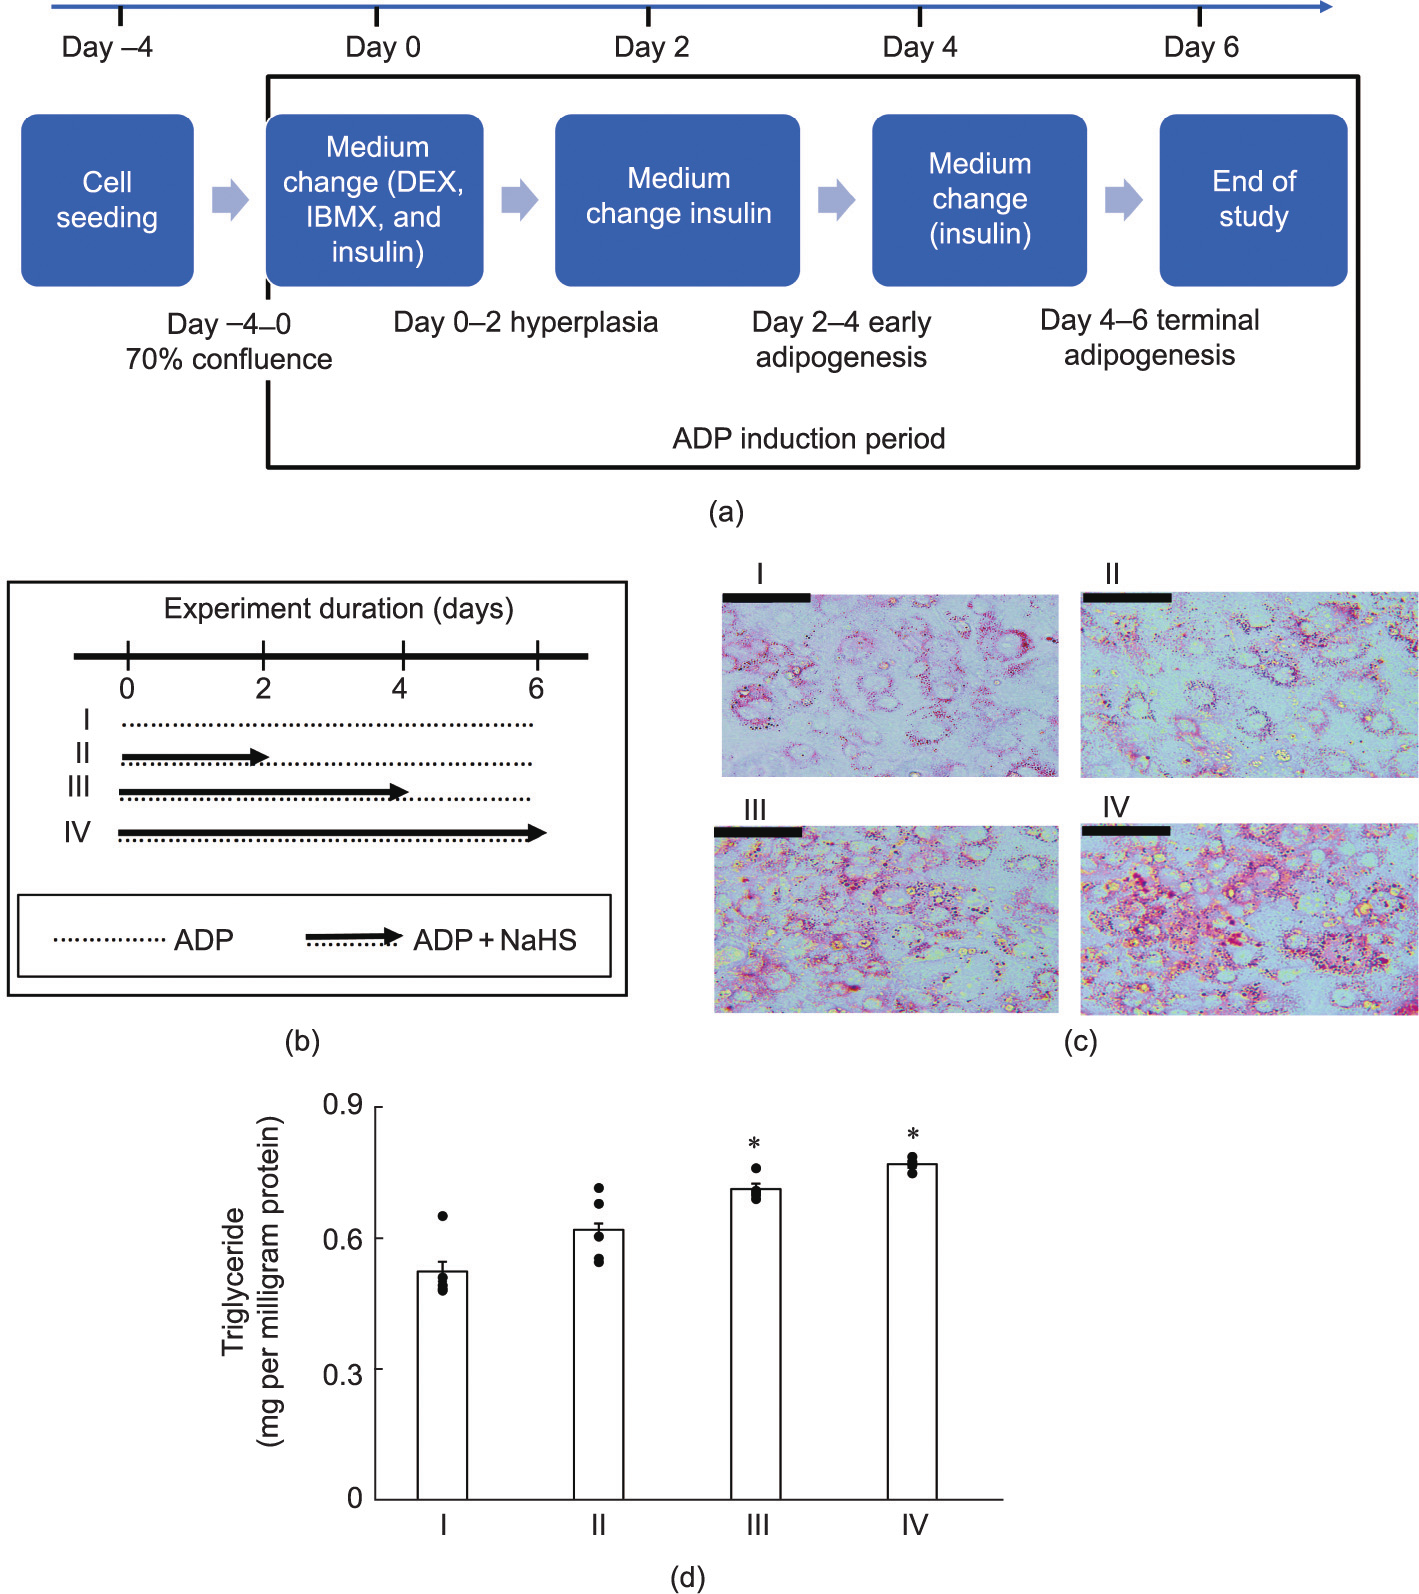
Fig. 3. Time course of NaHS-induced adipogenesis. (a) Adipogenesis induction protocol. (b) NaHS treatment protocols for different experimental groups (groups I, II, III, and IV). Arrows depict the duration of H2S + ADP treatments, and dotted lines are the duration of ADP treatment only. (c) Differentiation of preadipocytes from WT mouse adipose tissue; cells from all groups (I–IV) were stained with oil red O to reflect adipogenic differentiation (scale bars represent 200 μm; n = 6 for all groups). (d) Triglyceride accumulation in differentiated mouse preadipocyte groups; triglyceride was quantified using a triolein standard curve after six days (*p < 0.05 versus group I; n = 6 for all groups).
《3.4. NaHS-induced hypertrophy of preadipocytes》
3.4. NaHS-induced hypertrophy of preadipocytes
The WT mouse preadipocytes were cultured for 20 days to induce adipogenesis. The preadipocytes with NaHS treatment alone were not viable and died after ten days of incubation. After 20 days of adipogenic induction with PA or HG/HI, the adipocytes and lipid droplets became significantly larger than the cells that only received ADP treatment. These effects of palmitic acid PA and high glucose HG/high insulin HI were further enhanced by NaHS treatment (Fig. 4(a). In addition, glucose consumption was significantly greater in all the NaHS-treated groups than in their respective non-NaHS treated groups (Fig. 4(b)). The lipid droplet diameter and cell sizes were calculated using ImageJ software V1.53t (NIH, USA) (Figs. 4(c) and (d)).
《Fig. 4》
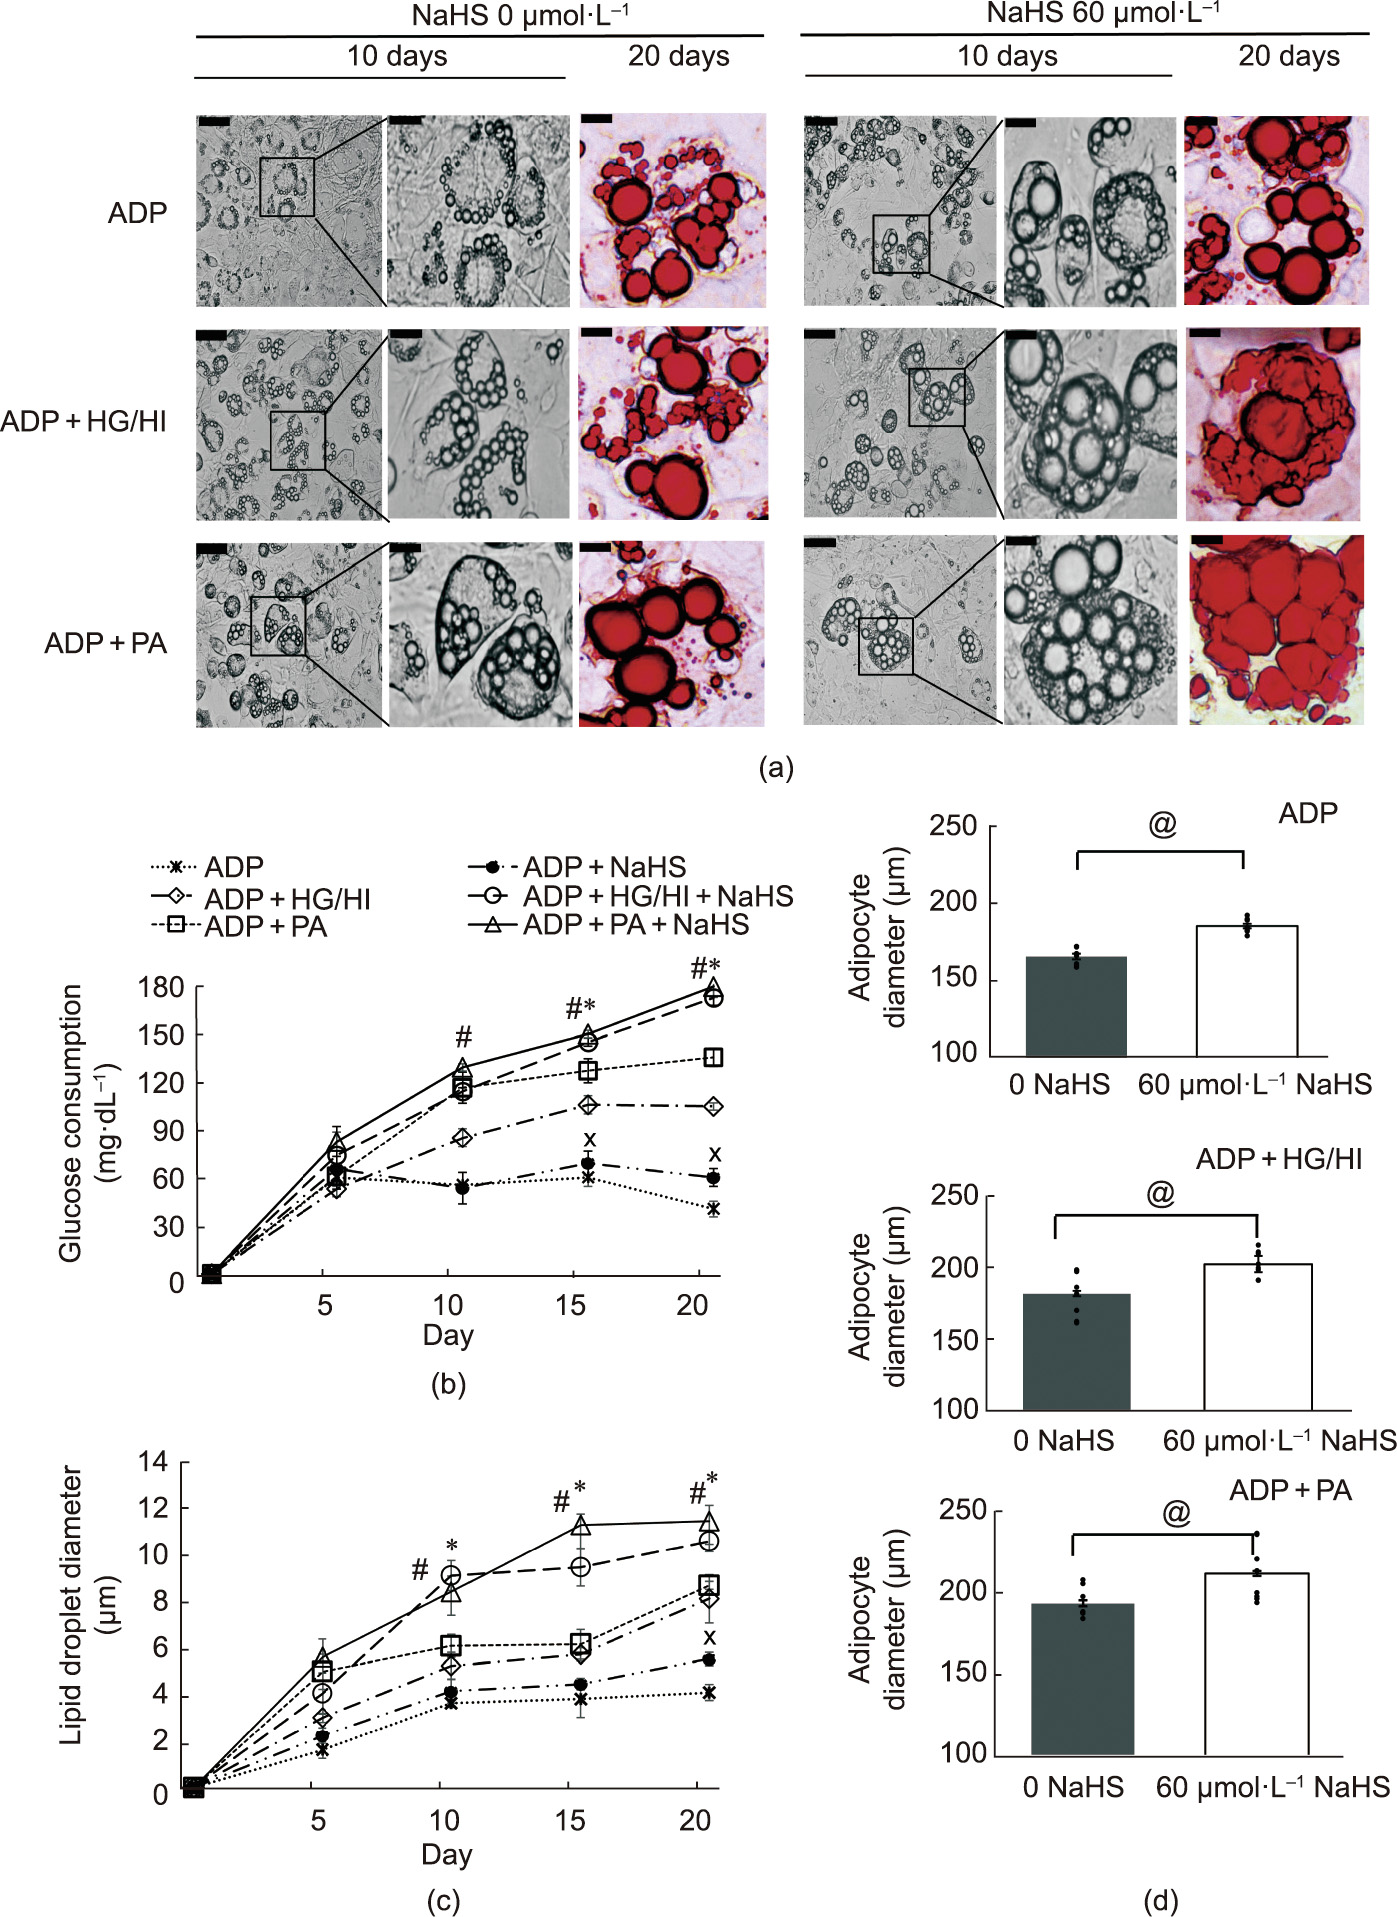
Fig. 4. NaHS-induced hypertrophy of differentiated adipocytes from WT mouse adipose tissue. Mouse primary preadipocytes were adipogenically induced for 20 days. (a) Cell images were taken at day 10 (gray scale) and day 20 of culture (oil red O stain). Scale bars are 200 μm in the left panels and 50 μm in the middle and right panels of two NaHS treatment groups. (b) Glucose consumption (mg·dL–1 ) per milligram protein 12 h after incubating the adipocytes with fresh DMEM containing 25 mmol·L–1 glucose (n = 6). (c) Diameters of lipid droplets and (d) diameters of adipocytes were measured using ImageJ software (n = 10; *p < 0.05 versus ADP + PA; #p < 0.05 versus ADP + HG/HI; Xp < 0.05 versus ADP; @p < 0.05). HG: 25 mmol·L–1 ; HI: 50 μg·mL–1 .
《3.5. NaHS-induced hyperplasia of mouse preadipocytes》
3.5. NaHS-induced hyperplasia of mouse preadipocytes
The in vitro NaHS treatment of differentiating preadipocytes (ADP + NaHS) for 24 h resulted in the upregulation of mitotic clonal expansion (MCE) genes (C/EBPβ, Cdc45, Mcm3, and Cdc25), except for Gins1 (Fig. 5(a)). A bromodeoxyuridine (BrdU) assay confirmed that the NaHS treatment at 10–100 μmol·L–1 increased the proliferation of both ADP-treated differentiating cells and nondifferentiating control cells (Fig. 5(b)). A 3-(4,5-dimethylthiazol-2 -yl)-2,5-diphenyltetrazolium bromide (MTT) assay showed that the NaHS treatments of differentiating cells increased the number of viable cells (Fig. 5(c)).
We next investigated the effects of NaHS on the regulators responsible for cell cycle progression from G0 to G1. As shown in Fig. 5(d), adipogenic differentiation with ADP markedly decreased the protein expression levels of p27 (cyclindependent kinase inhibitor), but not Cdk2, in comparison with those of the non-differentiating control cells. NaHS treatment with adipogenic differentiation (ADP + NaHS) further decreased the expression of p27, but increased Cdk2 expression. Although they were not significant, increasing and decreasing trends in Cdk2 and p27 expression, respectively, were observed when we treated the non-differentiating cells with NaHS (Ctrl + NaHS), in comparison with the non-differentiating control cells.
《Fig. 5》
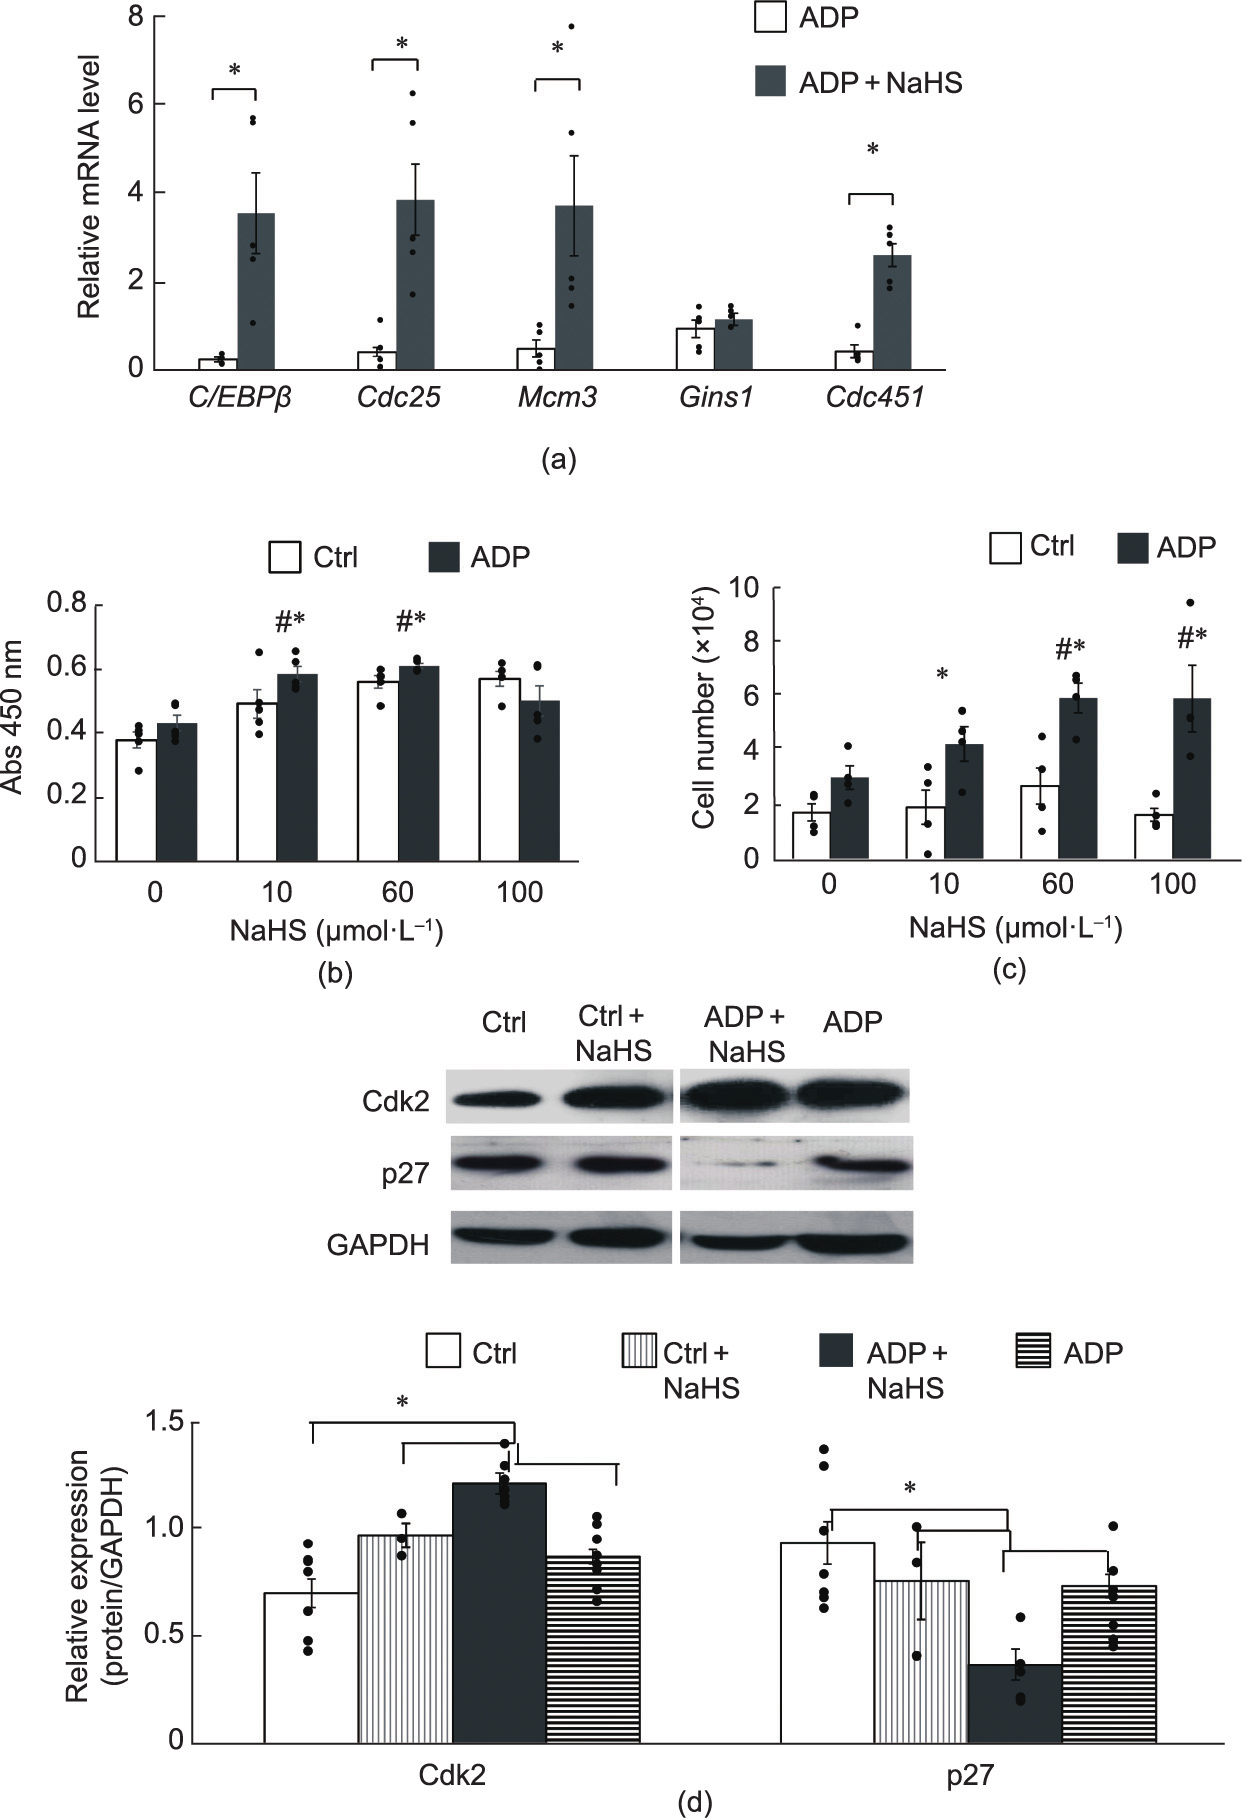
Fig. 5. NaHS-induced hyperplasia of preadipocytes after 24 h in culture. (a) Detection of mRNA levels of hyperplastic genes in post-confluent preadipocytes in the absence or presence of 60 μmol·L–1 NaHS (n = 5 for each group). (b) BrdU assay for cell proliferation under different conditions (n = 5 for each group). (c) MTT assay for cell viability under different conditions (n = 4 for each group). (d) Protein levels of cyclin-dependent kinase inhibitor 1B (p27) and Cdk2 in preadipocytes with different conditions, detected by Western blotting (n = 6 for each group). GAPDH was used as a loading control (*p < 0.05 versus Ctrl; #p < 0.05 versus NaHS at 0 μmol·L–1 ). BrdU: bromodeoxyuridine; MTT: 3-(4,5-dimethylthiazol- 2-yl)-2,5-diphenyltetrazolium bromide.
《3.6. NaHS effects on the mitogen-activated protein kinase (MAPK) and phosphatidylinositol 3 (PI3)/Akt pathways》
3.6. NaHS effects on the mitogen-activated protein kinase (MAPK) and phosphatidylinositol 3 (PI3)/Akt pathways
The NaHS treatment of non-differentiating cells did not phosphorylate Irβ (Fig. 6(a)). However, the NaHS treatment of differentiating cells (ADP + NaHS) increased Irβ and MEK phosphorylation as early as after 6 h (Figs. 6(a) and (b)). ADP alone increased Irβ phosphorylation in a time-dependent manner. MEK phosphorylation was increased at all the time points (i.e., the 6th, 12th, and 24th hours) by ADP induction or NaHS treatment (Fig. 6(b)).
The NaHS treatment of differentiating preadipocytes (NaHS + ADP) for six days significantly increased Akt phosphorylation, and adiponectin expression more than treatment with ADP or NaHS alone (Figs. 6(c)–(e)). Adiponectin is known to promote adipogenesis and increase lipid content in maturing preadipocytes [16].
《Fig. 6》
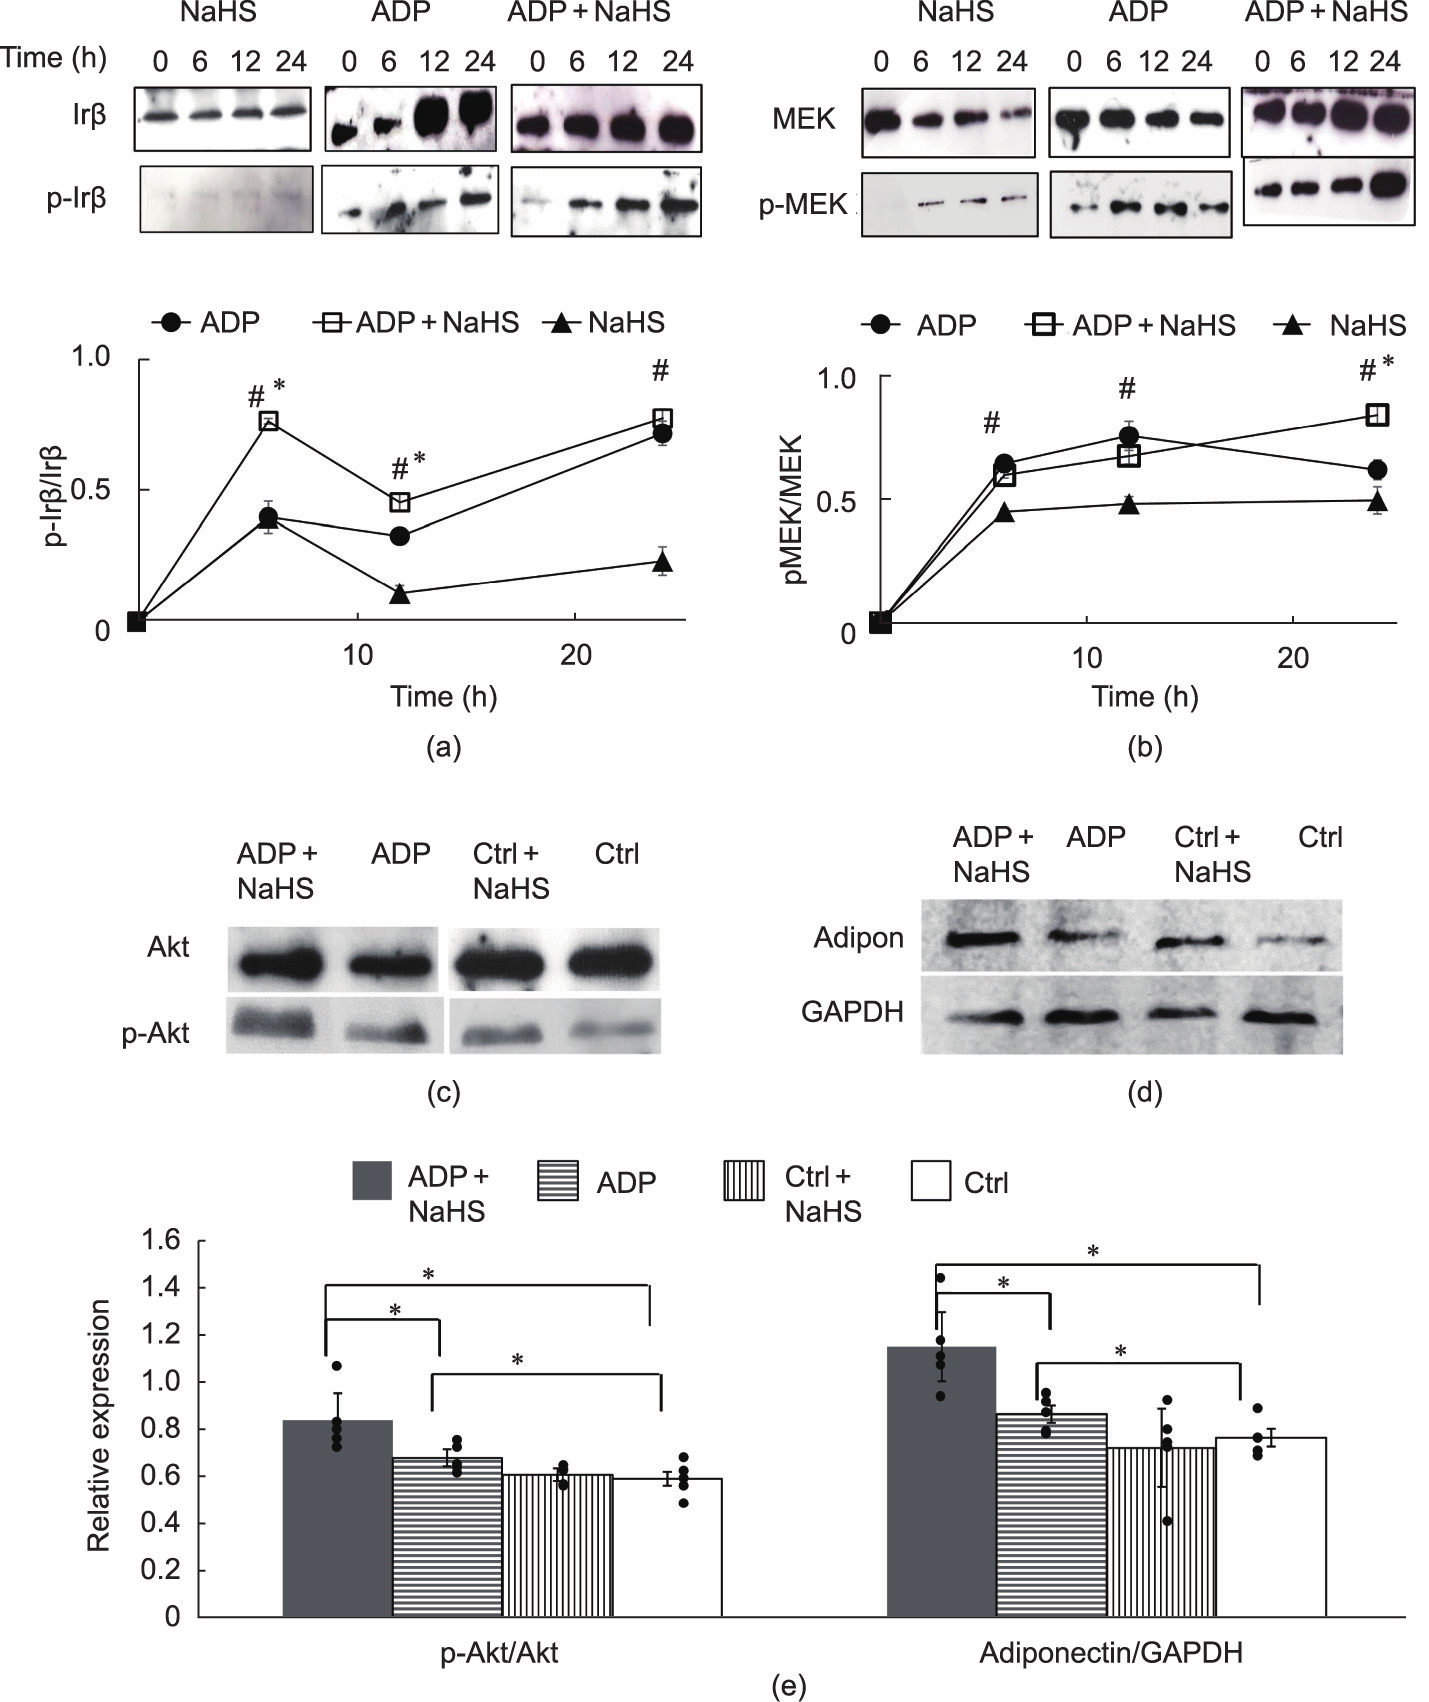
Fig. 6. NaHS-activated MEK/extracellular-signal-regulated kinase (ERK) and Akt pathways. Preadipocytes isolated from WT mice were treated with 60 μmol·L–1 NaHS and stimulated with or without ADP for the indicated times. (a) Phosphorylation of Irβ (p-Irβ) proteins. (b) Phosphorylation of MEK (p-MEK) proteins. (c) Akt phosphorylation (p-Atk) and (d) adiponectin (Adipon) expression levels after six days of adipogenic induction (n = 6 for each group in all figure panels; *p < 0.05 versus ADP; #p < 0.05 versus NaHS). (e) NaHS-activated MEK/ERK and Akt pathways.
《3.7. Effect of Cdk2 and Akt inhibition on mouse adipocytes》
3.7. Effect of Cdk2 and Akt inhibition on mouse adipocytes
Cdk2 was inhibited by SU9516 in differentiating the preadipocytes with or without NaHS treatment for the first three days. SU9516 treatment significantly inhibited cell proliferation in both the NaHS treated and the non-treated groups (Fig. 7(a)). NaHS treatment did not have a significant effect on the viability of the differentiating preadipocytes in the presence or absence of SU9516 (Fig. 7(a)). After Akt was inhibited in the differentiating preadipocytes by capivasertib for all six days, the stimulatory effect of NaHS on lipid accumulation in the differentiated adipocytes was abolished (Fig. 7(b)). MTT assay confirmed the inhibitory effect of SU9516 on preadipocyte cell viability Fig. 7(c). Oil red O and lipid quantification assays confirmed the inhibitory effect of capivasertib on adipogenesis and lipid accumulation Fig. 7 (d).
《Fig. 7》

Fig. 7. Mediation of NaHS-stimulated hyperplasia and adipogenesis of mouse adipocytes by Cdk2 and Akt. (a) Adipocyte hyperplasia and lipid accumulation after the inhibition of Cdk2 activity with SU9516. (b) Lipid accumulation in adipocytes after the inhibition of Akt activity with capivasertib (Capi), measured with oil red O staining. (c) MTT assay of viable adipocytes with or without Cdk2 inhibitor (SU9516). Cell viability was calculated using the formulae: Day 3/Day 0 × 100%. (d) Accumulation of triglycerides (mg) per milligram protein in mouse adipocytes in different groups with or without the Akt inhibitor capivasertib (n = 6 for each group; *p < 0.05).
《4. Discussion》
4. Discussion
Adipocytes are specialized cells that accumulate large amounts of triglycerides during periods of energy excess and then consume the stored triglycerides during times of energy deficit [40,41]. Adipocyte development starts from the mesenchymal stem cells that become committed to adipocyte lineage—namely preadipocytes [40–42]. Adipogenesis occurs through changes in preadipocyte shape, size, and other morphological and physiological features. Endogenous H2S production in rat periaortic, epidydimal, perirenal, and brown adipose tissues has been reported [42,43]. In addition to CSE, cystathionine beta-synthase (CBS) is another H2S-generating enzyme. Although CSE proteins and CBS transcripts have been detected in rat adipose tissues, CSE is a predominant source of H2S generation in these tissues, since 75%–80% of H2S production is eliminated by CSE inhibitors, PPG, or β-cyano-L-alanine [44]. Using RT-PCR andWestern blotting, we previously showed that CBS and CSE were expressed in 3T3L1 preadipocytes, mouse white adipose tissue (epididymal, perirenal, and mesenteric), and brown adipose tissue with lower levels of CBS mRNA and protein than those of CSE [15]. Another pathway of H2S production exists that is catalyzed by 3-mercaptopyruvate sulfur transferase (MST). Stimulation of adipogenesis with a mixture of insulin, dexamethasone, and IBMX was associated with upregulation of CBS, CSE, and MST and increased the H2S concentration in cultured 3T3L1 cells [13,15,44]. Since the expression of CSE is more abundant in visceral and subcutaneous adipose tissues than CBS and MST [15], CSE contributes the most to H2S production in adipose tissue.
If grown past 70% confluence and subsequently passaged, 3T3L1 cells lose their ability to fully differentiate upon hormonal stimulation [45,46]. Primarily cultured preadipocytes manifest with characteristics similar to the specific tissues they derive from, providing a physiologically relevant model to study the complexity of adipose tissue. Moreover, preadipocytes from adipose stromal cells can be cryopreserved for a long time with minimal loss of proliferation and differentiation capacity. Furthermore, primarily cultured preadipocytes can be derived from WT or genetically modified animals with different genetic backgrounds, which is not possible with homogeneous cell lines such as 3T3L1 [47].
The adipose tissues we used were from five weeks old mice. At this age, mice produce more undifferentiated preadipocytes than mature adipocytes [30]. There are two types of cell contamination in primary preadipocyte culture: red blood cells and endothelial cells. We first removed all visible blood vessels from the adipose tissue before digestion; then, we lysed the red blood cells (RBC) using RBC lysis buffer. Endothelial cells from blood vessels were clustered together after centrifugation and were filtered out using a 40 μm pore-size filter. If any anomalous cell shape—relative to the spindle shape of the preadipocytes—was noticed during the culture, that area was marked and scraped using a cell scraper. Our primary preadipocyte culture showed no endothelial cell contamination, which would have formed the characteristic cobblestone monolayer. Mature adipocytes—that is, fat-loaded cells— were present in the floating layer, which was discarded every time we centrifuged the digested tissue samples. To confirm the adipocyte lineage, we observed the protein expression of the adipocytespecific biomarkers PPAR and fatty-acid-binding protein 4 (FABP4) at the end of the differentiation process [48]. Only the preadipocyte culture batches with PPAR and FABP4 expression were cryopreserved and used for further studies.
CSE-KO mice offer a unique tool to assess the role of CSEcatalyzed endogenous H2S production in the adipogenic process [4]. In this study, we show that lipid accumulation was significantly lowered in the CSE-KO mouse adipose tissues, which have a significantly lower endogenous H2S level than WT mouse adipose tissues. This result is the first piece of direct evidence that endogenous H2S contributes to increased lipid accumulation in adipose tissue. That the inhibition of CSE with PPG decreased the extent of adipogenesis further speaks to the role of CSE in the adipogenic process (Fig. 2).
In our study, under adipogenic stimulation, the treatment of mouse preadipocytes with exogenous H2S (NaHS, 10–100 μmol·L–1 ) increased adipogenesis and lipid accumulation significantly. WT preadipocytes in the presence of the CSE inhibitor PPG or CSE-KO preadipocytes exhibited decreased lipid accumulation upon differentiation, demonstrating the role of CSE-generated endogenous H2S in adipogenesis. Exogenous H2S in the form of NaHS also increased adipogenesis under the aforementioned conditions (Fig. 2). Evidently, our study shows that the effect of H2S on adipogenesis is dependent on adipogenic inducers, as no lipid accumulation was observed in preadipocytes in the absence of the adipogenic inducers. Furthermore, H2S treatment of the cultured adipocytes did not alter lipolysis, since it did not change the FFA concentration or HSL phosphorylation. These observations suggest that H2S-stimulated adipogenesis and lipid accumulation are independent of lipolysis.
Insulin, a principal hormone inducer of adipogenesis, activates the phosphatidylinositol 3-kinase (PI3-K)/Akt pathway through insulin receptors (IRs) to promote adipocyte differentiation. IBMX and dexamethasone in combination regulate PPARc, promoting adipogenesis through the protein kinase A (PKA) pathway. Xue et al. [49] reported that exogenous H2S activated the PI3-K/Akt pathway in myotubes and 3T3L1 cells by increasing IR sensitivity, leading to improved glucose uptake in vitro and in vivo. Insulin sensitivity can be regulated by serine/threonine phosphorylation of the IR substrate proteins IRS1 and IRS2. Akt is an essential downstream mediator protein of adipogenesis. We have shown that he inhibition of Akt activity resulted in suppressed adipogenesis (Figs. 7(b) and (d)). Furthermore, inhibition of the Akt pathway decreased NaHS-induced triglyceride accumulation in preadipocytes. Thus, we proved that NaHS stimulated its downstream Akt signaling to induce adipogenesis in mouse preadipocytes.
Adipogenic differentiation has two main phases: early differentiation or MCE and terminal differentiation. MCE is a synchronous process marked by an increase in C/EBPβ. When exposed to appropriate environmental and genetic cues, preadipocytes undergo MCE, increasing DNA replication, forming clones, and transforming into an adipocyte phenotype [50]. Lipid droplet accumulation occurs in the terminal stage [40,42,50–53], correlated with PPAR upregulation. Each adipogenic phase is manifested with different transcriptional and genetic changes and modulations [52–54]. Our study confirmed that extended H2S treatment with ADP for four and six days resulted in greater extent of adipogenesis, indicated by oil red O staining and lipid accumulation, in mouse preadipocytes. NaHS upregulated the expression of MCE genes (Cdc45, Mcm3, and Cdc25c) and Cdk2 protein expression under adipogenic induction (Fig. 5). H2S also activated MEK through its phosphorylation (Fig. 6). Akt and MEK phosphorylation paved the way for lipid accumulation and differentiation through PPAR transactivation [15], marking the terminal phase. Therefore, H2S increases adipogenesis by acting on both of its early and terminal phases.
In our previous study, we demonstrated that H2S causes PPAR S-sulfhydration in 3T3L1 cells [15]. Here, we confirmed that WT adipose tissue has higher C/EBPβ and PPAR expression than CSE-KO adipose tissues. Similarly, exogenous H2S increases C/EBPβ and PPAR expression in primary preadipocytes during the first two days of adipogenic induction. Adipogenic inducers such as insulin initiate MCE through the MAPK pathway, leading to enhanced activity of C/EBPβ [6,55]. C/EBPβ is a critical factor in initiating the transcriptional cascades that culminate in the expression of PPAR [6] and induce higher PPAR S-sulfhydration [15] and adipocyte differentiation. C/EBPβ can be activated through phosphorylation at Threonine-188 by MAPK (MEK/extracellularsignal-regulated kinase (ERK)) and Cdk2 within 24 h of adipogenic induction [6,15,56]. H2S treatment significantly upregulated the expression of Cdk2 and MEK in differentiating cells, resulting in the upregulated expression of C/EBPβ gene (Fig. 5(a)). Moreover, C/EBPβ stimulates clonal expansion genes that help in activating DNA helicase enzyme, which aids DNA replication.
Activation of C/EBPβ increases the expression of the important cell cycle genes Cdc45, Mcm3, Gins1, and Cdc25c. This increased gene expression can upregulate DNA replication in the preadipocytes, resulting in cell proliferation [54,55,57]. The cell cycle genes function through DNA helicase enzyme. The core of replicative DNA helicase is formed by six different polypeptides (Mcm2–7). Replicative helicase is activated by forming a complex with Cdc45 and the heterotetrameric Gins complex—the Cdc45- Mcm2–7-Gins (CMG) complex. Mcm3 is a component of the Mcm2–7 complex, whereas Gins1 is a go-ichi-ni-san (Gins) complex subunit [22,58,59]. Thus, the CMG complex regulates eukaryotic chromosomal DNA replication. Cdc25 is a phospho-tyrosine phosphatase that contributes to the S-phase and M-phase entry of the cells. The knocking out of these genes results in the inhibition of MCE in 3T3L1 preadipocytes [22,58–60]. This inhibitory effect proves that the genes mentioned above are critical downstream effectors of C/EBPβ to promote MCE.
Cdk2 is a crucial cell cycle regulator that controls clonal expansion through G1/S transitions. Using Cdk2 inhibitor (SU9516) to block the entry of preadipocytes into the S-phase, we prevented the clonal expansion of preadipocytes in the first three days (Fig. 7(a)). The lower clonal expansion resulted in a significantly low accumulation of triglycerides in adipocytes (Figs. 7(a) and (c)). This experiment proves that the Cdk2-regulated clonal expansion of preadipocytes is required for adipogenesis.
We demonstrated that H2S promotes the MCE process in the early stage of adipocyte differentiation, as evidenced by significantly upregulated Cdk2 and suppressed p27 levels. Moreover, H2S treatment significantly increased the expressions of all the other C/EBPβ target genes, except for Gins1 (Fig. 5(a)). The association of Gins and Cdc45 with Mcm2–7 improves the DNA affinity of the resulting complex, making it greater than that of the MCM complex alone [59]. Although the expression of Gins1 did not change in H2S-treated differentiating cells, the overall DNA helicase reaction due to the Mcm and Cdc45 genes increased significantly, thereby increasing DNA replication and MCE.
To prove that H2S induced MCE, we found that the proliferation of both differentiating and non-differentiating preadipocytes was increased by H2S, based on a BrdU incorporation assay and an MTT assay (Fig. 5(b)). The similar pro-proliferative effect of H2S has been reported in mesenchymal stem cells [28,61] and in other non-adipocytes, such as cardiac myocytes and umbilical vein endothelial cells [62–64]. Interestingly, the MTT assay shows that H2S increases living cell numbers only with adipogenic induction (Fig. 5(c)). While BrdU incorporation marks the extent of DNA duplication in the S-phase, the MTT assay detects the endpoint of cell viability. It is possible that adipogenic induction pushes the cells past all the checkpoints of cell cycle progression and that H2S increases the viability of these cells.
Fat mass expansion can occur by means of adipocyte hypertrophy or hyperplasia through de novo differentiation from progenitors [65]. In our cell cycle study, we found that H2S recruited additional preadipocytes through increased cell division, further adding lipid mass to the cells. MCE and hyperplasia are followed by the accumulation of lipid droplets in a multilocular pattern and terminal differentiation with adipocytes incorporating larger lipid droplets. By the end, the cells enlarge in size while accumulating lipid vacuoles that coalesce and eventually fill the cells [40,42]. The PI3-Akt pathway regulates lipid accumulation and adipogenesis (fat synthesis) in adipocytes [66–68]. In the terminal phase from day 2 to day 6, H2S promoted ADP-induced adipogenesis over time (Fig. 3). Furthermore, we found that H2S affects the insulin signaling pathway, which contributes to the initiation of MCE during adipogenesis as an initiator for cell cycle progression. Stimulation with insulin caused autophosphorylation of the β subunit of the Irβ (Fig. 6(a)). H2S also significantly stimulated the ADPinduced activation of MEK and Akt (Figs. 6(b) and (c)). These results strongly suggest that H2S with ADP improves insulin signaling by activating Irβ and the downstream signaling of MAPK and Akt. H2S alone, in the absence of ADP, could not phosphorylate Irβ because of the absence of insulin. Our results are consistent with those of Manna and Jain [69], who showed that H2S protected against insulin resistance in hyperglycemia in 3T3L1 cells. Vitamin D supplementation increased CSE activity, with higher H2S formation. The CSE/H2S system then activated the PI3/Akt pathway and glucose transporter 4 (GLUT4) translocation, thus increasing glucose utilization [69].
To summarize our findings (Fig. 8), H2S can increase adipocyte expansion and lipid accumulation in mouse adipocytes through increased adipogenesis, hypertrophy, and hyperplasia. Both endogenous and exogenous H2S increase the differentiation of mouse adipocytes through MEK- and Akt-regulated C/EBPβ/α and PPAR activation, as well as through the activation of C/EBPβ which is followed by upregulated MCE genes. Increased Cdk2 and decreased p27 expression by H2S resulted in increased cell cycle progression and hyperplasia. Finally, H2S increases the phosphorylation of Irβ, which is responsible for activating other target proteins downstream, such as Akt. Consequently, higher lipid accumulation in and hypertrophy of mouse adipocytes occur.
《Fig. 8》

Fig. 8. The complex and integrated role of H2S in adipogenesis, lipid accumulation, and adipocyte expansion, with underlying mechanisms.
《5. Conclusions》
5. Conclusions
Obesity is one of the leading causes of death worldwide, yet current therapies suffer from high failure rates due to other metabolic disorders associated with obesity. In order to decrease therapeutical failure, identifying the specific risk factors and pathogenic pivoting points for obesity is critical. Our study highlights the role of the CSE/H2S system in adipocyte-focused obesity development. A better understanding of the obesogenic properties of H2S will help in the design of novel and mechanism-based safe therapeutic approaches to target the H2S-induced transformation of preadipocytes to adipocytes (differentiation), pathogenic adipocyte enlargement (hypertrophy), and preadipocyte recruitment (hyperplasia). Future studies focusing on the role of H2S in insulin sensitivity during the adipogenic process are merited in order to offer more insight into H2S/CSE-related therapies against obesity.
《Acknowledgments》
Acknowledgments
This research was supported by Discovery Grants from the Natural Sciences and Engineering Research Council of Canada to Rui Wang and Lingyun Wu, respectively.
《Compliance with ethics guidelines》
Compliance with ethics guidelines
Richa Verma, Ming Fu, Guangdong Yang, Lingyun Wu, and Rui Wang declare that they have no conflict of interest or financial conflicts to disclose.


 京公网安备 11010502051620号


