

《1. Introduction》
1. Introduction
Chronic hepatitis B virus (HBV) infection is one of the main causes of chronic liver disorders. It is estimated that there are 296 million chronic hepatitis B (CHB) patients worldwide [1] and approximately 86 million CHB patients in China [2]. A considerable number of CHB patients will develop liver fibrosis and eventually progress to liver failure or hepatocellular carcinoma (HCC). Clinically, studies on antiviral therapy for CHB patients have provided convincing evidence of the regression of liver fibrosis [3,4]. Therefore, if CHB patients with liver fibrosis can receive timely and effective treatment, it is possible to achieve the reversal of liver fibrosis.
Among CHB patients, antiviral treatment initiation is based on liver histological progression, alanine aminotransferase (ALT) levels, and HBV DNA levels [5,6]. According to the guidelines for CHB patients, antiviral therapy is recommended for CHB patients with normal ALT levels (< 40 IU·L–1 ) if these patients have significant liver fibrosis [6,7]. Thus, if there are markers that can distinguish significant liver fibrosis (Ishak scores, ≥ F3) from early and no liver fibrosis (Ishak scores, < F3), it will help in deciding whether CHB patients with normal ALT levels need to receive treatment. Liver biopsy continues to be the gold standard for staging liver fibrosis. As an invasive measurement with some limitations, however, liver biopsy cannot be routinely performed in the clinic [8]. Therefore, noninvasive markers are urgently needed to assess the presence of significant liver fibrosis in CHB patients with normal ALT levels.
At present, the main noninvasive diagnostic tools for assessing liver fibrosis are imaging and serological parameter-based biomarkers. Imaging examinations mainly include ultrasound, computed tomography (CT), magnetic resonance imaging (MRI), and elastography, whose respective sensitivities and specificities for the diagnosis of cirrhosis have been found to be 82% and 80%, 77% and 68%, 85% and 100%, and 83% and 89%, respectively [9]. Ultrasound, CT, and MRI are traditional imaging methods that are widely used in clinical practice. However, these methods judge the degree of liver fibrosis qualitatively and their evaluation criteria are highly subjective, so they cannot be used to accurately stage the degree of liver fibrosis [9–11]. Transient elastography (TE) is a technique capable of noninvasively assessing liver stiffness [12]. However, the need for expensive equipment and trained operators, along with the numerous factors that influence measurement, may limit its clinical application [13]. Serum biomarkers, including the fibrosis index based on the four factors (FIB-4) and the aspartate aminotransferase (AST)-to-platelet ratio index (APRI), have been constructed for clinical use, but their diagnostic efficiency needs further investigation [9]. Imaging and serum markers of liver fibrosis have higher diagnostic accuracy for excluding cirrhosis; however, these noninvasive markers are not reliable for the accurate distinction of the stage of liver fibrosis, and they have poor diagnostic efficiency for early liver fibrosis [9–11,14]. Among CHB patients with normal ALT levels, the diagnostic value of imaging and serum markers for assessing liver fibrosis remains to be further investigated.
Glycosylation is an important post-translational protein modification. The biochemical environment may influence the level of glycosylation, and aberrant glycosylation modifications are associated with many diseases [15]. Studies have revealed that the structures and functions of serum N-glycans change significantly in different liver disease states. Callewaert et al. [16] developed a rapid, convenient, and high-throughput detection technique for serum N-glycan profiles, known as DNA sequencerassisted fluorophore-assisted carbohydrate electrophoresis (DSA-FACE). Subsequently, a serum N-glycan cirrhosis marker (GlycoCirrhoTest), fibrosis marker (GlycoFibroTest), and HCC marker (GlycoHCCTest) were developed for virus-infection-related hepatitis patients [17,18]. Our previous studies have demonstrated serum N-glycan markers to be promising noninvasive diagnostic tools for differentiating liver fibrosis, liver cirrhosis, and HCC [19–21]. However, no studies have explored the diagnostic efficiency of serum N-glycan models among CHB patients with normal ALT levels.
This study evaluated the diagnostic efficiency of serum N-glycan models in diagnosing significant liver fibrosis among 285 CHB patients with normal ALT levels and compared it with other liver fibrosis markers. We anticipate that this study will lead to the discovery of more reliable significant fibrotic markers for CHB patients with normal ALT levels. Since CHB patients with cirrhosis will need lifelong antiviral treatment, we also constructed diagnostic N-glycan models for liver cirrhosis differentiation. To the best of our knowledge, this is the first study to investigate serum N-glycan models for significant liver fibrosis and cirrhosis discrimination in CHB patients with normal ALT levels.
《2. Methods》
2. Methods
《2.1. Participants》
2.1. Participants
CHB patients were recruited from 33 hospital centers between 2013 and 2020. The inclusion criteria were as follows: ① hepatitis B surface antigen (HBsAg) positive for at least six months or pathological diagnosis of chronic HBV infection; ② HBV DNA positive; and ③ patients without antiviral therapy. The exclusion criteria were as follows: ① patients with elevated ALT levels (≥ 40 IU·L–1 ); ② patients with hepatitis A, C, D, and E virus infection or human immunodeficiency virus coinfection; ③ patients with other chronic liver diseases (nonalcoholic fatty liver, alcoholic liver disease, drug-induced liver damage, autoimmune hepatitis, and genetic liver diseases); ④ patients with unstable diabetes mellitus; or ⑤ patients taking any medications. In total, this study enrolled 285 treatment-naïve CHB patients with normal ALT levels (< 40 IU·L–1 ) (Fig. 1). Each patient signed an informed consent form before enrollment. This study was approved by the Ethical Committees of Peking University First Hospital and conformed to the ethical guidelines of the Declaration of Helsinki.
《Fig. 1》

Fig. 1. Patient-selection flowchart.
《2.2. Data collection and laboratory tests》
2.2. Data collection and laboratory tests
The hospital was responsible for collecting the demographic and clinical data of the CHB patients, including sex, age, body mass index (BMI), ALT, AST, alkaline phosphatase (ALP),  -glutamyl transpeptidase (GGT), platelet (PLT), α-fetoprotein (AFP), total bilirubin (Tbil), direct bilirubin (Dbil), and liver stiffness measurement (LSM) (FibroScan; Echosens, France). HBsAg, hepatitis B e antigen (HBeAg), antibody against hepatitis B core antigen (antiHBc), antibody against HBsAg (anti-HBs), and antibody against HBeAg (anti-HBe) were measured by means of enzyme immunoassays (Roche Diagnostics, Germany). Serum HBV DNA was detected using COBAS AmpliPrep/COBAS TaqMan (Roche Diagnostics, Germany), and the lower limit of detection value was 20 IU·mL–1 . If the HBV DNA level was higher than 1.7 × 10⁸ IU·mL–1 , the samples were diluted first and tested again.
The formulas for FIB-4 and APRI are as follows: FIB-4 = (age (years) × AST (IU·L–1 ))/(PLT count (109 L–1 ) × (ALT (IU·L–1 ))1/2); APRI = (AST (IU·L–1 )/upper limit of normal of AST)/PLT count (109 L–1 ) × 100.
《2.3. Liver histological examination》
2.3. Liver histological examination
The indications of liver biopsy included a serum HBV DNA level ≥ 2000 IU·mL–1 , ALT normal, and a long duration of disease ≥ 30 years. After obtaining informed consent from the enrolled patients (285 cases), an ultrasound-guided liver biopsy was performed according to the hospital’s standardized protocol. The liver tissue of the biopsy was fixed with formalin, embedded in paraffin, and stained with Masson’s trichrome, hematoxylin eosin, and reticular fibers. Histological evaluation of liver fibrosis and inflammation was performed independently and blindly by two pathologists. The consistency rate of the pathological interpretation between the two pathologists was greater than 90%. If the two pathologists had different interpretations of the biopsy for one patient, the results of the evaluation were determined under joint discussion with a third pathologist. Liver fibrosis stage was assessed using the Ishak scoring system (F0–F6). Inflammatory activity was evaluated according to the Ishak modified histology activity index (HAI; 0–18). Liver fibrosis stages were defined as no liver fibrosis (Ishak score, F0), early liver fibrosis (Ishak scores, F1 and F2), significant liver fibrosis (Ishak scores, F3 and F4), and cirrhosis (Ishak scores, F5 and F6) [22]. The degree of liver inflammation was defined as no significant inflammation (HAI < 9) or significant inflammation (HAI ≥ 9) [5]. Patients were considered to have significant liver histological changes if their liver fibrosis stage Ishak scores, ≥ F3 and/or the inflammatory activity HAI ≥ 9.
《2.4. Serum N-glycan detection》
2.4. Serum N-glycan detection
Serum N-glycan detection was performed as described previously [19]. First, the peptide N-glycosidase-F (PNGaseF; New England Biolabs, USA) was used to release the N-glycans in 2 μL of serum. Then, 8-aminonaphtalene-1,3,6-trisulphonic acid (APTS) (Invitrogen, USA) was added to label the free N-glycan, and neuraminidase (New England Biolabs) was added to remove the sialic acid. Finally, an ABI 3500 Genetic Analyzer (Applied Biosystems, USA) was used to measure the processed samples. Serum N-glycan profile data were analyzed using GeneMapper software version 4.1. Nine specific serum N-glycan peaks were obtained in each sample (Fig. 2), and the abundance of each peak was quantified by normalizing its height to the sum of the heights of nine peaks. This normalized approach helps to correct batch effects. We have studied the repeatability (i.e., coefficient of variation (CV)) of this method. We tested ten serum samples ten times, and the total CV value was less than 2%. When conducting the serum N-glycan analysis, the researchers were blinded to the demographic and clinical data of the enrolled patients.
《Fig. 2》
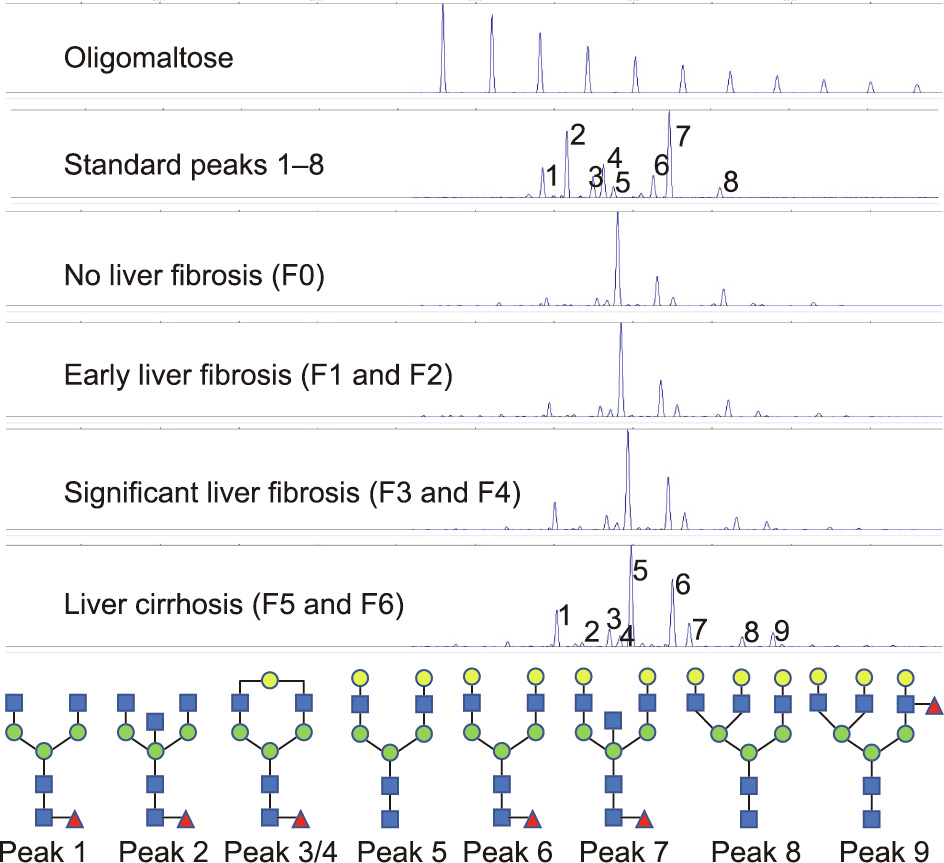
Fig. 2. Representative N-glycan peaks of different liver fibrosis stages and the structure of N-glycan peaks. Peak 1 indicates an agalacto core-α-1,6-fucosylated biantennary glycan (NGA2F); peak 2 indicates an agalacto core-α-1,6-fucosylated bisecting biantennary glycan (NGA2FB); peaks 3 and 4 indicate a single agalacto core-α-1,6-fucosylated biantennary glycan (NG1A2F); peak 5 indicates a bigalacto biantennary glycan (NA2); peak 6 indicates a bigalacto core-α-1,6-fucosylated biantennary glycan (NA2F); peak 7 indicates a bigalacto core-α-1,6-fucosylated bisecting biantennary glycan (NA2FB); peak 8 indicates a triantennary glycan (NA3); and peak 9 indicates a branching α-1,3-fucosylated triantennary glycan (NA3Fb).
《2.5. Statistical analysis》
2.5. Statistical analysis
Continuous variables are expressed as the mean ± standard deviation (SD), and Student’s t test or the Mann–Whitney test was used to conduct the comparative analysis. Categorical variables were expressed as counts and percentages, and the comparative analysis used the χ2 test. The analysis was stratified by age and sex, and the enrolled patients were randomly divided into training cohort (199 cases) and validation cohort (86 cases). Random forest (RF), support vector machine (SVM), and binary logistic regression (LR) analyses were used to construct serum N-glycan models based on the nine serum N-glycan peaks or independent predictors identified through multivariate LR analysis. The overall diagnostic value of the serum N-glycan models and other noninvasive fibrotic markers was assessed using receiver operating characteristic (ROC) curve analysis. At the best cutoff value, the sensitivity, specificity, positive predictive value (PPV), negative predictive value (NPV), and coincidence rate were calculated. The statistical analysis was conducted using SPSS 20.0 (SPSS, USA) and MATLAB R2016b (MathWorks, USA). The P values were adjusted using the Benjamini–Hochberg method, and an adjusted P (adj-P) value < 0.05 was considered to be statistically significant. All tests were two tailed.
《3. Results》
3. Results
《3.1. Demographic and clinical characteristics of patients》
3.1. Demographic and clinical characteristics of patients
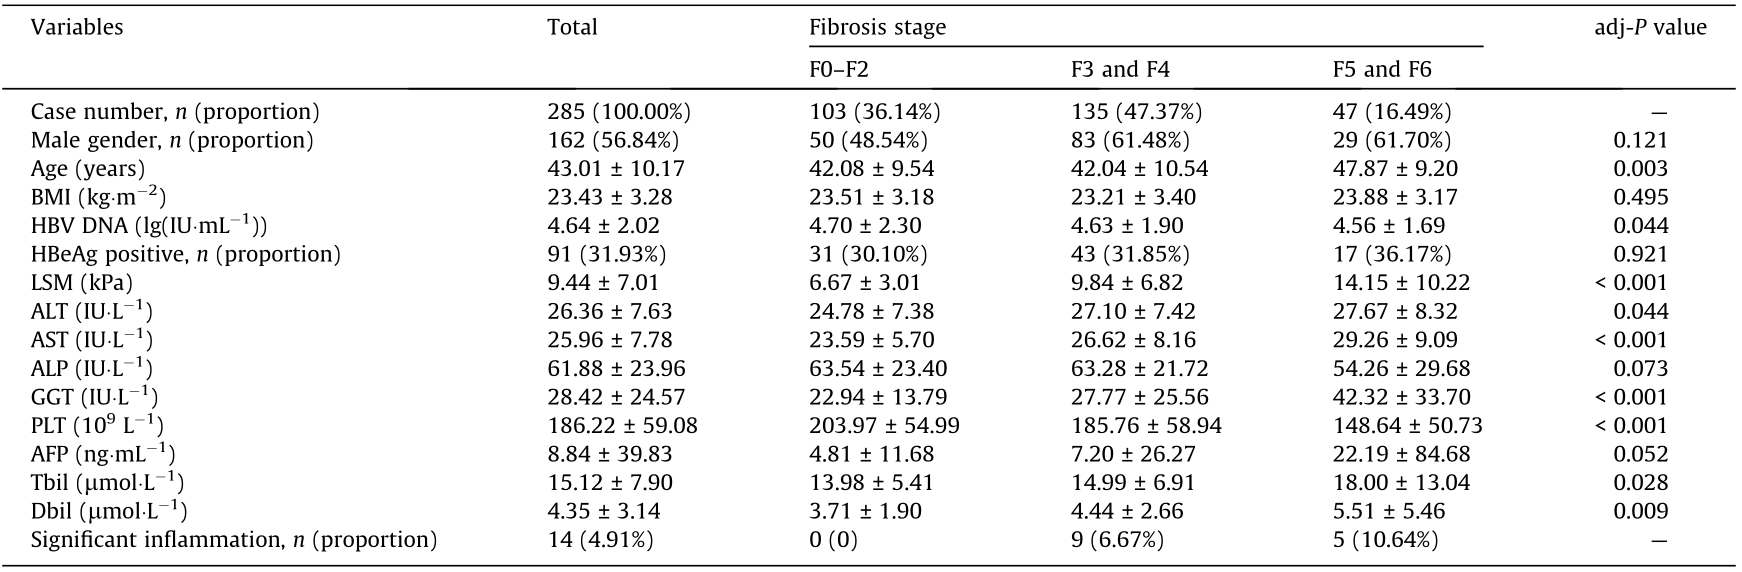
Table 1 summarizes the demographic and clinical characteristics of the 285 CHB patients with normal ALT levels. The liver biopsy results revealed that 63.86% of the patients had significant liver fibrosis (≥ F3), 16.49% had cirrhosis (≥ F5), 4.91% had significant inflammation (HAI ≥ 9), and 63.86% had significant liver histological changes. As shown in Table 1, age, LSM, ALT, AST, GGT, Tbil, and Dbil significantly increased with liver fibrosis stage, whereas HBV DNA and PLT significantly decreased with liver fibrosis stage.
《Table 1》
Table 1 Characteristics of 285 CHB patients with normal ALT levels in different liver fibrosis stages.
《3.2. Serum N-glycan profiles in different stages of liver fibrosis》
3.2. Serum N-glycan profiles in different stages of liver fibrosis
DSA-FACE technology was used to detect serum N-glycan profiles, and a total of nine N-glycan peaks were identified in the serum samples from each subject. The representative serum N-glycan profiles in different stages of liver fibrosis and the structures of all serum N-glycan peaks are presented in Fig. 2. The abundance of each peak was calculated by the ratio of the height of each peak to the sum of the heights of the nine peaks. Serum N-glycan profiling abundances and the discrepancies between different stages of liver fibrosis are shown in Table 2. All serum N-glycan profiling abundances significantly correlated with the liver fibrosis stages and changed significantly between different fibrosis stages. Peak 8 (NA3) and peak 5 (NA2) decreased with the liver fibrosis stage, while other N-glycan peaks increased with the liver fibrosis stage.
《Table 2》
Table 2 Serum N-glycan profiling abundances and differences between different fibrosis stages in CHB patients with normal ALT levels (mean ± SD).

《3.3. The development of serum N-glycan models》
3.3. The development of serum N-glycan models
The characteristics of the 285 CHB patients with normal ALT levels in the training and validation cohorts are shown in Table S1 in Appendix A; no significant difference was found between the two groups. The serum N-glycan RF and SVM models were developed using nine serum N-glycan peaks, and the LR models were constructed using the independent factors identified by the multivariate LR analysis. Serum N-glycan models, RF-A, SVMA, and LR-A were constructed for distinguishing significant liver fibrosis (≥ F3); and RF-B, SVM-B, and LR-B were constructed for distinguishing liver cirrhosis (≥ F5). The diagnostic efficiency of the serum N-glycan models was calculated by means of MATLAB and SPSS software. In distinguishing significant liver fibrosis from early and no liver fibrosis, the diagnostic area under the ROC (AUROC) curve of the RF-A and SVM-A models was 0.94 and 0.97, respectively, which was higher than that of the LR-A model (0.80). At the best cutoff value, the coincidence rates of the RF-A model (90.45% and 83.72%) and SVM-A model (89.45% and 81.40%) compared with liver biopsy were similar, and both were more efficient than the LR-A model (70.35% and 68.60%) in both the training and validation cohorts (Tables S2 and S3 in Appendix A). In the differentiation of liver cirrhosis, the diagnostic AUROC curve of the serum N-glycan RF-B (0.97) and SVM-B (0.99) models was also superior to that of the LR-B (0.77) model. At the best cutoff value, the coincidence rates of the serum N-glycan RF-B and SVM-B model compared with liver biopsy were 88.94% and 90.45%, respectively, in the training cohort; and the coincidence rates were 86.05% and 87.21%, respectively, in the validation cohort; which was more efficient than the LR-B model (62.81% and 58.14%) (Tables S2 and S3). The serum N-glycan RF and SVM models performed well in differentiating liver fibrosis stages in CHB patients with normal ALT levels. Serum N-glycan RF models were selected for comparison with other liver fibrosis diagnostic markers.
《3.4. Diagnostic efficiency of the constructed N-glycan models and other fibrotic markers》
3.4. Diagnostic efficiency of the constructed N-glycan models and other fibrotic markers
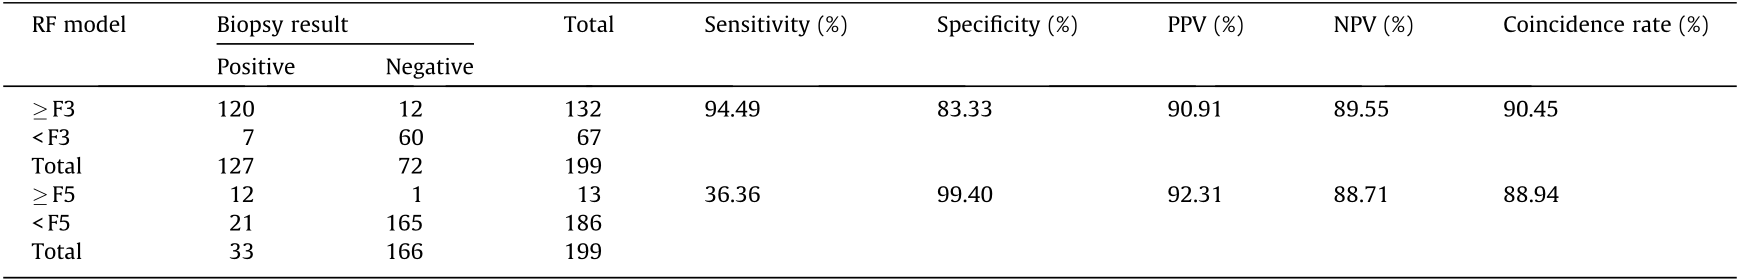
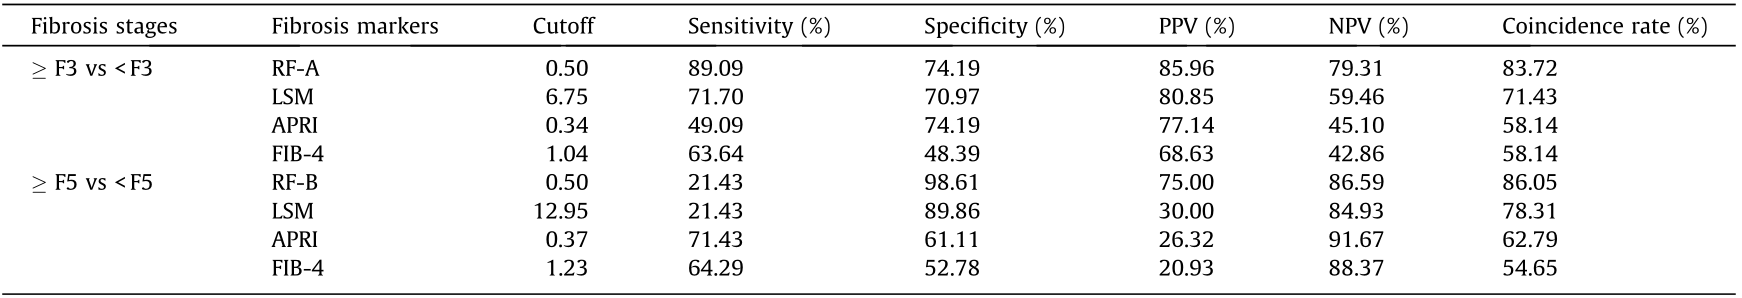
The diagnostic efficiency of the imaging and serum fibrotic markers LSM, FIB-4, and APRI were evaluated in this cohort. Among the CHB patients with normal ALT levels, the serum N-glycan RF-A model demonstrated good diagnostic efficiency when distinguishing significant liver fibrosis (≥ F3); the diagnostic AUROC curve was 0.94, which was higher than those of LSM (0.72), APRI (0.67), and FIB-4 (0.64) (Fig. 3(a)). The diagnostic sensitivity, specificity, PPV, NPV, and coincidence rate of the serum N-glycan RF-A model were 94.49%, 83.33%, 90.91%, 89.55%, and 90.45% (Table 3), respectively, at the best cutoff value. The diagnostic coincidence rate was higher than those of LSM (69.79%), APRI (60.80%), and FIB-4 (54.77%) (Fig. 3 and Table 4). In the validation cohort, the serum N-glycan RF-A model (83.72%) also showed a higher diagnostic coincidence rate than the LSM (71.43%), APRI (58.14%), and FIB-4 (58.14%) (Table 5). These results indicated that the serum N-glycan RF-A model was more efficient for differentiating significant liver fibrosis (≥ F3) in CHB patients with normal ALT levels.
In distinguishing cirrhosis, the AUROC curve of the serum N-glycan RF-B model was as high as 0.97, which was higher than those of LSM (0.73), APRI (0.76), and FIB-4 (0.79) (Fig. 3(b)). The diagnostic sensitivity, specificity, PPV, NPV, and coincidence rate of the serum N-glycan RF-B model were 36.36%, 99.40%, 92.31%, 88.71%, and 88.94% (Table 3), respectively, at the best cutoff value. The diagnostic coincidence rate of the serum N-glycan RF-B model was better than those of LSM (83.42%), APRI (65.83%), and FIB-4 (66.83%) (Table 4). The serum N-glycan RF-B model (86.05%) also showed the highest diagnostic coincidence rate in the validation cohort (Table 5).
《Fig. 3》

Fig. 3. ROC curve of serum N-glycan RF models and other fibrotic markers in CHB patients with normal ALT levels in the training cohort. (a) Differentiation of significant liver fibrosis; (b) differentiation of liver cirrhosis.
《Table 3》
Table 3 Predictive efficiency of serum N-glycan RF models in CHB patients with normal ALT levels in the training cohort.
《Table 4》
Table 4 Predictive value of serum N-glycan RF models and other fibrotic markers in CHB patients with normal ALT levels in the training cohort.

《Table 5》
Table 5 Predictive value of serum N-glycan RF models and other fibrotic markers in CHB patients with normal ALT levels in the validation cohort.
《4. Discussion》
4. Discussion
CHB remains an important global public health issue. Studies have revealed that effective treatment of CHB patients can stop the disease from progressing to cirrhosis and HCC. Among untreated CHB adult patients, the annual risk of progressing to HCC was found to be approximately 0.5% in patients without cirrhosis and 2%–3% in patients with compensated cirrhosis [23]. At present, the initial treatment of CHB patients is based on liver histological progression and levels of HBV DNA and ALT. An elevated ALT level is a major determinant of treatment initiation [5]. Antiviral therapy is also recommended for CHB patients with normal ALT levels if they have significant liver histological changes [5,6]. Among CHB patients with normal ALT levels, several studies have reported that 20.7%–53.2% of patients had significant liver fibrosis and/or significant inflammation [24–26]. One study enrolled 327 HBeAg-negative CHB patients and found that 53.2% of patients with normal ALT levels (≤ 40 IU·L–1 ) had significant liver fibrosis [27]. Our study found that 63.86% (182/285) of CHB patients with normal ALT levels had significant liver fibrosis, 16.49% (47/285) had cirrhosis, and 4.91% (14/285) had significant inflammation. In this study, the enrolled patients were outpatients or inpatients from 33 hospitals, and most of them were HBsAg-positive for more than 30 years. The patients were relatively older (mean age: (43.01 ± 10.17) years) and had a longer duration of disease. Therefore, the proportion of significant liver fibrosis and cirrhosis was relatively high. Sonneveld et al. [28] reported that, among CHB patients without signs of significant liver fibrosis, the possibility of significant inflammation was very low (3.6%) in patients with normal ALT levels, which was similar to the results of this study (0). These data support further evaluation of the presence of significant liver fibrosis in CHB patients with normal ALT levels, which will be helpful to determine whether such patients need antiviral treatment. Liver biopsy remains the gold standard for diagnosing liver fibrosis, but this operation may cause serious complications, including bleeding, pain, perforation, infection, and even death. The diagnostic accuracy of liver biopsy may also be affected by sampling errors, small samples, and histological evaluation [8]. Thus, among CHB patients with normal ALT levels, it is necessary to investigate noninvasive markers of significant liver fibrosis.
Glycosylation is one of the most common post-transcriptional protein modifications. Under the catalysis of glycosyltransferase, glycans covalently bind to proteins. When bound, glycans affect the proteins’ structure, function, stability, folding, half-life, trafficking, solubility, and interactions with other proteins [29]. Glycosylation and glycation are two major types of protein modification by carbohydrates. The main difference between N-glycosylation and glycation is that the former is an enzymatic reaction catalyzed by glycosyltransferase, whereas the latter is a non-enzymatic reaction in which free sugars covalently attach to proteins [30].
Glycomics is widely applied in the investigation and development of disease-related biomarkers [18]. The glycans in glycoproteins are involved in many key biological processes, such as receptor activation, molecular transport, cell adhesion, and signal transduction [31]. Glycoproteins are mainly derived from the liver. The asialoglycoprotein receptor and mannose/N-acetylglucosamine receptor play an important role in clearing aberrantly glycosylated proteins from the liver [32]. There is a significant correlation between the alteration of liver physiology or pathology and changes in serum N-glycan, so serum N-glycan biomarkers hold potential for the noninvasive assessment of different liver diseases [19,20]. High-performance serum glycome analysis technology (i.e., DSA-FACE) makes the extensive exploration and clinical application of glycobiology a reality [16].
Serum N-glycan profiling analysis has become feasible and reliable based on DSA-FACE technology. With the optimization of the detection method, the consumption of serum was reduced to 2 μL, and the detection time was shortened to 6 h. Our experiments and previous study revealed that serum N-glycan as a biomarker is stable with a very low CV value under certain stored conditions [33]. Studies have reported that the serum N-glycan models GlycoFibroTest (lg(peak2/peak8)) and GlycoCirrhoTest (lg(peak7/ peak8)) achieved good diagnostic value for the differentiation of liver fibrosis or cirrhosis; the GlycoFibroTest yielded an AUROC curve of 0.79 for the diagnosis of significant liver fibrosis in patients induced by HCV [17,18]. In our previous study, we constructed multiparameter diagnostic serum N-glycan models using peaks 1, 3, 4, and 8 (NGA2F, NG1A2F, and NA3) among 432 CHB patients, where the majority of the enrolled patients had elevated ALT levels [19]. The results indicated that serum N-glycan models can distinguish different liver fibrosis stages. The diagnostic AUROC curve of serum N-glycan model A was 0.890, which was better than those of GlycoFibroTest (AUROC: 0.538) and GlycoCirrhoTest (AUROC: 0.644) in the differentiation of significant liver fibrosis [19].
Previous studies have confirmed that the serum N-glycan model is a potential novel biomarker for the staging of liver fibrosis in CHB patients and have found that ALT levels may affect serum N-glycan profiles [18,19,33]. However, none of these studies explored the diagnostic performance of serum N-glycan biomarkers for significant liver fibrosis in CHB patients with normal ALT levels. In our study, 285 CHB patients with normal ALT levels were enrolled, and the diagnostic value of the serum N-glycan model for assessing significant liver fibrosis was explored. The results revealed that the diagnostic efficiency of the GlycoFibroTest, GlycoCirrhoTest, and the constructed serum N-glycan model A was not good enough. The diagnostic AUROC curve was lower than 0.80, at the best cutoff value, the diagnostic coincidence rate was lower than 75% in the training cohort and the validation cohort (data not shown). Therefore, more promising serum N-glycan models need to be constructed among CHB patients with normal ALT levels.
With the development of artificial intelligence technology, machine learning methods have been widely used in various fields to establish predictive models. As powerful classification methods, SVM and RF have been demonstrated to be successful in the field of biomedical research, such as for the prediction of protein structure, gene identification, and liver fibrosis staging [34,35]. One study consisted of 144 CHB patients and used machine learning methods to diagnose liver fibrosis using multiparameter ultrasound data [35]. The results revealed that RF and SVM were optimal algorithms for fibrosis staging with better performance (AUROC: 0.85) [35]. To construct ideal N-glycan models for significant liver fibrosis differentiation, RF, SVM, and LR analyses were conducted in our study. In distinguishing significant liver fibrosis, the diagnostic values of RF-A and SVM-A were similar, and both were more efficient than the LR-A model in the training cohort (Table S2). Due to statistical methods, the diagnostic efficiency of RF-A and SVM-A was slightly decreased in the validation cohort; moreover, they were better than the LR-A model (Table S3). To facilitate the subsequent comparative analysis, serum N-glycan RF models were selected for comparison with other diagnostic markers of liver fibrosis.
Recently, serum biomarkers, including FIB-4 and APRI, and the imaging marker LSM have been recommended as noninvasive alternatives for liver biopsy by ‘‘The guidelines of prevention and treatment for chronic hepatitis B (2019 version)” for China and the World Health Organization (WHO) [7]. Serum biomarkers include direct and indirect markers, where direct serum biomarkers mainly reflect extracellular matrix turnover and indirect biomarkers are associated with liver damage [36]. Based on indirect serum biomarkers, serological diagnosis models have been constructed for liver fibrosis staging in recent years for clinical use [37]. However, inflammatory flares, immune activity, and variable natural history may affect the reliability of the current serum markers [38]. TE is a representative noninvasive imaging technique used to quantitatively evaluate the stages of liver fibrosis. Apart from a few influencing factors, such as ALT levels, ascites, obesity, narrow intercostal space, and measurement sites [39], TE has important clinical application value in assessing liver cirrhosis [40]. One study reported that the diagnostic value of LSM is superior to those of FIB-4 and APRI for assessing liver fibrosis in patients with persistently normal ALT levels; the main reason was the impact of liver inflammation and necrosis [41]. In the present study, the diagnostic efficiency of LSM, FIB-4, and APRI was assessed and compared with that of serum N-glycan models in CHB patients with normal ALT levels. In both the training cohort and the validation cohort, the diagnostic value of serum N-glycan RF-A was higher than those of LSM, FIB-4, and APRI in predicting the presence of significant liver fibrosis (Tables 4 and 5). These results indicate that the serum N-glycan RF-A model is a potential diagnostic marker for significant liver fibrosis in CHB patients with normal ALT levels and is superior to the currently used imaging and serum markers (LSM, FIB-4, and APRI).
CHB patients with cirrhosis require long-term treatment. Studies have shown that antiviral therapy for CHB patients with cirrhosis can result in sustained virologic suppression and histologic improvement [42]. In the present study, 16.49% of CHB patients had cirrhosis. Early diagnosis and effective treatment of CHB patients with cirrhosis will be of great benefit. Therefore, we constructed and evaluated the performance of a serum N-glycan model and compared it with those of other fibrotic markers for the exclusion of cirrhosis. The results showed that the diagnostic efficiency of serum N-glycan RF-B was superior to those of LSM, FIB-4, and APRI (Tables 4 and 5) in both the training cohort and the validation cohort. Thus, the serum N-glycan RF model provides a simple and more accurate alternative for assessing cirrhosis in CHB patients with normal ALT levels.
《5. Conclusions》
5. Conclusions
In this study, serum N-glycan models were shown to be innovative and promising diagnostic markers for assessing significant liver fibrosis and cirrhosis in CHB patients with normal ALT levels; moreover, they were found to be superior to the currently used imaging and serum markers (LSM, FIB-4, and APRI). In the future, a larger scale prospective longitudinal study is required to carry out independent and extended validation. With the development of DSA-FACE technology, the availability of more convenient diagnostic kits will promote the wide application of serum N-glycan markers, which will be helpful for deciding whether CHB patients with normal ALT levels need antiviral treatment.
《Acknowledgments》
Acknowledgments
We thank Dr. Yuwen Zhou (Sysdiagno (Nanjing) Biotechnology Company Limited, Nanjing, China) for providing technical consulting assistance in statistical analysis.
This study was supported by the Major Science and Technology Special Project of China Thirteenth Five-year Plan (2018ZX10732401-003-015), and the National Science and Technology Major Project (2013ZX10002005 and 2017ZX10203202).
《Compliance with ethics guidelines》
Compliance with ethics guidelines
Lei Xu, Lei Wang, and Cuiying Chen are from Sysdiagno (Nanjing) Biotechnology Company Limited. Lin Wang, Yiqi Liu, Qixin Gu, Chi Zhang, Xueen Liu, Hong Zhao, and Hui Zhuang declare that they have no conflicts of interest or financial conflicts to disclose.
《Appendix A. Supplementary material》
Appendix A. Supplementary material
Supplementary data to this article can be found online at https://doi.org/10.1016/j.eng.2023.03.008.


 京公网安备 11010502051620号


