

《1. Introduction》
1. Introduction
Autoimmune diseases affect 5%–10% of the global population [1,2], and there is substantial evidence to indicate a steady rise in the frequency of such diseases in recent decades. Despite significant progress in managing these patients, the clinical remission rate is less than 50%, and tailored therapeutic approaches are still lacking [3]. Therapies for autoimmune diseases are expected to be more efficacious at the earliest and mildest stages; therefore, early and precise diagnosis is associated with higher remission rates. However, biomarkers with both high sensitivity and specificity are currently lacking.
Systemic lupus erythematosus (SLE) is a common autoimmune disease with heterogeneous clinical manifestations [4–6]. It often shares similar symptoms with other systemic autoimmune diseases, such as rheumatoid arthritis (RA), primary Sjögren’s syndrome (pSS), and systemic sclerosis (SSc) [7,8], making it difficult to differentiate SLE patients from patients with these other autoimmune diseases. Moreover, current autoantibodies used to classify SLE, such as antinuclear antibody (ANA), anti-doublestranded DNA (dsDNA) antibody, and anti-Smith (Sm) antibody, are also associated with other autoimmune diseases and inflammatory conditions (e.g., anti-dsDNA antibody was first detected in the late 1930s in patients with bacterial infections [9]); thus, these autoantibody biomarkers have low specificity (< 60%) for SLE [10]. Consequently, identifying ideal indicators for distinguishing SLE from easily confused diseases is important for early diagnosis and avoiding irreversible target organ damage.
The differences in the affinity of antibodies are affected by the crosstalk of the immunoglobulin G (IgG) fragment crystallizable (Fc) domain and corresponding Fc receptors (FcRs), which further leads to distinct immunological responses [11]. In the Fc domain of IgG, there is a conserved N-glycosylation site [11]. The N-glycans linked to this site are highly diverse [12], and their structures change in response to biological and environmental triggers as well as disease conditions—especially autoimmune diseases such as SLE [13]. The glycan chain maintains the quaternary structure and the stability of the Fc [14,15]. The oligosaccharides on IgG also present glycan epitopes for lectin binding [16]. More importantly, the Fc glycans are required for optimal binding of the antibody to all classes of receptors that are expressed on leukocytes, including macrophages, eosinophils, neutrophils, natural killer cells, and lymphocytes [17]. IgG glycosylation has a great impact on a variety of pathways, including antibody-dependent cell cytotoxicity (ADCC), complement (C3a or C5a)-dependent cytotoxicity (CDC), antibody-dependent cellular phagocytosis (ADCP), and other forms of receptor-mediated immunoregulation [18]. Modifications of Fc glycans impact antibody function by shifting the balance of Type I and Type II Fc gamma receptors (Fc R) and subsequently modulate the effector cells and functions that can be recruited during immune activation [19]. Therefore, Fc glycans play central roles in immune homeostasis. Dysregulation in Fc glycan modifications can result in the loss of immune tolerance, autoimmune diseases, and susceptibility to infectious diseases [20].
Due to the central roles of N-glycans in autoimmune diseases, altered glycosylation of serum IgG in SLE holds great promise as a potential biomarker for SLE diagnosis. However, due to technical limitations, no highly specific diagnostic N-glycan biomarkers for classifying SLE have been identified in previous studies [21]. In our laboratory, an in-depth glycomic approach has been developed based on a specialized microfluidic TiO2–porous graphitised carbon (PGC) chip [22]. This approach permits the quantification of lowabundance and trace acidic glycans that are often biologically important [22]. In the current study, we adopted this in-depth glycomic approach for the analysis of serum IgG from 389 SLE patients and 304 age- and sex-matched healthy controls (HCs) to identify serum N-glycan diagnostic indicators of SLE with high capacity.
《2. Methods》
2. Methods
《2.1. Subjects》
2.1. Subjects
2.1.1. Subjects with SLE, RA, pSS, and SSc, and HCs at four hospitals in China
Subjects with SLE were enrolled from Peking University People’s Hospital (Beijing, China) (n = 226), the First Teaching Hospital of Tianjin University of Traditional Chinese Medicine (Tianjin, China) (n = 82), and Guangdong General Hospital (Guangzhou, China) (n = 81). Subjects with pSS were enrolled from Peking University People’s Hospital (n = 30), the First Teaching Hospital of Tianjin University of Traditional Chinese Medicine (n = 15), and Guangdong General Hospital (n = 4). Subjects with SSc were enrolled from Peking University People’s Hospital (n = 23) and Guangdong General Hospital (n = 3). Subjects with RA were enrolled from the First Teaching Hospital of Tianjin University of Traditional Chinese Medicine (n = 33). HCs were enrolled from Zhuhai Hospital of Integrated Traditional Chinese and Western Medicine (Zhuhai, China) (n = 270), Peking University People’s Hospital (n = 50), Guangdong General Hospital (n = 42), and First Teaching Hospital of Tianjin University of Traditional Chinese Medicine (n = 48). All subjects provided informed consent, and ethical approval was obtained from the local institutional committee of the relevant hospitals (2015PHB219-01).
2.1.2. Patients with SLE
A total of 389 patients with SLE and 304 HCs from six independent cohorts (including a training dataset and five validation datasets) were analyzed in this study. The average disease duration for the SLE patients was five years. The training dataset consisted of 133 patients with SLE and 89 HCs. The average age of the individuals with SLE was (37.3 ± 13.0) years, which was comparable with that of the HCs ((37.9 ± 13.4) years). The dataset comprised 91.7% and 92.1% female patients with SLE and female HCs, respectively. The first validation dataset consisted of 58 patients with SLE and 39 age- and sex-matched HCs; the second validation dataset consisted of 36 patients with SLE and 36 age- and sex-matched HCs; the third validation dataset consisted of 53 patients with SLE and 50 age- and sex-matched HCs; the fourth validation dataset consisted of 59 patients with SLE and 42 age- and sex-matched HCs; and the fifth validation dataset consisted of 50 patients with SLE and 48 age- and sex-matched HCs. All patients with SLE met the 1997 revised classification criteria of the American College of Rheumatology (ACR) [23]. Detailed information on the SLE patients and HCs is provided in Dataset S1 in Appendix A.
2.1.3. Patients with RA
Samples of patients with RA (n = 33) who met the 2010 ACR/ European League Against Rheumatism (EULAR) classification criteria for RA and age- and sex-matched HCs (n = 32) were also enrolled [24]. Detailed information is provided in Dataset S2 in Appendix A.
2.1.4. Patients with pSS
In total, 49 patients with pSS and 49 age- and sex-matched HCs were enrolled in this study, as shown in Dataset S2. The pSS patients were classified according to the 2016 ACR/EULAR classification criteria for pSS [25].
2.1.5. Patients with SSc
A total of 26 patients with SSc and 25 age- and sex-matched HCs were also enrolled, as shown in Dataset S2. The SSc patients were classified according to the ACR/EULAR criteria for SSc [26].
Human serum samples were obtained from the hospital following the same protocol. All samples were stored at –80 °C prior to use.
《2.2. Analysis of IgG N-glycans》
2.2. Analysis of IgG N-glycans
To isolate the IgGs, 50 μL of prewashed Protein A Sepharose 4 Fast Flow beads (GE Healthcare, Sweden), 250 μL of binding buffer, and 10 μL of serum were added to a 96-well filter plate. After the samples were incubated at room temperature for 15 min on a shaker, they were centrifuged at 1000 revolutions per minute (rpm) for 5 min. The retained beads were then washed twice using 250 μL of binding buffer. Subsequently, we eluted the IgGs twice with 200 μL of elution buffer into a new V-bottom collection plate, followed by neutralization with 30 μL of neutralizing buffer. Next, the obtained IgG sample was concentrated using a 30 K centrifuge filter unit after buffer exchange. We collected 50 μg of IgG from each patient sample and diluted it with 100 mmol·L–1 ammonium bicarbonate buffer to a final concentration of 1 μg·μL–1 , and then added 0.5 μL PNGase F (New England Biolabs, USA). After incubating at 37 °C for 16 h, the enzymatic reaction samples were loaded onto the preconditioned C18 cartridge, and the released N-glycans were eluted with 1.0 mL of distilled water. The flow-through and water eluates were combined and dried using a speed vacuum, followed by reconstitution in 100 μL of distilled water before analysis. Subsequently, quantitation of the N-glycans was performed using our well-established TiO2–PGC chip triple-quadrupole mass spectrometry (QQQ-MS; Agilent, USA) method. Chromatographic separation of the N-glycans was achieved on an Agilent 1260 Infinity HPLC Chip LC system with a customized TiO2–PGC chip. Quantitation of the N-glycans was performed on an Agilent 6490 iFunnel QQQ-MS using a multiple reaction monitoring (MRM) method in positive mode.
《2.3. Glycosyltransferase measurement》
2.3. Glycosyltransferase measurement
The glycosyltransferases relevant to the identified biomarkers— that is, N-acetylglucosaminyltransferase I (GnTI), GnTII, GnTIII, GnTIV, GnTV, sialyltransferase (ST), α-manase (αM), fucosyltransferase 8 (FUT8), and galactosyltransferase (GalT)—were measured using commercially available enzyme-linked immunosorbent assay (ELISA) kits according to the manufacturer’s instructions (Meimian Biotech, China).
《2.4. Statistical analysis》
2.4. Statistical analysis
For the glycomic analysis, we detected the levels of each N-glycan using the MRM technique, which is valued for its reliable quantitation of analytes in complex mixtures. In the MRM method, the target compound is detected via two selection steps (selecting the precursor ions and the product ions) that filter out coeluting background ions, resulting in high detection sensitivity. In this case, the major error with multiple injections arises from the variation in signal response (reflected as the peak area) obtained at different acquisition times. Such variation is generally corrected by using normalization or standardization methods. In our analyses, we calculated the relative abundance of each individual N-glycan for further statistical analysis, which was calculated according to the following equation:
Relative abundance of individual glycan = (Peak area of individual glycan=Sum of peak area of all glycans) × 100%:
Relative abundance itself is a type of normalized value that can help eliminate variations with multiple testing, and such normalized abundance is widely used in glycomic studies.
Two-sided p values < 0.05 in the Wilcoxon rank-sum test were considered to indicate statistical significance. Continuous variables are presented as the mean ± standard deviation (SD). The sample size was not determined in advance using statistical methods. All data points were included in the analysis. Methodologically, we employed different feature-evaluation measurements in our implementations of WEKA software to prevent chance findings, including the correlation evaluator, gain ratio evaluator, information gain evaluator, and relief-F evaluator in the feature-selection method, as well as different classification methods, such as logistic regression (LR) and a support vector machine. The LR model demonstrated the best performance and was therefore the main model chosen for this study. The ComBat method [27] (implemented in the R package ‘‘SVA” [28]) was applied to adjust for batch effects using an empirical Bayes framework. The classification performance of the identified N-glycan biomarkers was assessed using receiver operating characteristic (ROC) curve analysis (implemented in the ‘‘pROC” [29] package in R) for individual markers and the combination of predictors, and the diagnostic value of the N-glycan biomarkers was evaluated on the basis of areas under the curve (AUC). Cutoff values were set according to the maximum values generated using the formula (sensitivity + specificity – 1) in our analyses. The 95% confidence intervals (95% CIs) for the AUC as well as the sensitivity and specificity based on the ROC curves were obtained using the method proposed by DeLong and colleagues [30]. In addition, p values were corrected for multiple testing by setting the false discovery rate at 0.05. All statistical analyses were performed using RStudio version 1.0.153 (RStudio incorporated corporation, USA).
《3. Results》
3. Results
《3.1. Characteristics of IgG glycans in SLE》
3.1. Characteristics of IgG glycans in SLE
We carried out glycan analyses of serum IgG from 389 SLE patients and 304 age- and sex-matched controls using a wellestablished in-depth glycomic approach based on a TiO2–PGC chip coupled with time-of-flight mass spectrometry (TOF-MS) and QQQ-MS [22] (Table S1 in Appendix A). Patients who met the ACR 1997 revised criteria for SLE [23] were recruited. The initial cohort contained 133 SLE patients and 89 matched controls recruited through a multicenter collaboration, while subsequent validation cohorts comprised 256 SLE patients in four validation sets (Table S1).
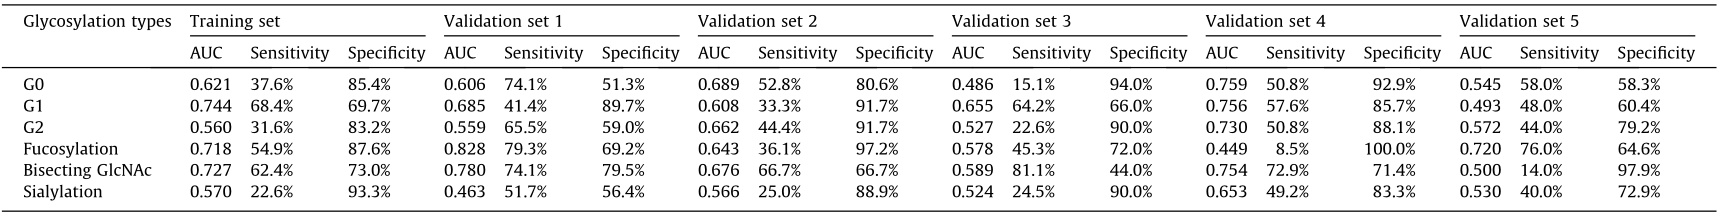
A total of 114 distinct compositions of IgG glycans—namely, 53 neutral and 61 acidic N-glycans—were characterized for SLE patients. The abundances of agalactosylated glycans (G0), monoagalactosylated glycans (G1), and di-agalactosylated glycans (G2) were detected in a training set and five validation sets. Results showed that these glycans were altered in SLE patients that substantially consistent with a previous publication (Table 1 and Figs. S1–S3 in Appendix A) [21]. A reduction in fucose on the innermost β-N-acetyl glucosamine (GlcNAc) and an increase in bisecting GlcNAc, both of which contribute to activation of the immune response, were also observed in SLE patients (Table 1 and Figs. S4 and S5 in Appendix A) [19,31]. In the present study, IgG sialylation showed a decreased tendency in SLE patients comparing to the HCs (Table 1 and Fig. S6 in Appendix A).
《Table 1》
Table 1 Classification capacity of IgG glycosylation types for SLE patients.
《3.2. A panel of N-glycan biomarkers for the classification of SLE patients》
3.2. A panel of N-glycan biomarkers for the classification of SLE patients
It has been reported that αM-II deficiency induces an autoimmune disease in mice that is similar to human SLE [32], suggesting that specific N-glycan biomarkers are likely to be present in SLE patients. To identify individual N-glycan biomarkers for SLE, we used the correlation-based feature subset selection method (CfsSubsetEval) in WEKA software to select informative N-glycans. Four neutral and eight acidic N-glycans were primarily characterized as potential biomarkers for the classification of SLE in the training set (SLE patients, n = 133; HCs, n = 89). These 12 biomarkers were then individually used to generate a diagnostic model using LR to evaluate their sensitivities and specificities. According to ROC curve analysis, the sensitivity values of the 12 N-glycans varied from 46.6% to 83.5%, the specificity values ranged from 67.4% to 100.0%, and the AUC values ranged from 0.702 to 0.895 (Table S2 in Appendix A). Highly significant differences (p < 0.0001, Wilcoxon rank-sum test) were found in all of the identified N-glycan biomarkers in SLE patients versus HCs (Fig. S7 in Appendix A). We further examined the classification capability of the 12 N-glycan biomarkers for SLE patients in five validation cohorts (validation set 1: SLE patients, n = 58; HCs, n = 39; validation set 2: SLE patients, n = 36; HCs, n = 36; validation set 3: SLE patients, n = 53; HCs, n = 50; validation set 4: SLE patients, n = 59; HCs, n = 42; and validation set 5: SLE patients, n = 50; HCs, n = 48) (Table S2). The results were consistent with those from the training set. Two of the 12 biomarkers, 4_4_1_0-a and 4_3_1_1-b (Figs. 1(a) and (b)), were demonstrated to have elatively high prediction capacity for SLE. Both of the glycans had relatively high AUC (0.765–0.902), sensitivities (72.9%– 87.9%), and specificities (75.0%–88.1%) (Figs. 1(c) and (d)). Biomarker 4_4_1_0-a was found to be significantly decreased in SLE patients, while biomarker 4_3_1_1-b was significantly increased (p < 0.0001), in comparison with those in the HCs (Figs. 1(e) and (f)). A combination of these two N-glycan biomarkers showed higher AUCs, sensitivities, and specificities in the training and validation sets (Table S2).
《Fig. 1》
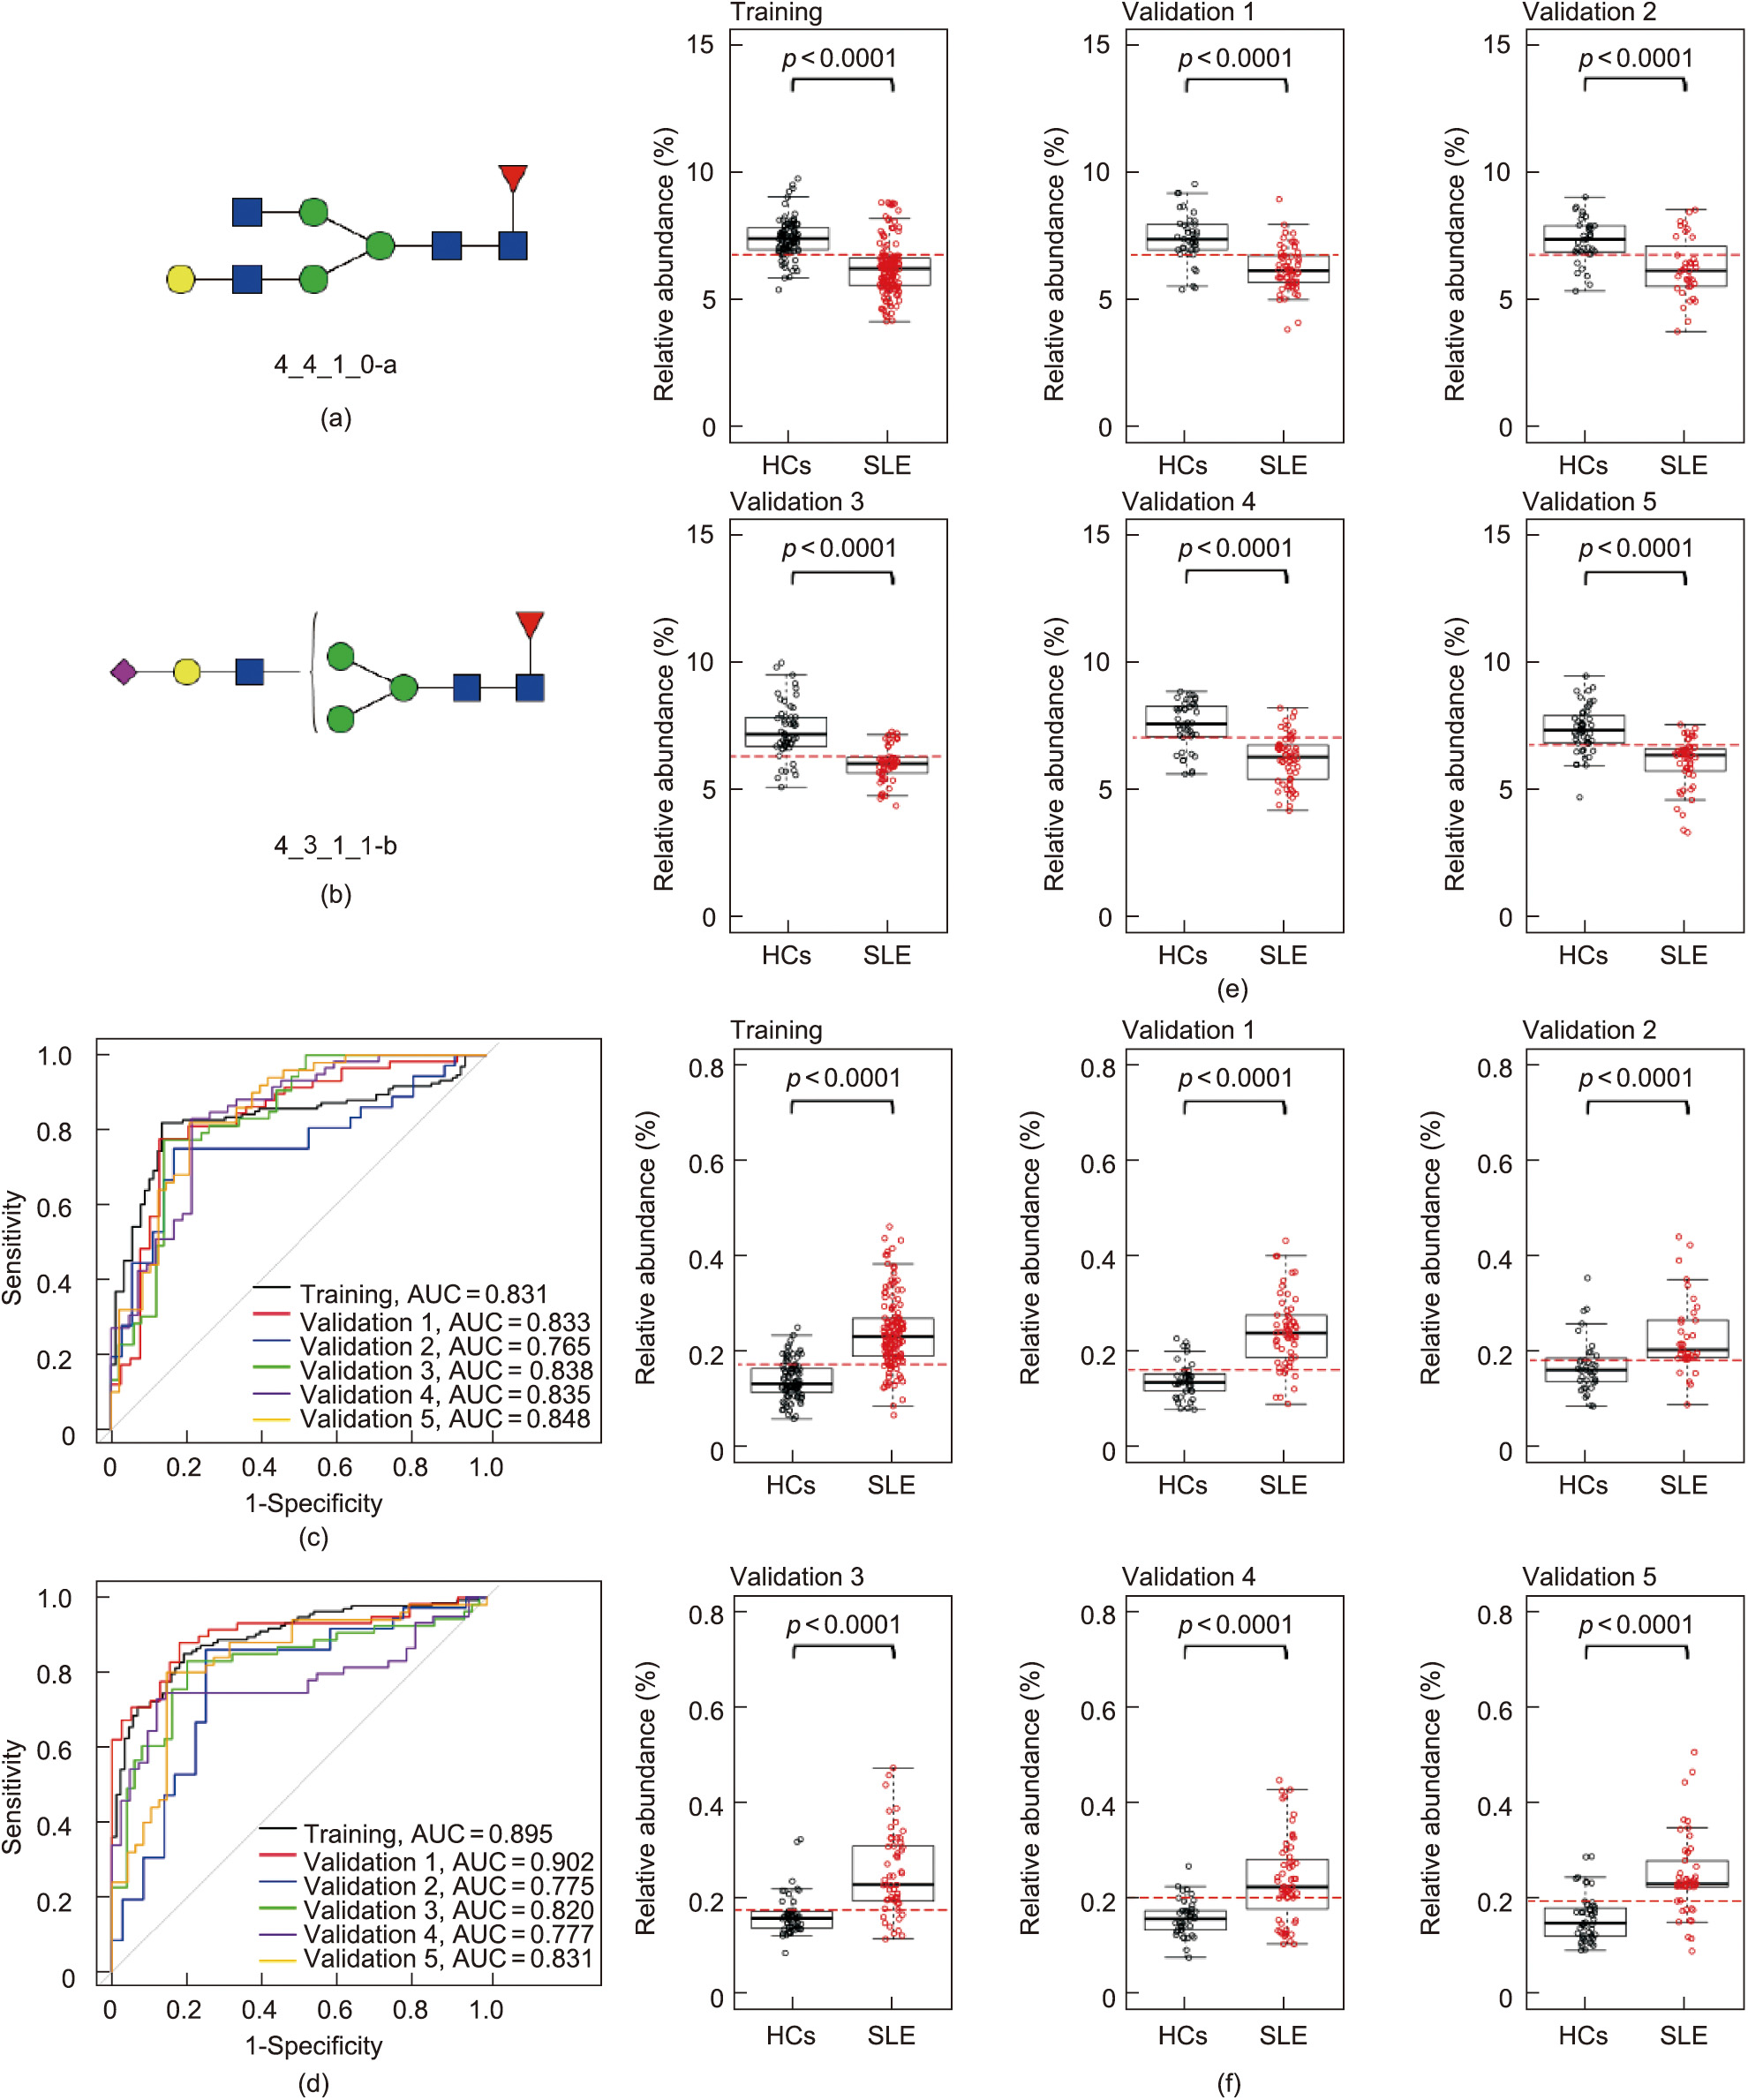
Fig. 1. Classification performance and relative abundances of two potential N-glycan biomarkers for SLE. (a, b) Structure of N-glycan biomarkers identified, (a) 4_4_1_0-a and (b) 4_3_1_1-b, for SLE classification in the current study. (c, d) ROC curves of (c) 4_4_1_0-a and (d) 4_3_1_1-b for the classification of SLE and HCs. (e, f) Relative abundance boxplots of (e) 4_4_1_0-a and (f) 4_3_1_1-b in SLE patients and HCs.
《3.3. Roles of N-glycans in disease differentiation》
3.3. Roles of N-glycans in disease differentiation
To further confirm the specificities of these two N-glycan biomarkers, we detected changes in their levels in patients with other common systemic autoimmune diseases that share high sensitivity for ANA [33], such as RA, pSS, and SSc. Serum samples from patients with RA, pSS, and SSc; and age- and sex-matched HCs were tested using TiO2–PGC chip QQQ-MS method (Tables S3, S4, and S5 in Appendix A). Although alterations in IgG glycosylation have been suggested to be linked to the development of RA, pSS, and SSc [34,35], the individual N-glycans altered in these diseases were found to be different from those in SLE. First, the abundance of two biomarkers for SLE—namely, 4_4_1_0-a and 4_3_1_1-b, did not show significant changes in RA (Figs. 2(a) and (b)), pSS (Figs. 2(c) and (d)), or SSc (Figs. 2(e) and (f)) patients compared with the respective HCs and accordingly exhibited low capacity for classifying RA, pSS, and SSc (Table S6 in Appendix A). The specific N-glycan biomarkers for RA, which were identified in our previous studies [22], are distinct from the SLE biomarkers. We also identified high-performance N-glycan biomarkers for pSS and SSc, which are structurally different from the biomarkers for SLE (Figs. S8 and S9 in Appendix A) and RA. These findings suggest that the glycosylation profiles of IgGs are differentially altered in different rheumatological conditions.
《Fig. 2》

Fig. 2. Relative abundances of two potential SLE N-glycan biomarkers in RA, pSS, and SSc. (a, b) Relative abundances of glycans (a) 4_4_1_0-a and (b) 4_3_1_1-b in RA patients and corresponding HCs. (c, d) Relative abundances of the two potential N-glycan biomarkers in pSS patients and corresponding HCs. (e, f) Relative abundances of the two potential N-glycan biomarkers in SSc patients and corresponding HCs.
《3.4. Analysis of the association between the identified IgG N-glycan biomarkers and clinical phenotypes of SLE》
3.4. Analysis of the association between the identified IgG N-glycan biomarkers and clinical phenotypes of SLE
The complement system plays a dual role in SLE: It both mediates pathogenesis and prevents disease progression [36,37]. It has been reported that N-glycosylation alterations can promote the production of proinflammatory mannose-dependent glycan ligands, which activate and cleave complement 3 (C3) and C4 [38]. We therefore analyzed the correlation of the two N-glycans with multiple SLE phenotypes. Consistent with previous reports, 4_3_1_1-b was significantly upregulated in patients with low levels of C3 and C4, whereas 4_4_1_0-a was not (Figs. 3(a) and (b)). Notably, 4_3_1_1-b, a sialylated IgG glycan, was also upregulated along with the increasement of the erythrocyte sedimentation rate (ESR) (Fig. 3(c)), an indicator with the ability to predict disease activity. This finding is not consistent with a report that increasing sialylated IgG glycans attenuates autoantibody-initiated inflammation [39] . Thus, our finding suggests that topological structure information over sialylation may influence the IgG function. Several sialylated glycans—including glycan peak 17 (GP17), GP19, and GP21—have also been reported to increase in SLE patients [21] .
《Fig. 3》
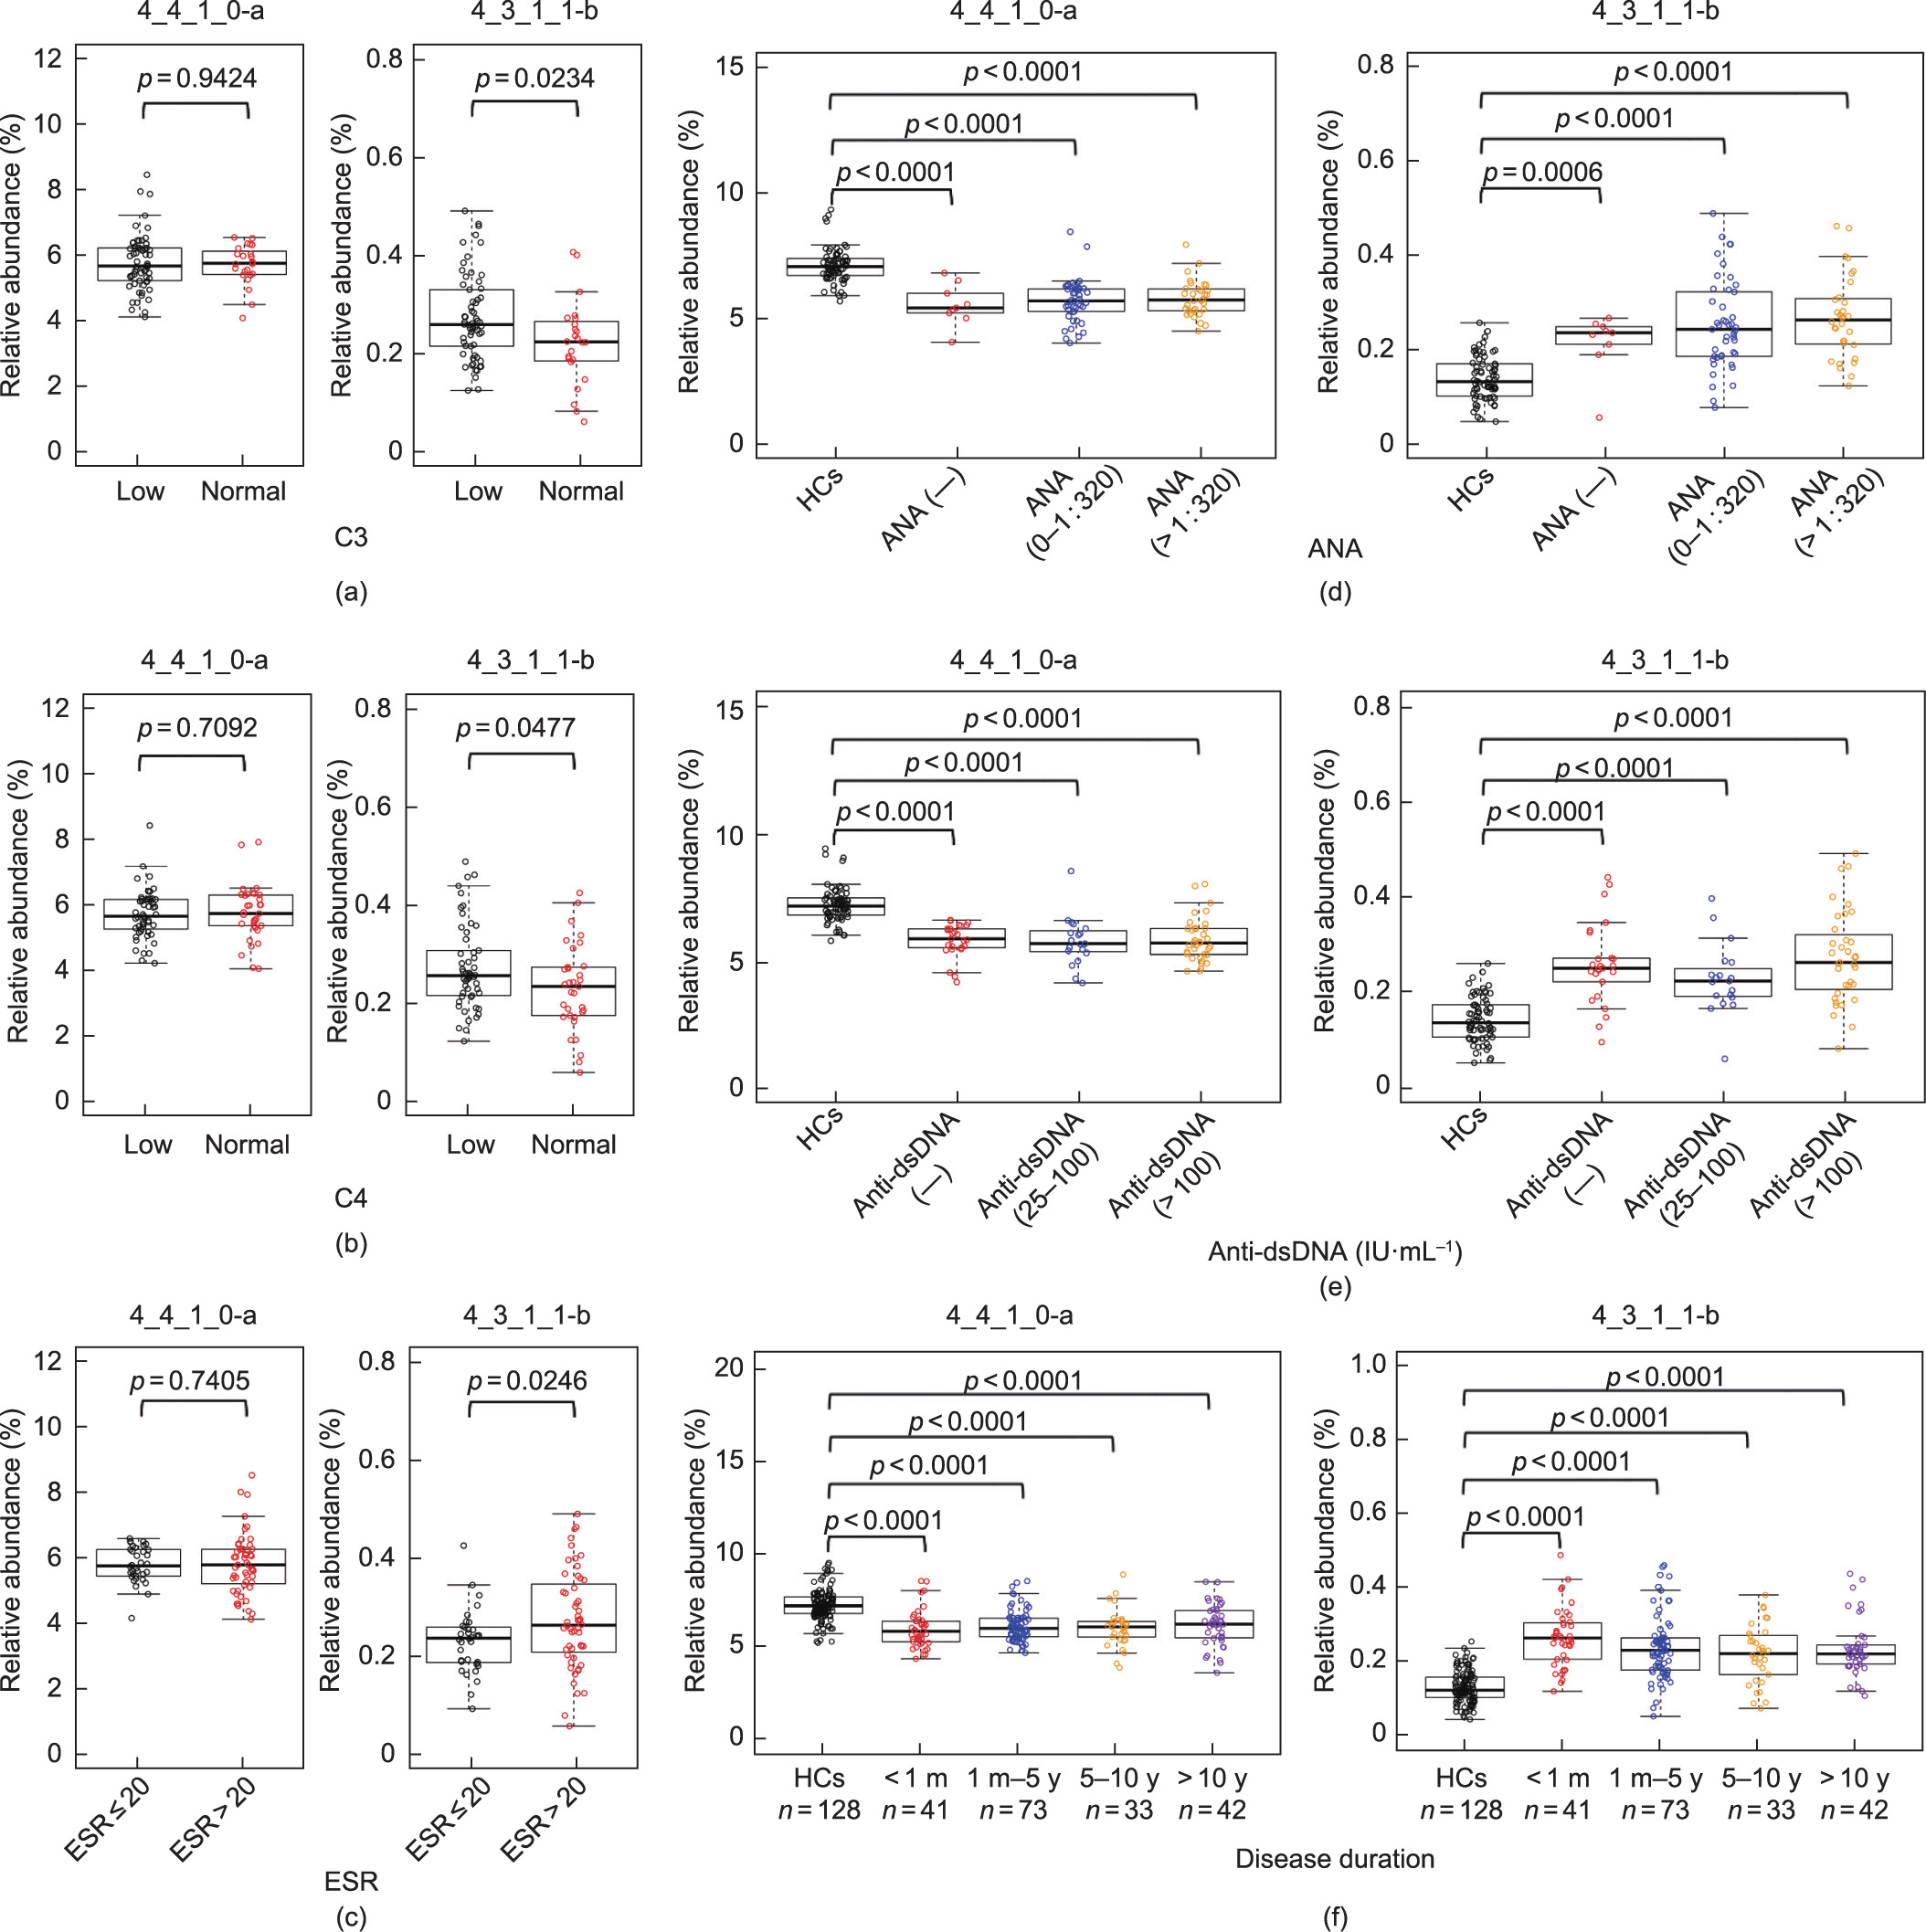
Fig. 3. Correlation analysis between the two identified N-glycan biomarkers and the disease phenotypes. (a) Performance and relative abundances of the two glycans in SLE patients with low (< 0.79 g·L–1) or normal C3 levels. (b) Performance and relative abundances of the two glycans in SLE patients with low (< 0.16 g·L–1) or normal C4 levels. (c) Performance and relative abundances of the two glycans in SLE patients with a normal (≤ 20 mm·h–1 ) or high (> 20 mm·h–1 ) ESR. (d) Performance and relative abundances of the two glycans in SLE patients with negative, low (≤1:320), or high concentrations (> 1:320) of ANAs. (e) Performance and relative abundances of the two glycans in SLE patients with negative, low (25–100 IU·mL–1 ), or high concentrations (>100 IU·mL–1 ) of anti-dsDNAs. (f) Relative abundances of the two glycans in SLE patients with different disease courses (< 1 month (m), 1 m–5 year (y), 5–10 y, or > 10 y).
No correlations were observed between the identified glycan biomarkers (4_4_1_0-a and 4_3_1_1-b) and titers of serum autoantibodies, including ANA (Fig. 3(d)), anti-dsDNA (Fig. 3(e)), anti-ribonucleoprotein (anti-RNP) (Fig. S10 in Appendix A), and anti-Sm (Fig. S10), suggesting that these glycans are autoantibody-independent diagnostic biomarkers that may act as ‘‘on and off” switches or as ‘‘analogue regulators” in the pathogenesis of SLE. Furthermore, no organ specificity was observed in this study (Fig. S11 in Appendix A). Thus, these two N-glycan biomarkers are likely related to the common systematic mechanisms for triggering SLE.
We also divided the patients into four subgroups based on disease duration—namely, newly diagnosed (< 1 month; n = 41), from 1 month to 5 years (n = 73), from 5 to 10 years (n = 33), and longer than 10 years (n = 42)—and compared the relative abundances of the two identified N-glycans in patients with different courses of disease. Both N-glycans 4_4_1_0-a and 4_3_1_1-b showed significant differences compared with the HCs, regardless of the disease duration (Fig. 3(f)). The relative abundance of glycan 4_4_1_0-a in the newly diagnosed SLE patients was similar to that in patients with long disease courses (Fig. 3(f)). No significant differences in glycan 4_3_1_1-b were detected between the samples from the newly diagnosed SLE patients and those with long disease courses (Fig. 3(f)), indicating that the two glycans can serve as diagnostic biomarkers for SLE patients with various disease durations.
《3.5. Determination of the locations of the identified N-glycan biomarkers on IgG》
3.5. Determination of the locations of the identified N-glycan biomarkers on IgG
To further confirm the site of the two N-glycan biomarkers, we digested IgG to generate F(ab’)2 and Fc/2 fragments using FabRICATOR (IdeS; Genovis, USA) and then separated IgG-F(ab’)2 and IgG-Fc using an IgG-Fc affinity matrix (ThermoFisher, USA) and an IgG-heavy chain constant domain 1 (CH1) affinity matrix (ThermoFisher). Sodium dodecyl sulfate–polyacrylamide gel electrophoresis (SDS-PAGE) showed that F(ab’)2 and Fc/2 were fully separated. The N-glycans released from the isolated Fc and F(ab’) 2 were analyzed. The neutral N-glycan (4_4_1_0-a) was detected on the Fc fragment, while the acidic N-glycan (4_3_1_1-b) was primarily detected on the Fc fragment. A small amount of 4_3_1_1-b was found on the IgG-F(ab’)2 fragment (approximately 14% of the corresponding glycans on the Fc fragment) (Fig. S12 in Appendix A).
To determine the functional correlation between the N-glycans and SLE, we developed an MRM method to detect subclass and site-specific glycopeptides with high sensitivity. In total, 83 IgGFc-derived glycopeptides from human serum were identified [40]. Of the 12 potential SLE-related N-glycans, a total of six were identified in the Fc region. Notably, the two high-performance N-glycan biomarkers (4_4_1_0-a and 4_3_1_1-b) were confirmed to be attached to the IgG-Fc region by glycopeptide analysis using ultra-high-performance liquid chromatography quadrupole TOFMS (UHPLC-Q-TOF-MS) (Fig. 4).
The IgG-Fc glycopeptides G1F (4_4_1_0) and 1111 (4_3_1_1) were quantified using UHPLC-QQQ-MS. Glycopeptides derived from the G1F (4_4_1_0) glycoform of different IgG subclasses were detected, while the glycopeptide-derived 1111 (4_3_1_1) glycoform was detected only for the IgG2 and IgG3 subclasses (Fig. 4).
《Fig. 4》
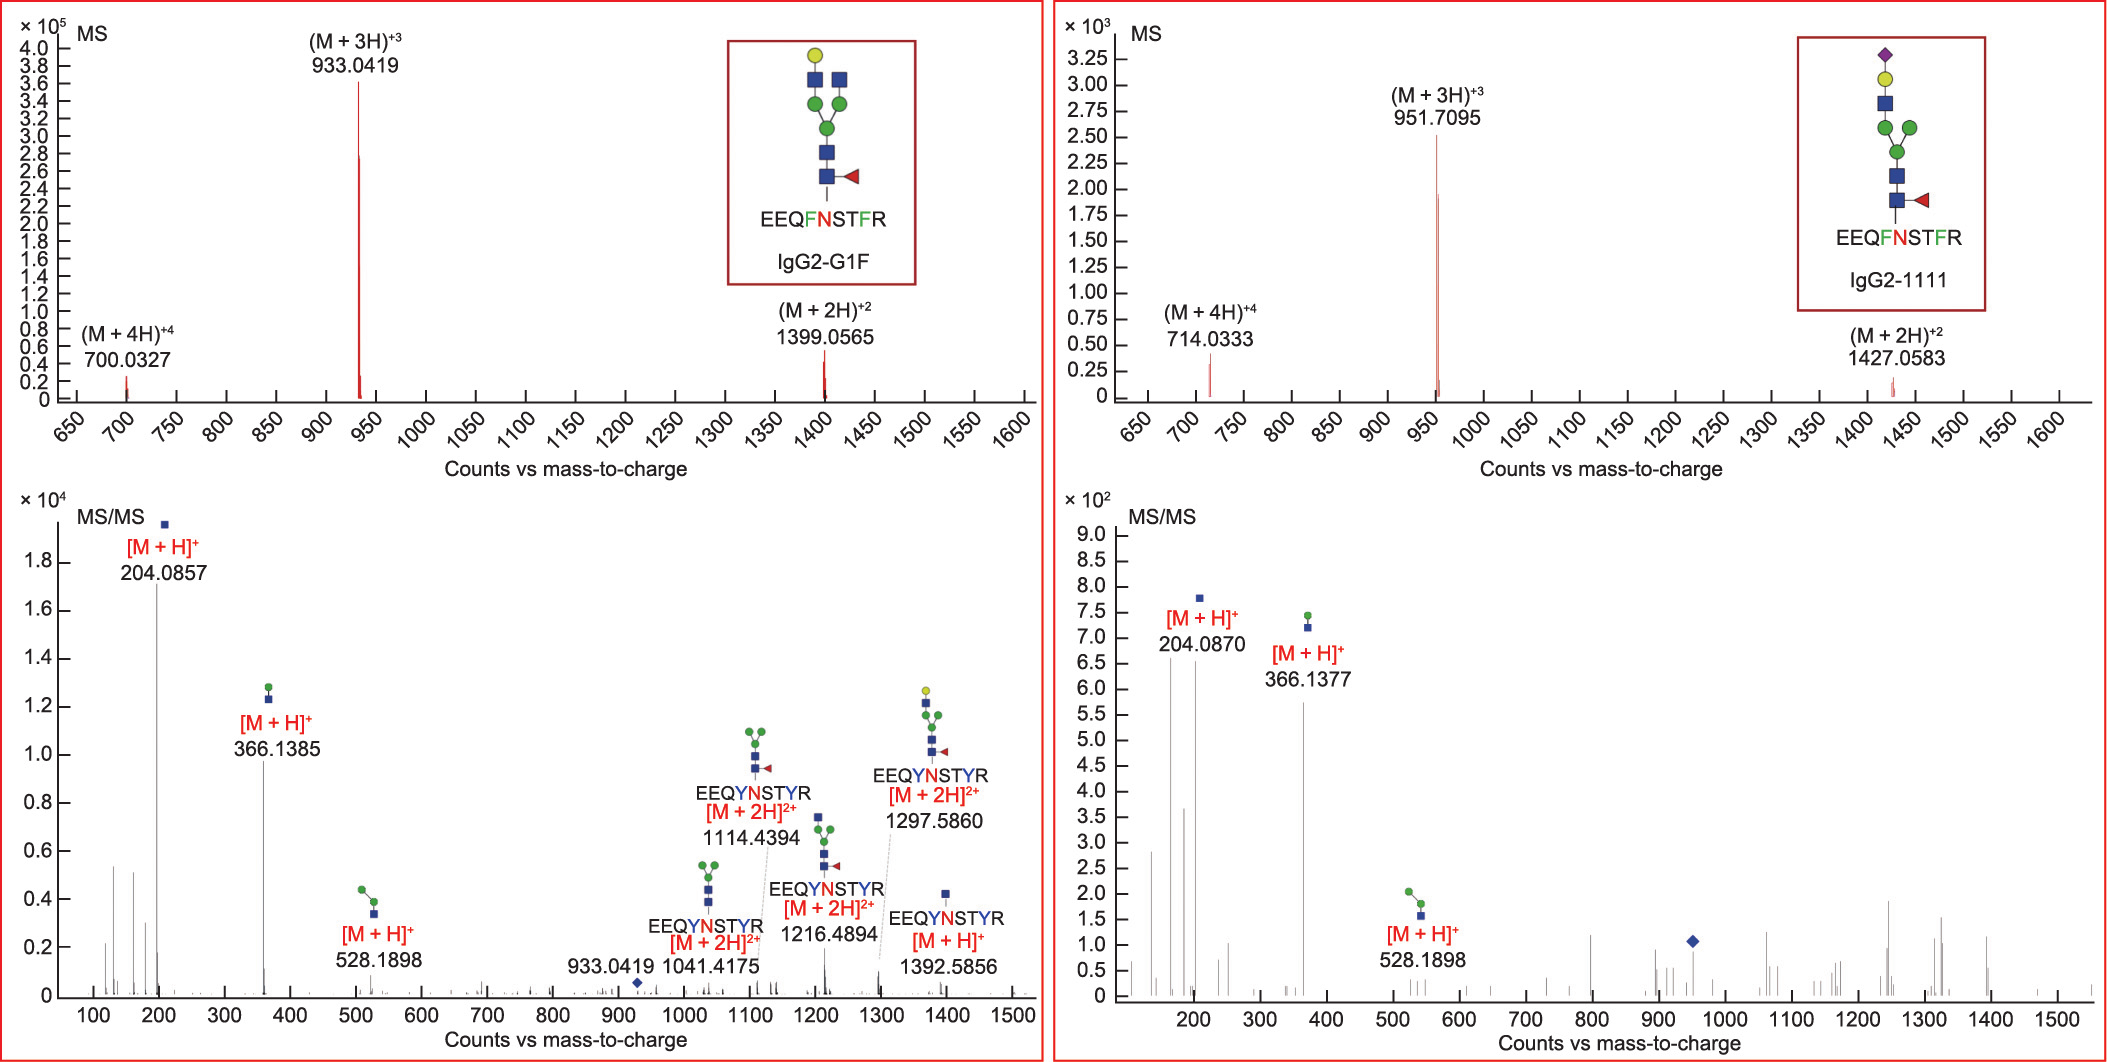
Fig. 4. Mass spectrometry (MS) and tandem mass spectrometry (MS/MS) spectra of glycopeptides of the two high-potential N-glycan biomarkers (4_4_1_0-a and 4_3_1_1-b) on IgG2. Monosaccharide symbols are based on the Consortium for Functional Glycomics. Blue square: N-acetylglucosamine; yellow circle: galactose; green circle: mannose; red triangle: fucose; purple diamond: N-acetyl neuraminic acid.
《3.6. Functional roles of N-glycans in SLE》
3.6. Functional roles of N-glycans in SLE
Although the causation between altered glycans and disease onset remains unclear, several genes that are linked to the composition of the IgG glycome, including IKZF1, BACH2, and HLA-DQA2, have been identified in genome-wide association studies of SLE [41]. The mutation of a single gene that encodes αM-II results in a systemic autoimmune disease similar to human SLE and leads to the production of proinflammatory mannosedependent glycan ligands [32]. Moreover, N-glycan levels in aMII-deficient mice are altered, as evidenced by a reduction in complex-type N-glycans and the induction of specific hybrid-type N-glycans [32,42]. Therefore, we examined the alterations in hybrid and complex glycans. The accumulation of hybrid-type N-glycans and the reduction of complex-type N-glycans (Fig. 5(a)) were observed, indicating that the transformation of hybrid-type N-glycans into complex-type N-glycans is inhibited in SLE patients. Moreover, we examined the alterations in glycosyltransferases in SLE patients, and the results showed that serum GnTII levels significantly decreased, while the levels of GnTI, GnTV, FUT8, and GalT significantly increased in SLE patients. GnTIII, GnTIV, ST, and αM levels were not significantly changed (Fig. 5(b)).
《Fig. 5》

Fig. 5. Potential functional correlation between N-glycans and SLE. (a) Alterations in hybrid-type N-glycans and complex-type N-glycans in SLE. (b) Differences in glycosyltransferases in SLE patients compared with HCs (SLE, n = 48–53; HCs, n = 27–37).
《4. Discussion》
4. Discussion
SLE presents with a variable clinical phenotype. Regardless of the advances that have been made in understanding SLE, no single clinical, laboratory, or pathological feature can be used as a gold standard for disease classification or diagnosis [43]. Accumulated evidence indicates that protein glycosylation is closely correlated to the pathogenesis of SLE. Native circulating total IgG complexes from active SLE patients usually have exposed fucosyl residues, which are accessible to soluble lectins [44]. The fucosylation of anti-dsDNA IgG1 is significantly correlated with SLE disease activity [45]. αM-II deficiency diminishes complex-type N-glycan branching, increases hybrid-type N-glycan structures, and induces an autoimmune disease in mice that is similar to human SLE [42]. Bisecting N-acetylglucosamine in the total IgG N-glycome also has a positive correlation with SLE [46]. These results suggest that the glycosylation of IgG holds potential for use as a disease diagnostic biomarker and affects the pathogenesis of SLE.
Our findings demonstrate the diagnostic capacity of N-glycans in SLE. Patients with vague or atypical manifestations may benefit from an assessment of the two identified N-glycan biomarkers (4_4_1_0-a and 4_3_1_1-b) that have high specificity and sensitivity for diagnosing SLE, which may ultimately contribute to controlling the development of the disease and reducing mortality. Glycan 4_3_1_1-b was found to be significantly upregulated in patients with low levels of complement, suggesting its potential roles as an inflammatory indicator. No correlations were found among the selected glycans and organ specificity or titers of serum autoantibodies, including ANA, anti-dsDNA, anti-RNP, and anti-Sm, indicating that these glycans are autoantibody-independent diagnostic markers for SLE. Our results also support the hypothesis that each rheumatic disease is most likely associated with specific N-glycan changes, as has been observed in our previous studies of RA, ankylosing spondylitis, and psoriatic arthritis [22,47].
The N-glycan composition of the Fc domain of IgG can modulate antibody effector functions by affecting the binding capacity of Fc to various Fc receptors (e.g., Fc Rs) [48]. Dysregulation in Fc glycosylation can lead to loss of immune tolerance and symptomatic autoimmunity [49]. Thus, the altered N-glycans located in the Fc region may result in the changed binding of IgG to FcRs in SLE, thereby affecting the development of the disease. In this work, we determined that the two specific SLE N-glycan biomarkers are mainly attached to the IgG-Fc region. In addition, we demonstrated the inhibition of GnTII in SLE patients for the first time and showed the resulting altered N-glycan profile, thus providing new insight into the disease pathogenesis. However, there is still much to elucidate regarding the exact functions of specific N-glycans in SLE, as glycoforms of IgGs are extremely variable. Advances in glycoengineering may provide a useful strategy for producing glycan-defined and site-selectively modified antibodies for further functional studies [50], and more functional experiments (e.g., the enzymatic glycan remodeling of intact antibodies) are required to elucidate the associations between the N-glycan biomarker and the pathogenesis of SLE.
Although the alteration of IgG glycosylation in autoimmune disease has been established for nearly 40 years, it remains a major challenge to translate the current knowledge of IgG glycosylation into general clinical practice. One of the main reasons for this difficulty is the great complexity of the glycomes of even a single protein, especially the presence of numerous low-abundance but highly bioactive glycans. Our group has developed an in-depth glycomic approach based on a microfluidic TiO2–PGC chip, which facilitates the sensitive detection of low-abundance, trace, and even ultra-trace glycan species. This technique greatly improves the ‘‘depth” of the glycomic analysis of serum IgG, and thus allows for the discovery of diagnostic, treatment-response, and prognostic biomarkers that present as low-abundance species. Once specific glycans in the disease are identified, efforts in the preparation or biosynthesis of the specific glycans and corresponding testing kits will enable more widespread use of glycosylation as disease biomarkers.
《5. Conclusions》
5. Conclusions
This study identified the potential clinical significance of serum N-glycan biomarkers for the differentiation of SLE from similar autoimmune diseases, such as RA, SSc, and pSS, which may provide insights into efficient population screening for potential pathological factors of SLE.
《Acknowledgments》
Acknowledgments
The authors thank the doctors from Peking University People’s Hospital, First Teaching Hospital of Tianjin University of Traditional Chinese Medicine, Guangdong General Hospital, and Zhuhai Hospital of Integrated Traditional Chinese and Western Medicine for their valuable help in undertaking this study.
This work was financially supported by grants from the Macau Science and Technology Development Fund (0003/2019/AKP, 0094/2018/A3, and 0010/2020/A1), Guangdong Basic and Applied Basic Research Foundation (2020B1515130005), and Guangdong– Hong Kong–Macau Joint Lab on Chinese Medicine and Immune Disease Research, Guangzhou University of Chinese Medicine (2020B1212030006).
《Authors’ contribution》
Authors’ contribution
Conceptualization, Liang Liu, Wei Liu, and Zhanguo Li; methodology, Hudan Pan, Jingrong Wang, Yong Liang, Canjian Wang, and Hua Zhou; data analysis, Canjian Wang and Yong Liang; sample collection, Hudan Pan, Wei Liu, Hua Ye, Xiao Zhang, Yuanhao Wu, Zhi Li, Miao Shao, Ruijun Zhang, Yao Xiao, Guangfeng Zhang, and Xiaoshuang Wang; writing, Hudan Pan and Jingrong Wang; manuscript revision, Liang Liu and Jingrong Wang; supervision, Liang Liu; funding acquisition, Liang Liu.
《Compliance with ethics guidelines》
Compliance with ethics guidelines
Hudan Pan, Jingrong Wang, Yong Liang, Canjian Wang, Ruimin Tian, Hua Ye, Xiao Zhang, Yuanhao Wu, Miao Shao, Ruijun Zhang, Yao Xiao, Zhi Li, Guangfeng Zhang, Hua Zhou, Yilin Wang, Xiaoshuang Wang, Zhanguo Li, Wei Liu, and Liang Liudeclare that they have no conflict of interest or financial conflicts to disclose.
《Appendix A. Supplementary data》
Appendix A. Supplementary data
Supplementary data to this article can be found online at https://doi.org/10.1016/j.eng.2023.01.006.


 京公网安备 11010502051620号


