

《1. Introduction》
1. Introduction
Ketodeoxynononic acid (Kdn) is a deaminated neuraminic acid that is widely distributed among bacteria and vertebrates [1]. Kdn is part of the structurally highly diverse sialic acid monosaccharide family [2]. Since its first discovery in rainbow trout eggs, it has been found on a broad range of glycoconjugates including glycolipids, N- and O-linked glycoproteins, and capsular polysaccharides, in diverse linkages (α2,3, α2,4, α2,6, and α2,8) [3–6]. It has been suggested that the attachment of Kdn to the cortical alveolar polysialoglycoprotein of rainbow trout eggs, which occurs in an α2,8-linkage to the non-reducing terminal N-glycolylneuraminic acid (Neu5Gc) in O-glycans, is a capping reaction that prevents bacterial sialidases from hydrolyzing the oligo/ polysialic acid chains, implying that Kdn plays an important role in the early embryonic development of salmonid fish [7]. Later research suggests that the various linkages of Kdn are ‘‘chain stoppers” that control the extent of the chain elongation of sialyl groups during the biosynthetic process of sialyl groups [8]. In addition, stage- and site-specific expression of different Kdn-containing gangliosides was observed in the spermatogenesis of rainbow trout, indicating that Kdn-containing gangliosides may play an important role in this process [9,10]. Kdn is also considered to be an important sialic acid component of skin mucus and other organs of fish [1,11]. Moreover, the presence of Kdn in the cell wall polymers of pathogenic Streptomyces strains suggests that Kdn is involved in an early stage of the attachment of pathogenic bacteria to host plant cells, causing scab disease of potatoes and root crops [12,13].
In contrast to its biosynthesis in bacteria and most vertebrates, the biosynthesis of Kdn is inactivated in most mammals by the substitution of a threonine for a methionine at position 42 of the cytosolic protein N-acetylneuraminic acid 9-phosphate synthase (Neu5Ac-9-P synthase) [14], which is the key enzyme for the synthesis of Kdn. It is known that the activity of this cytosolic protein is restored independently for the synthesis of Kdn 9-phosphate in two mammalian lineages: artiodactyla and primates (including humans) [14,15]. As a result, Kdn can still be produced in humans, albeit at low concentrations, as the activity of Neu5Ac-9-P synthase in the production of Kdn is much lower than its activity in the production of N-acetylneuraminic acid (Neu5Ac) [16].
Various studies have reported on the presence of Kdn as a free monosaccharide in mammals [17–19], with only small amounts occurring as cytidine monophosphate (CMP)-Kdn [17] or being conjugated to glycolipids and glycoproteins [20]. Kawanishi et al. [14] demonstrated that the production of Kdn is linked to the ingestion of mannoses leading to an increased excretion of free Kdn in urine. It was also reported that serum levels of free Kdn were significantly elevated in patients with end-stage renal disease, compared with healthy volunteers [14]. Moreover, elevated levels of the free Kdn monosaccharide and CMP-Kdn were found in ovarian tumor tissues and in ascites cells when compared with normal controls [17]. Similarly, substantial amounts of free Kdncontaining N-glycans were found in human prostate cancer (PCa) tissues [21].
Several studies have investigated the presence of protein- or lipid-linked Kdn. Typical amounts of free and conjugated Kdn have been found to range from 100- to 1000-fold less compared with Neu5Ac in various human cancer cells, cancer tissues, and normal tissues [17–20]. Due to its low abundance, conjugated Kdn has only been investigated after hydrolysis [17–20], which inherently results in a loss of information about the carrier of Kdn. Nonetheless, the presence of Kdn has been associated with a variety of human cancers in vitro and in vivo. For example, Kdn was observed in human lung carcinoma cell lines (A125, A549, Calu, and Hotz) after the hydrolysis of glycolipids and glycoproteins that were extracted from the cells [20]. The presence of Kdn was also found in throat tissues for head and neck cancer [19], although it remains unclear whether the Kdn was already free or whether it was conjugated, as the tissues were treated with a mild acid hydrolysis and no extraction step was performed prior to the hydrolysis. In the human ovarian teratocarcinoma cell line PA-1, free Kdn was observed along with two different Kdncontaining glycoproteins: a soluble protein (49 kDa) and a membrane-associated protein (30 kDa), which were detected by means of Western blot test [18]. The presence of Kdn in the 30 kDa glycoprotein was determined by using a monoclonal antibody against the Kdn(α2,3)Gal(β1)-epitope and using a KDNase. The 49 kDa protein was not reactive to the monoclonal antibody but did react to the KDNase, suggesting that this glycoprotein contains Kdn in another linkage than the α2,3-linkage. While this is the first report demonstrating mammalian Kdn-containing glycoproteins, the researchers were unable to identify the nature of the glycoproteins.
In this study, we identified and characterized for the first time the expression of Kdn on the mammalian glycoprotein prostatespecific antigen (PSA). This glycoprotein is used as a diagnostic tool for PCa, as elevated concentrations in the circulation (> 3 ng·mL–1 ) indicate an increased risk of PCa. However, due to the low specificity of this biomarker, there is an urgent need for a better biomarker that can prevent overdiagnosis [22,23]. Various studies have demonstrated that alterations in the N-glycomic profile of PSA might be a better indicator for the occurrence of PCa [24– 26]; in particular, sialylation is considered to be a promising glycosylation feature in this regard [24,25]. As mentioned above, an accumulation of free Kdn-containing N-glycans has been reported in human PCa tissues, indicating that Kdn might play a role in PCa [21] and thus could be exploited as a diagnostic marker; nevertheless, further research is required. Here, we report on the presence of conjugated Kdn-containing N-glycans on PSA derived from seminal plasma, as characterized by tandem mass spectrometry (MS/MS) of both released N-glycans and glycopeptides. Moreover, the abundance of Kdn on PSA is investigated in a clinical cohort using urinary PSA from patients with elevated serum PSA concentrations.
《2. Materials and methods》
2. Materials and methods
《2.1. Chemicals and standards》
2.1. Chemicals and standards
PSA standard derived from seminal plasma was purchased from Lee BioSolutions (USA). TPCK-treated trypsin (bovine pancreas) was purchased from Worthington Biochemical Corporation (USA). Peptide N-glycosidase F (PNGase F) was purchased from Roche Diagnostics (Germany). Ammonium bicarbonate (ABC), ammonium acetate, Dowex cation-exchange resin (50W-X8), sodium chloride (NaCl), hydroxylamine solution 50% in water, hydrochloride (HCl), sodium tetraborohydride (NaBH4), dithiothreitol (DTT), iodoacetamide (IAA), dimethyl sulfoxide (DMSO), ammonium hydroxide solution, and 2-methylpyridine borane complex (PB) were acquired from Sigma-Aldrich (Germany). Isopropanol, formic acid (FA), glacial acetic acid, potassium hydroxide (KOH), and water of liquid chromatography (LC)–mass spectrometry (MS) grade were obtained from Honeywell Fluka (Germany). Betamercaptoethanol (βME) and Nonidet P-40 (NP40) substitute were purchased from VWR International, LLC (USA), while 1-ethyl-3-(3 -(dimethylamino)propyl)-carbodiimide hydrochloride (EDC) was obtained from Fluorochem (UK). Acetonitrile (MeCN) of LC–MS grade was obtained from Biosolve (the Netherlands). Anthranilic acid (2-AA), 40% dimethylamine in water, 20% sodium dodecyl sulfate (SDS) solution in water, and 1-hydroxybenzotriazole hydrate (HOBt) were obtained from Sigma-Aldrich (Switzerland). Sodium bicarbonate (NaBC), sodium hydroxide (NaOH), methanol, ethanol, 2-propanol, trifluoroacetic acid (TFA), sodium phosphate dibasic dihydrate (Na2HPO4), and monopotassium phosphate (KH2PO4) were acquired from Merck (Germany). Milli-Q water (MQ) was generated from a Q-Gard 2 system (Millipore, the Netherlands) maintained at ≥ 18 MX. Five-times-concentrated PBS (5× PBS) was made out of 0.16 mol·L–1 Na2HPO4, 0.02 mol·L–1 KH2PO4, and 0.73 mol·L–1 NaCl (pH 7.3). A dilution from the 5× PBS was made with MQ to obtain 1× PBS (pH 7.6). Conical 96-well Nunc plates were bought from Thermo Fisher Scientific (USA). Solidphase extraction (SPE) bulk sorbent carbograph was obtained from Grace Discovery Sciences (USA). Multiscreen HTS 96-multiwell plates (pore size 0.45 μm) with a high protein-binding membrane (hydrophobic immobilon-P polyvinylidene difluoride (PVDF) membrane) and 96-well polypropylene (PP) microplates were acquired from Millipore. A 96-well PP filter plate was obtained from Orochem Technologies (USA). TMTzero label reagent was purchased from Thermo Fisher Scientific.
《2.2. Clinical samples》
2.2. Clinical samples
The urinary PSA assay was developed using a female urine pool (FUP) consisting of ten healthy female urine samples and was collected at the Leiden University Medical Center (LUMC). The FUP served as a negative and as positive controls (spiked PSA standard) for the clinical cohort analysis. Urine samples from individuals suspected of PCa (based on the currently used PCa biomarker, PSA, at elevated serum concentrations (> 3 ng·mL–1 ), where the individual is recommended for further examination) were collected at the Urology Department at Amsterdam University Medical Center (UMC), location Academic Medical Center (AMC). Patients with cystitis, undergoing chemotherapy, using 5-alpha reductase inhibitors, or having a history or presence of cancer or non-prostate urological disorders were excluded from the study. In total, 52 urine samples were collected prior to prostate biopsies. The collection of the urine samples and clinical information was approved by the Medical Ethical Committee of the Amsterdam UMC, location AMC (W16_010#16.020). Clinical information on the patients (e.g., age, serum PSA concentration, prostate volume, ethnicity, clinical tumor stage, and Gleason score) are provided in Table S1 in Appendix A. After urine donation (5–96 mL), the urine was cooled to room temperature (RT) and stored at –80 °C. More information on the anti-PSA antibodies and the PSA capture from urine samples is provided in Sections S1.1 and S1.2 in Appendix A. The urinary samples were processed in two batches. The samples in batch 1 were prepared and analyzed in our previous study [27]; the remaining solution (fully prepared samples, captured and digested) was stored for approximately six months and underwent three freeze-and-thaw cycles prior to the current measurement. Batch two was only stored for a maximum of two weeks and underwent one freeze-and-thaw cycle.
《2.3. 2-AA labeling of released PSA N-glycans for positive mode analysis via reversed-phase (RP)-nanoLC–MS/MS (RP-nanoLC–MS/MS) (quadrupole time-of-flight (Q-ToF))》
2.3. 2-AA labeling of released PSA N-glycans for positive mode analysis via reversed-phase (RP)-nanoLC–MS/MS (RP-nanoLC–MS/MS) (quadrupole time-of-flight (Q-ToF))
A total of 10 μL of PSA standard (pre-concentrated to 7 μg·μL–1 ) was added to 20 μL of 2% SDS and was shaken for 5 min on a plate shaker at max speed. This was followed by incubation for 10 min at 60 °C. The samples were cooled to RT and 20 μL of release mixture(10 μL of 4% NP40, 10 μL of acidic 5× PBS and 1 μL of PNGase F) was added to the samples. The samples were shaken for another 5 min on a plate shaker at max speed. Subsequently, the samples were incubated overnight (ON) at 37 °C. Prior to 2-AA labeling, PSA-released N-glycans were purified by means of cotton hydrophilic interaction liquid chromatography (HILIC) SPE, as described before [28]. In brief, 1 μL of PSA-released N-glycans was purified and eluted with 10 μL of MQ. Labeling was performed as described previously [29,30]. Then, 50 μL of released PSA N-glycans was added to 50 μL of labeling solution consisting of 25 μL of 2-AA solution (48 μg·μL–1 in 85% DMSO:15% acetic acid) and 25 μL of PB solution (107 μg·μL–1 in DMSO). After mixing, the samples were incubated for 2 h at 60 °C. Prior to injection, the PSA glycans were diluted to 3.5 ng·μL–1 with H2O.
《2.4. Released PSA N-glycans for negative mode analysis via porous graphitic carbon (PGC)-nanoLC–MS/MS (ion trap)》
2.4. Released PSA N-glycans for negative mode analysis via porous graphitic carbon (PGC)-nanoLC–MS/MS (ion trap)
The PSA N-glycan release was performed using a 96-well plate sample preparation method, as previously described [31]. In brief, 20 μL of PSA standard (1.5 μg·μL–1 ) was loaded on a hydrophobic immobilon-P PVDF membrane in a 96-well plate format. Subsequently, denaturation was performed by applying 75 μL of denaturation mix (72.5 μL of 8 mol·L–1 GuHCl and 2.5 μL of 200 mmol·L–1 DTT), and the plate was shaken for 15 min at RT. Afterward, the samples were incubated for 30 min at 60 °C in a humid box. Any unbound material was removed by centrifugation (500 g for 2 min). N-glycan release was achieved by adding PNGase F (2 U of enzyme diluted with MQ to 15 μL) to each well, and ON incubation was performed at 37 °C. The released N-glycans were eluted from the PVDF plate by centrifugation (500 g for 2 min). The glycosylamines of the released N-glycans were hydrolyzed by adding 20 μL of 100 mmol·L–1 ammonium acetate (pH 5) to the sample and performing an additional incubation of 1 h at RT, followed by evaporation at 35 °C in a SpeedVac concentrator 5301 (Eppendorf, Germany). To reduce and desalt the released N-glycans, PGC-SPE cleanup was performed. For this purpose, 20 μL of 1 mol·L–1 NaBH4 in 50 mmol·L–1 KOH was added to each well using a 96-well polymerase chain reaction plate-based protocol [31]. In addition, the samples were dried in a SpeedVac concentrator, reconstituted in 10 μL of MQ, and stored at –20 °C prior to the analysis by PGC-nanoLC–MS/MS.
《2.5. Tryptic PSA glycopeptides》
2.5. Tryptic PSA glycopeptides
More information on the digestion procedure is provided in Section S1.3 in Appendix A.
《2.6. Derivatization on tryptic PSA glycopeptides: Dimethylamidation (DA) for positive mode analysis via capillary electrophoresis (CE)–MS/ MS (Q-ToF)》
2.6. Derivatization on tryptic PSA glycopeptides: Dimethylamidation (DA) for positive mode analysis via capillary electrophoresis (CE)–MS/ MS (Q-ToF)
After digestion, tryptic PSA glycopeptides from the PSA standard (seminal plasma) were derivatized to stabilize the sialic acids and enable the distinction between different linkages, as described before [28]. One microlitre of the tryptic PSA digest was added to 20 μL of DA reagent (250 mmol·L–1 EDC, 500 mmol·L–1 HOBt, and 250 mmol·L–1 dimethylamine in DMSO) and incubated together at 60 °C for 1 h in a 96-well plate. After adding 8 μL of 28% ammonium hydroxide solution, the samples were incubated for an additional 2 h at 60 °C. The PSA glycopeptides were enriched from the reaction mixture using cotton HILIC SPE. The glycopeptides were eluted in 10 μL of H2O and stored at 20 °C prior to their analysis by CE–MS.
《2.7. Derivatization on tryptic PSA glycopeptides: TMTzero labeling for positive ionization mode analysis via RP-nanoLC–MS/MS (Orbitrap)》
2.7. Derivatization on tryptic PSA glycopeptides: TMTzero labeling for positive ionization mode analysis via RP-nanoLC–MS/MS (Orbitrap)
The amine-reactive tandem mass tag (TMT), TMTzero, was applied to increase the hydrophobicity of tryptic PSA glycopeptides. TMT labels were designed for MS-level protein quantification, which modifies lysine residues and the peptide N-termini. In brief, a mixture of 5 μL of tryptic PSA (200 ng·μL–1 ) and 2 μL of TMTzero label reagent in MeCN (4 μg·μL–1 ) was made and incubated for 2 h at 37 °C. The reaction was quenched by adding 1.2 μL of 5% hydroxylamine, followed by additional incubation for 15 min at RT.
《2.8. CE–MS(/MS)》
2.8. CE–MS(/MS)
All CE–MS(/MS) measurements were conducted on a CESI 8000 system (SCIEX, USA), mounted with a neutral OptiMS cartridge (non-captured samples) or an in-house UltraTrol-coated BFS OptiMS capillary (captured samples); both capillaries were 91 cm long with an inner diameter (i.d.) of 30 μm and an outer diameter (o.d.) of 150 μm (SCIEX). The CESI 8000 system was coupled to a UHR-QqToF maXis Impact HD mass spectrometer (Bruker Daltonics, Germany) using an OptiMS Bruker MS adapter (SCIEX) with an internal polymer cone on the porous tip housing to enable the usage of a dopant-enriched nitrogen (DEN) gas [32]. Prior to analysis, the neutral OptiMS cartridge was conditioned as directed by the manufacturers’ protocol, and the BFS OptiMS capillary was conditioned and coated in-house with UltraTrol dynamic pre-coat ‘‘Low Normal” (LN) electroosmotic flow formulation (Target Discovery, USA) as described by Lageveen-Kammeijer et al. [33].
For the analysis on the neutral OptiMS capillary, CE separation was conducted at 20 kV and 20 °C using a background electrolyte (BGE) consisting of 20% acetic acid (pH 2.3). Prior to injection, 8 μL of the sample was mixed with 4 μL of leading electrolyte (LE; 1200 mmol·L–1 ammonium acetate, pH 3.2). All standards (PSA derived from seminal plasma) were injected by applying 10 psi (1 psi = 6894.757 Pa) pressure for 60 s, corresponding to 13.5% of the total capillary volume (87 nL). After the sample injection, a BGE post-plug was injected by applying 2.5 psi for 10 s (0.56% capillary volume). Analysis on the in-house-coated BFS OptiMS capillary was performed at 30 kV at 24 °C using 20% acetic acid with 10% MeOH as the BGE (pH 2.0). A total of 1.5 μL of the clinical sample was used, and 1.0 μL of 250 mmol·L–1 ammonium acetate, pH 4.0 (LE) was added. Injection was performed hydro-dynamically with 1 psi pressure for 60 s, corresponding to 1.4% of the total capillary volume (9 nL). This was followed by a BGE post-plug using 0.5 psi for 25 s (0.3% capillary volume).
All experiments were performed in positive ionization mode. Electrospray ionization (ESI) was achieved using a glass capillary voltage between 1100 and 1300 V. MeCN was used as the dopant for the DEN gas at 0.2 bar (1 bar = 105 Pa). The temperature and drying gas (nitrogen) flow rate were set at 150 °C and 1.2 L·min–1 , respectively. MS spectra were acquired between m/z 200 and m/z 2000, using 1 Hz as the spectral acquisition rate.
《2.9. RP-nanoLC–MS/MS (Q-ToF)》
2.9. RP-nanoLC–MS/MS (Q-ToF)
The analyses of the 2-AA labeled released N-glycans were performed on an ultimate 3000 high-performance liquid chromatography (HPLC) system (Thermo Fisher Scientific), coupled to a maXis Impact HD Q-ToF-MS device (Bruker Daltonics), equipped with an Acclaim PepMap100 C18 trap column (5 mm × 300 μm, Thermo Fisher Scientific) and an Ascentis Express C18 nanoLC analytical column (50 mm × 75 μm with 2.7 μm fused core particles; Supelco, USA). Mobile phase A consisted of an aqueous solution (0.1% TFA; v/v), while mobile phase B consisted of 95% MeCN in MQ (v/v). The gradient speed was set to increase the mobile phase B by 1.73% per min. To enhance the sensitivity, DEN gas, using MeCN as a dopant, was employed at 0.2 bar. The dry gas flow was set at 3.0 L·min–1 and the dry temperature at 180 °C. Both MS and MS/MS were obtained in positive ionization mode between m/z 150 and m/z 2800 using a spectral acquisition frequency of 1 Hz.
《2.10. RP-nanoLC–MS/MS (Orbitrap)》
2.10. RP-nanoLC–MS/MS (Orbitrap)
The TMT-labeled tryptic PSA glycopeptides were measured on a nanoLC–MS system composed of an Easy nLC1200 gradient HPLC system (Thermo Fisher Scientific, Germany) coupled to an Orbitrap Fusion LUMOS MS (Thermo Fisher Scientific). The TMT-labeled tryptic PSA glycopeptides (10 ng·μL–1 in 20 μL water) were lyophilized and dissolved in 10 μL of solvent A (water/MeCN/FA; 95.0/3.0/0.1, v/v/v), loaded onto an in-house packed C18 precolumn (100 μm × 15 mm, Reprosil-Pur C18-AQ 3 μm, Germany), and separated on a homemade analytical nanoLC column (50 cm × 75 μm, Reprosil-Pur C18-AQ 3 μm). For the elution of the analytes, a linear gradient was set from 10% to 40% in 20 min for solvent B (water/MeCN/FA; 20.0/80.0/0.1, v/v/v). The nanoLC column was drawn to a tip of approximately 5 μm and acted as the electrospray needle of the MS source. The MS was operated in data-dependent MS/MS mode (top-20 mode). The MS1 spectra were acquired with a mass range of m/z 750–1800 at the automatic gain control (AGC) standard target value combined with a maximum accumulation time of 50 ms. The resolution setting for the MS1 scans was set at 120 000. A dynamic exclusion was set for 10 s with a single repeat count, and charge states in the range 2–3 were included for the MS/MS. The resolution of the MS/MS scans was 30 000 at an AGC target of 2 × 10⁴ with a maximum fill time of 60 ms. MS/MS spectra were generated from precursors isolated with the quadrupole with an isolation width of 1.2 Da at a scan range (m/z) of 110–3500. An exclusion list of the 12 most abundant tryptic PSA glycopeptides was used (Table S2 in Appendix A). Upon detection of the N-acetylhexosamine (HexNAc) oxonium ion at m/z 204.087 (with a tolerance of 15 pm), a higher energy collisional dissociation (HCD) scan was triggered with stepped normalized energies of 25%, 32%, and 39%, at a normalized AGC target of 200% in combination with a maximum fill time of 200 ms [34].
《2.11. PGC-nanoLC–ESI–MS/MS》
2.11. PGC-nanoLC–ESI–MS/MS
The measurements of the released PSA N-glycans were conducted on an ultimate 3000 ultra-HPLC (UHPLC) system (Thermo Fisher Scientific), coupled to an amaZon electron-transfer dissociation (ETD) speed ion trap (Bruker Daltonics Inc.), fitted with a home-packed PGC trap column (5 μm Hypercarb, 320 μm × 30 mm) and a home-packed PGC nano. column (3 μm Hypercarb, 100 μm × 150 mm). Solvent A consisted of 10 mmol·L–1 ABC and solvent B of 60% MeCN and 10 mmol·L–1 ABC (v/v). To analyze the released N-glycans, 3 μL of the 10 μL sample was injected and loaded onto the trap column using a 6 μL·min–1 loading flow in 2% buffer B for 5 min. To achieve separation, a multistep gradient was employed, in which solvent B increased from 2% to 9% in 1 min, followed by an increase to 49% in 80 min. After each analysis, a 10 min washing step was performed using 95% of solvent B at a flow rate of 0.6 μL·min–1 . Ionization was facilitated with the nanoBooster source using isopropanol as the dopant. A column temperature of 45 °C, capillary voltage of 1000 V, dry gas temperature of 280 °C at 5 L·min–1 , and nebulizer at 3 psi were applied. The smart parameter setting was set to m/z 1200. MS spectra were acquired in enhanced mode using the negative-ion mode within a m/z range of 500–1850. MS/MS spectra were acquired for the three most abundant ions in intensity within a m/z range of 100–2500.
《2.12. Data analysis》
2.12. Data analysis
The analysis of the raw data obtained from the Bruker MS instruments (RP-nanoLC–MS(/MS), PGC-nanoLC–MS(/MS), and CE–MS (/MS)) was performed manually using DataAnalysis 5.0 (Build 203; Bruker Daltonics) for glycopeptide and glycan discovery and identification. The CE–MS(/MS) data was internally recalibrated with sodium adducts prior to peak integration. The PSA glycopeptides and N-glycan compositions were extracted by the first three isotopes of the singly, doubly, and triply charged analytes using a m/z window of ±0.02 to acquire extracted ion chromatograms/electro pherograms (EICs/EIEs; smoothed with a Gaussian fit). The EICs and EIEs were used to evaluate the elution time (LC) and migration time (CE) of the analytes, the accurate mass (±20 ppm), and the isotopic peak pattern (comparison with the theoretical isotopic pattern), followed by the integration of the peak area. Relative quantitation was performed by integrating the total area of all analytes within a single analysis. Observed N-glycan structures in the PGCnanoLC–MS/MS analysis were assigned based on known MS/MS fragmentation patterns in negative-ion mode and by using Glycoworkbench [35] and Glycomod [36] software.
For the clinical samples, analytes were included for further data analysis when their migration time belonged to the correct migration clusters, parts per million errors were observed between –10 and 10, and the analyte was at least present in more than 2/3 of the spectra. Spectral curation was performed based on the number of analytes identified in the spectrum. Spectra were excluded if the number of analytes identified was lower than 60 (2/3 of the highest number of analytes detected in the individual spectra). Finally, the absolute areas of the included analytes were normalized to the summed absolute area of all analytes (total area normalization). Further data analysis for the clinical samples was carried out using R (version 3.4.3, R Foundation for Statistical Computing) together with RStudio (version 1.2.1335). The data was visualized by principal component analysis (PCA; R, pcaMethods) of the two batches of samples.
High mass accuracy analysis of the raw RP-nanoLC–MS(/MS) data obtained using the Thermo MS instruments was performed manually by means of Xcalibur (Thermo Xcalibur 2.2 SP1.48, USA) for more reliable glycopeptide confirmation.
《3. Results》
3. Results
Here, we present an MS-based study demonstrating the presence of Kdn sialylation on human PSA from different biofluids (seminal plasma and urine; Table 1). Four Kdn-containing N-glycans on PSA were identified: H5N4F1S1K1, H5N4F1K1 (where H: hexose, N: N-acetylhexosamine, F: fucose, S: Neu5Ac, K: Kdn), and their non-fucosylated variants (Fig. 1(a)). The characterization and relative quantification were performed using four complementary analytical platforms—namely, RP-nanoLC coupled to either an Orbitrap or a Q-ToF-MS device in positive-ion mode, CE–MS (positive-ion mode, Q-ToF), and PGC-nanoLC–MS (negative-ion mode, ion trap) with the acquisition of collision-induced MS/MS spectra throughout (Table 1 and Table S3 in Appendix A). Glycopeptides were assessed both with and without linkage-specific sialic acid derivatization.
《Table 1》
Table 1 Identification and key information obtained for Kdn-containing PSA glycans/glycopeptides with different analytical approaches using tandem MS.

NA: not available.
《Fig. 1》

Fig. 1. Identification of the Kdn motif (H1N1K1) on native tryptic PSA glycopeptides using CE–MS/MS in positive ionization mode. (a) EIEs of four glycopeptides containing the H1N1K1 motif: H5N4F1S1K1[NK] (three isomers: 1.1.1, 1.1.2, and 1.1.3); H5N4S1K1[NK] (three isomers: 1.2.1, 1.2.2, and 1.2.3); H5N4F1K1[NK] (four isomers: 1.3.1, 1.3.2, 1.3.3, and 1.3.4); and H5N4K1[NK] (two isomers: 1.4.1 and 1.4.2 (ⅰ)). (b) Tandem mass spectra corresponding to the first isomer of H5N4S1K1[NK]. (c) Tandem mass spectra corresponding to the second isomer of H5N4S1K1[NK]. (d) Tandem mass spectra corresponding to the third isomer of H5N4S1K1[NK]. Oxonium (B-)ions and Y-ions are highlighted in orange and black, respectively. Blue diamond marks the precursor ion. Green panel highlights the Kdn (H1N1K1) and Neu5Ac (H1N1S1) antennae at m/z 616.208 and 657.242, respectively. The Kdn structure is not specifically assigned to the α1,6-antenna or the α1,3-antenna. For the fragmentation data of the other isomers, see Fig. S1. NK: the asparagine-lysine peptide portion of the tryptic PSA glycopeptides.
For structural elucidation, reducing-end-labeled and reduced N-glycans were analyzed by RP-nanoLC–MS/MS and PGC-nanoLC– MS/MS, respectively. Furthermore, the presence of Kdn on PSA and its association with PCa were explored by investigating urinary PSA derived from men with elevated serum PSA concentrations (> 3 ng·mL–1 ). While the Kdn-containing N-glycans were identified on a PSA standard, which is reasonably pure, it cannot be assumed that this was also the case for captured PSA from a biofluid. That is, aspecific binding of other glycoproteins could lead to a co-capture and, in the case of an N-glycan release, all the N-glycans present in the sample would be released. This would result in a biased glycomic profile due to contamination of the other glycoproteins. In the case of contamination, the glycomic profiles of PSA would be biased. By performing a proteolytic cleavage, PSA glycopeptides could be specifically targeted, as the peptide moiety could be used as an identifier of PSA.
《3.1. Expression of Kdn on mammalian PSA》
3.1. Expression of Kdn on mammalian PSA
The four Kdn-containing N-glycans on PSA were initially observed with CE–MS. CE–MS is very well known for its high sensitivity, which enables the detection of low-abundance analytes such as conjugated Kdn. Notably, an inspection of the MS/MS of non-derivatized PSA glycopeptides by CE–MS revealed distinct Band Y-ions, which are uncommon for N-glycans retrieved from a human source (e.g., B-ion at m/z 616.2081+ and Y-ions at m/z 1606.6211+, m/z 1752.6791+, m/z 1768.6741+, and m/z 1914.7321+; Fig. 1 and Fig. S1 in Appendix). The observation of oxonium ion at m/z 616.2081+ suggests the presence of a Kdn modification. In this case, the oxonium ion at m/z 616.2081+ represents the composition H1N1K1, and the distinct Y-ions at m/z 1606.6211+, m/z 1752.6791+, m/z 1768.6741+, and m/z 1914.7321+ could be assigned to H3N3K1[NK], H3N3F1K1[NK], H4N3K1[NK], and H4N3F1K1[NK], respectively (where [NK] indicates the asparagine-lysine peptide portion of the tryptic PSA glycopeptides).
Interestingly, several isomers were found by generating the EIE of m/z 1140.4362+, corresponding to the mass of Kdn-glycopeptide H5N4F1K1[NK] (Fig. S1(a)). Next to the Kdn-glycopeptide (with oxonium ion at m/z 616.2081+ for H1N1K1, see Figs. S1(e)–(g)), MS/MS showed the presence of the isomeric hybrid-type N-glycan H6N3F1S1[NK] (assignment supported by H1N1S1 at m/z 657.2351+, H5N3F1[NK] at m/z 1826.7161+ (loss of a H1S1), and H6N3F1[NK] at m/z 1988.7691+ (loss of S1, see Figs. S1(f)–(h))), which was in line with our previous findings [27]. In alignment with these findings, a range of variants was detected that lacked a fucose. More specifically, the fragmentation of m/z 1067.4072+, corresponding to peak 1.4.1 (revealed the presence of both the Kdn-containing glycopeptide H5N4K1[NK]; (H1N1K1 at m/z 616.2081+, see Fig. S1(i)) and a hybrid-type N-glycan H6N3S1[NK] (H1N1S1 at m/z 657.2351+, H5N3[NK] at m/z 1680.6581+, and H6N3[NK] at m/z 1842.7111+), while the fragmentation of m/z 1067.4072+, corresponding to peak 1.4.2, indicated the sole presence H6N3S1[NK] (Fig. S1(j)).
Isomeric separation was observed for all four N-glycan compositions by means of CE–MS/MS (Fig. 1 and Fig. S1). Based upon the separation characteristics of CE and its ability to separate differently linked sialic acids [37], it was assumed that most of these structures would show variance in their sialic acid linkages. Hence, to further characterize these isomers, linkage-specific sialic acid derivatization was performed on tryptic PSA glycopeptides [28], followed by CE–MS. Similar to Neu5Ac, differently linked Kdn have identical masses. Derivatization subjected α2,6-linked Kdn to dimethylamine amidation (+27.0473 Da), while α2,3-linked Kdn underwent ammonia amidation (–0.9840 Da). The resulting mass difference enabled isomer distinction. The Kdn-containing N -glycan compositions without the presence of Neu5Ac (H5N4Ka1 and H5N4F1Ka1; Ka: amidated α2,3-linked Kdn) resulted in a single peak per species, while the N-glycan compositions with both Kdn and Neu5Ac each showed up as two separate isomers (H5N4Ka1A1, H5N4Ka1D1, H5N4F1Ka1A1, and H5N4F1Ka1D1; A: amidated α2,3-linked Neu5Ac; D: dimethylamidated α2,6-linked Neu5Ac; Fig. 2, Figs. S2, S3 (reaction scheme), and Table S3 in Appendix A).
Interestingly, the Kdn sialylated antenna was only detected in an α2,3-linkage configuration, which was further supported by MS/MS (Figs. 2(b) and (c)). More specifically, the oxonium ion at m/z 615.2241+ confirms the H1N1Ka1 antenna, while the oxonium ion corresponding to H1N1Kd1 (Kd: dimethylated α2,6-linked Kdn; expected mass at m/z 643.2561+) was not detected (Fig. 2). The fragmentation of the precursor ion at m/z 1144.9552+ further confirmed the co-elution and presence of both a complex type N-glycan (H5N4F1Ka1) and a hybrid-type N-glycan (H6N3F1A1) attached to the dipeptide [NK]. Several diagnostic ions were found in the MS/MS spectrum, supporting the co-existence of these glycans (e.g., m/z 1605.6261+, 615.2291+, 656.2561+, and 1379.4831+ corresponding to the Y-ion H5N2F1[NK] and the B-ions H1N1Ka1, H1N1A1, and H6N2, respectively; Fig. S2(e)), which is in accordance with the results for the non-derivatized samples.
《Fig. 2》
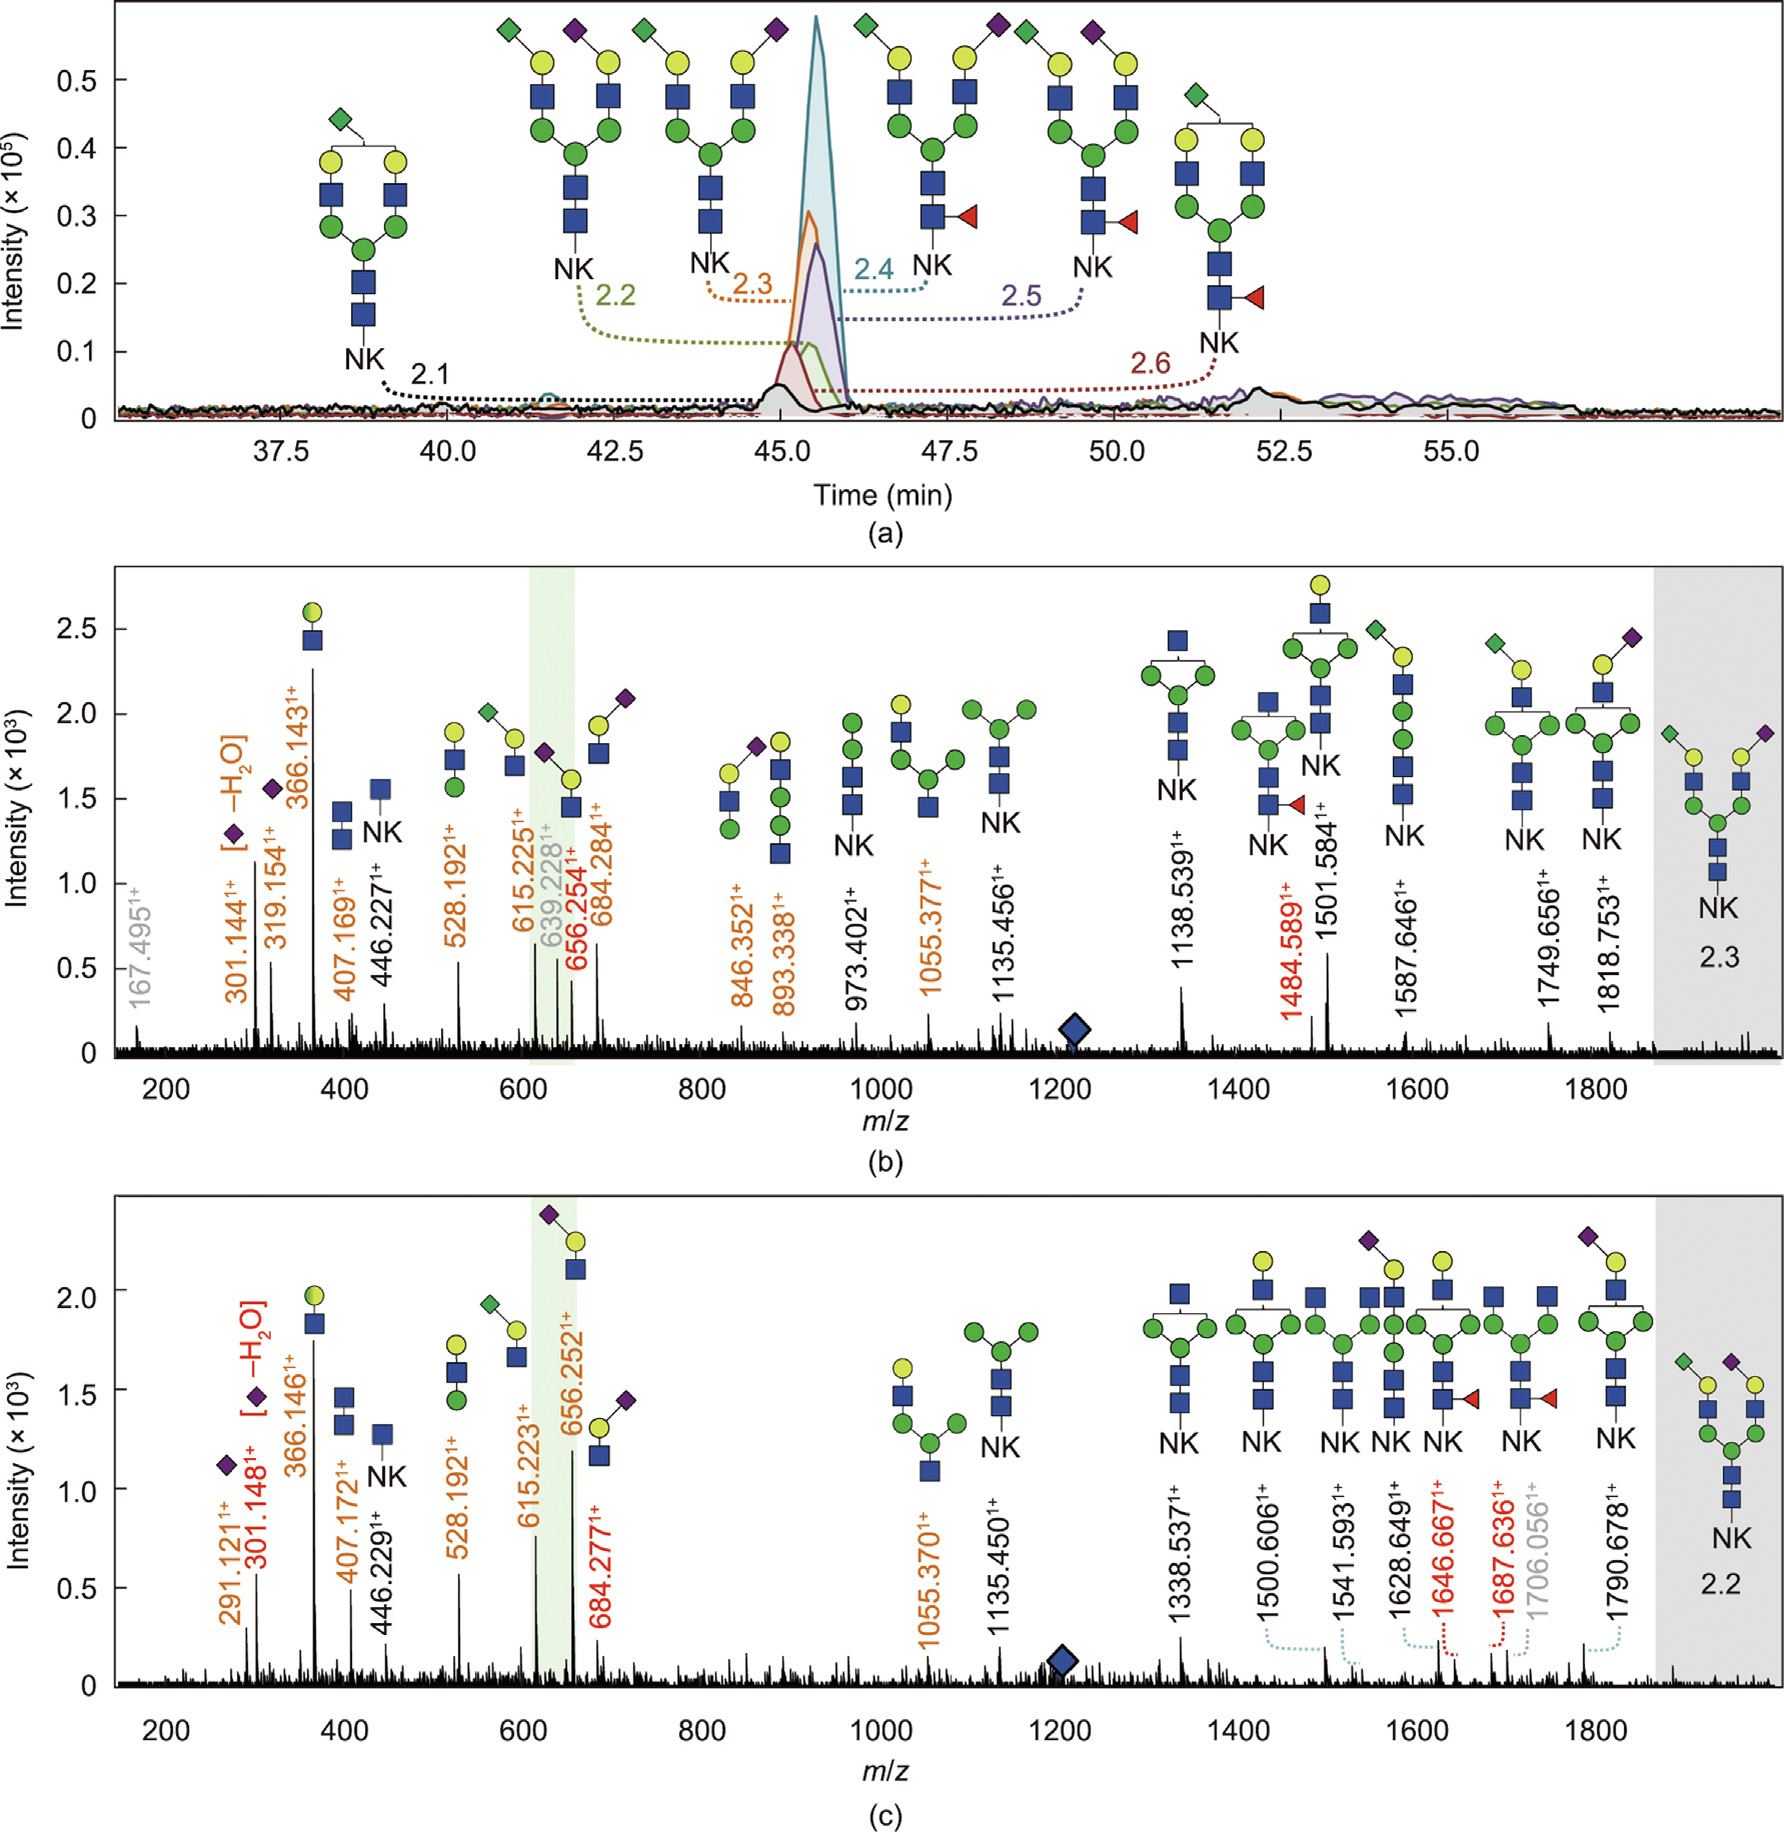
Fig. 2. Identification of the Kdn motif (H1N1K1) on derivatized PSA glycopeptides with CE–MS/MS in positive ionization mode. (a) EIEs of the four glycopeptides containing the H1N1K1 motif after sialic acid derivatization: H5N4K1[NK] (2.1), H5N4F1K1[NK] (2.6), H5N4F1S1K1[NK] (two isomers: 2.4 and 2.5), and H5N4S1K1[NK] (two isomers: 2.2 and 2.3). (b) Tandem mass spectra of H5N4Ka1D1[NK] (2.3) and (c) tandem mass spectra of H5N4Ka1A1[NK] (2.2). Oxonium (B-)ions and Y-ions are highlighted in orange and black, respectively. Ions highlighted in grey are ions from co-isolated analytes that have a similar m/z value as the fragmented precursor ion. Blue diamond marks the precursor ion. The presence of the oxonium ions at m/z 615.2241+ (H1N1Ka1) and the absence of m/z 643.2561+ (H1N1Kd1) indicate the occurrence of the H1N1K1 motif and show that the Kdn-linkage is exclusively present in an α2,3-linkage (green panel). The Kdn structure is not specifically assigned to the α1,6-antenna or the α1,3-antenna. For the fragmentation data of analytes 2.1 and 2.4–2.6, see Fig. S2.
To further explore the presence of isomers and to gain more insight into which isomer corresponds to which composition and linkage, N-glycans were released from PSA, labeled with 2-AA, and analyzed by RP-nanoLC–MS (Q-ToF) in positive ionization mode with MS/MS (Fig. S4 and Table S3 in Appendix A). The released N-glycans were not retained on the C18 column and could not be directly analyzed by RP-LC–MS. To enhance the hydrophobicity, a 2-AA label (a well-developed and commonly used glycan label with a relatively high label efficiency [38,39]) was added to the N-glycans. With this approach, all four Kdn-containing N-glycans were identified and confirmed by the presence of the oxonium ion at m/z 616.2081+ (H1N1K1) in the MS/MS spectra. The presence of the Kdn sialylated antenna was further confirmed by the oxonium ion at m/z 778.2611+ (H2N1K1). Other distinct Y-ions, such as H3N3F1K1[2AA] at m/z 1631.5931+, H4N3F1K1[2AA] at m/z 1793.6461+, and their non-fucosylated variants, were also detected. For the N-glycan with the composition H5N4F1S1K1 [2AA], the Y-ions for H5N4F1S1[2AA] at m/z 1100.4062+ and H5N4F1K1[2AA] at m/z 1079.8932+ were also observed. Furthermore, the fragmentation of the peaks k, l, and j with the precursor ions at m/z 1079.8932+ contained ions that indicated the presence of both a hybrid-type N-glycan H6N3F1S1[2AA] and H5N4F1K1 [2AA] (peak k) or solely one of them (peaks l and j, respectively), due to the observation of H1N1K1 at m/z 616.2081+, H1N1S1 at m/z 657.2351+, and H5N2F1[2AA] at m/z 1502.5501+ (Figs. S4(j)–(l)). This finding is consistent with the CE–MS results.
To gain further insight into the arm occupancy, enzymatically released and reduced PSA N-glycans were measured by means of PGC-nanoLC–MS in negative-ion mode (Fig. 3). As the ion trap used in the PGC-nanoLC–MS platform is not as sensitive to the Q-ToF used for CE–MS, high-concentration injections were performed. As in CE–MS, three isomers were observed for the composition H5N4F1K1S1 in PGC-nanoLC–MS (Fig. 3 and Fig. S5 in Appendix A), as well as the non-fucosylated glycan (H5N4K1S1). The occurrence of the Kdn moiety on PSA was supported by distinct ions such as the B1-ion at m/z 249.061– (K1), the B3-ion at m/z 614.191– (H1N1K1), and the Y6-ion at m/z 2037.731– (H5N4F1K1), as well as by the loss of Kdn (m/z 2078.751– (H5N4F1S1)), and the observation of Neu5Ac supports this finding (m/z 290.091– (S1) and 655.221– (H1N1S1)). Three distinct isomers were observed by means of PGC-nanoLC–MS/MS, and the D-ions in the fragmentation spectra revealed on which arm Kdn was present for each isomer. Whereas the D-ion at m/z 938.301– reveals that the Kdn is on the α1,6-arm (isomer 2, Fig. 3(c)), the other D-ion at m/z 979.331– shows that the α1,6-arm is occupied with Neu5Ac and the Kdn is present on the α1,3-arm (isomer 3, Fig. 3(d)). As shown in Fig. 3(b), the first peak contains both ions with m/z 938.301– and m/z 979.331–, suggesting that it is a co-elution of two analytes, with an H5N4F1S1K1 structure that has Kdn either on the α1,3-arm or on the α1,6-arm. The ratio between the ions implies that the Kdn is mainly on the α1,3-arm and is on the a1,6-arm to a lesser extent. Unfortunately, no conclusive information regarding arm occupancy could be obtained from the fragmentation spectra of H5N4S1K1, although three isomers were observed (Fig. S5).
《Fig. 3》
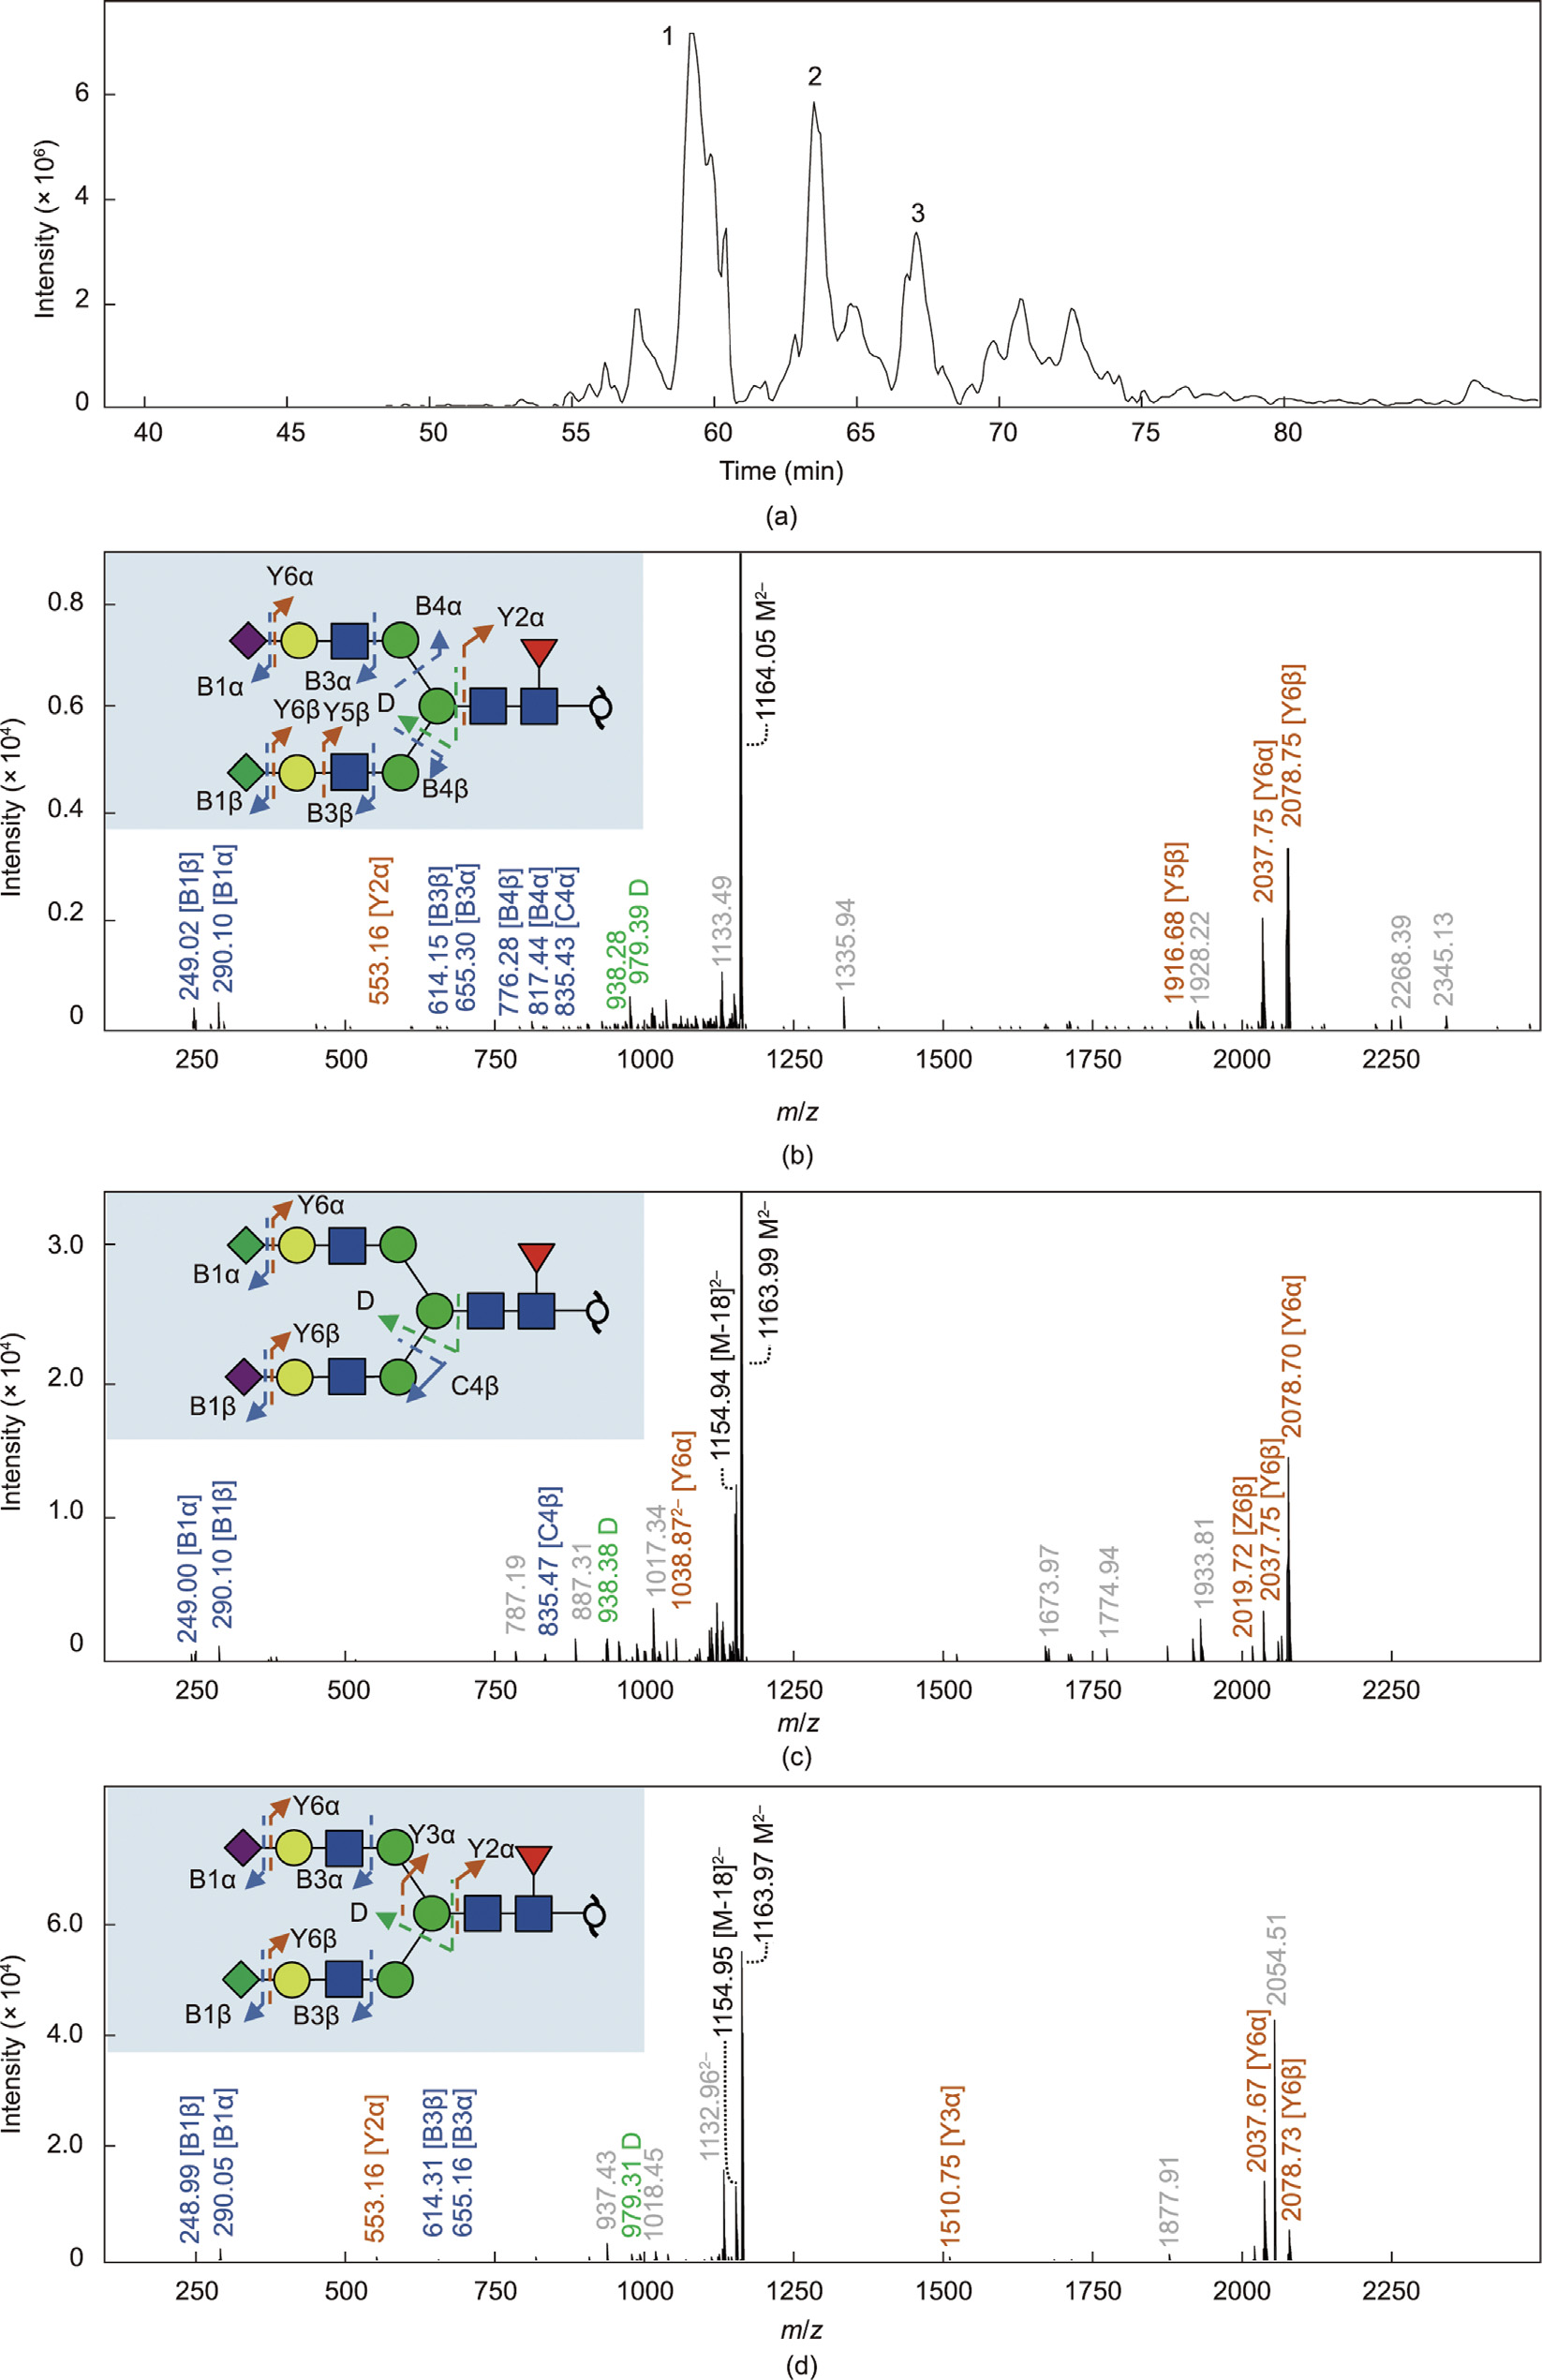
Fig. 3. Identification of the Kdn motif on released N-glycans from PSA via PGC-nanoLC–MS/MS in negative-ion mode. (a) EIC of released N-glycans from PSA containing the Kdn motif. Fragmentation spectra of the released N-glycan at mass 1163.912– indicate that this belongs to the released N-glycan with composition H5N4F1K1S1. (b) Fragmentation spectra of isomer 1 of H5N4F1K1S1. (c) Fragmentation spectra of isomer 2 of H5N4F1K1S1. (d) Fragmentation spectra of isomer 3 of H5N4F1K1S1. B- and C-ions are highlighted in blue. Y-ions are indicated in orange. D-ions in green indicate arm occupancy. M indicates the precursor ion. In the spectrum of (b) isomer 1, the ions with m/z 979.33 and 938.30 were both observed, indicating that this isomer is a mixture (co-elution) of H5N4F1K1S1 with Kdn either on the α1,3 or α1,6 arm, (c) indicates a glycan structure with Kdn on the α1,6 arm, and (d) indicates Kdn on the α1,3 arm.
To further support our findings, high mass accuracy MS/MS was performed by means of RP-nanoLC–MS (Orbitrap) (Fig. 4 and Fig. S6 in Appendix A). To enable the analysis of PSA glycodipeptides on the RP C18 column by providing sufficient retention, a tandem mass tag named TMTzero label was introduced, which also serves as a ‘‘light” tag designed for MS-level peptide quantitation. Moreover, the TMT label was intended to improve the ionization efficiency of the analytes. Here, distinct oxonium ions were found for the Kdn feature in the low mass range (m/z 251.07601+ [K1], m/z 215.05491+ [K1 – 2H2O], and m/z 616.20821+ [H1N1K1]). The identified Kdn-containing glycopeptides and Kdn-containing fragment ions were all found to be within the low parts per million error range (±5 ppm; Fig. S7 in Appendix A).
Based on the CE–MS result (without derivatization), the overall relative abundances of the four Kdn-containing glycans (H5N4K1, H5N4F1K1, H5N4K1S1, and H5N4F1K1S1) with isomer distinction were all below 0.80% of all the glycopeptides identified in the PSA standard (derived from seminal plasma, Table S4 in Appendix A). The glycan structures of the majority of the PSA glycopeptides (non-Kdn-containing) were identified by means of CE–MS/MS in a previous study [27]. Among all the identified Kdn-containing glycans, H5N4F1K2,31S2,61[NK] (isomer 1) had the highest relative abundance of 0.78%.
《Fig. 4》
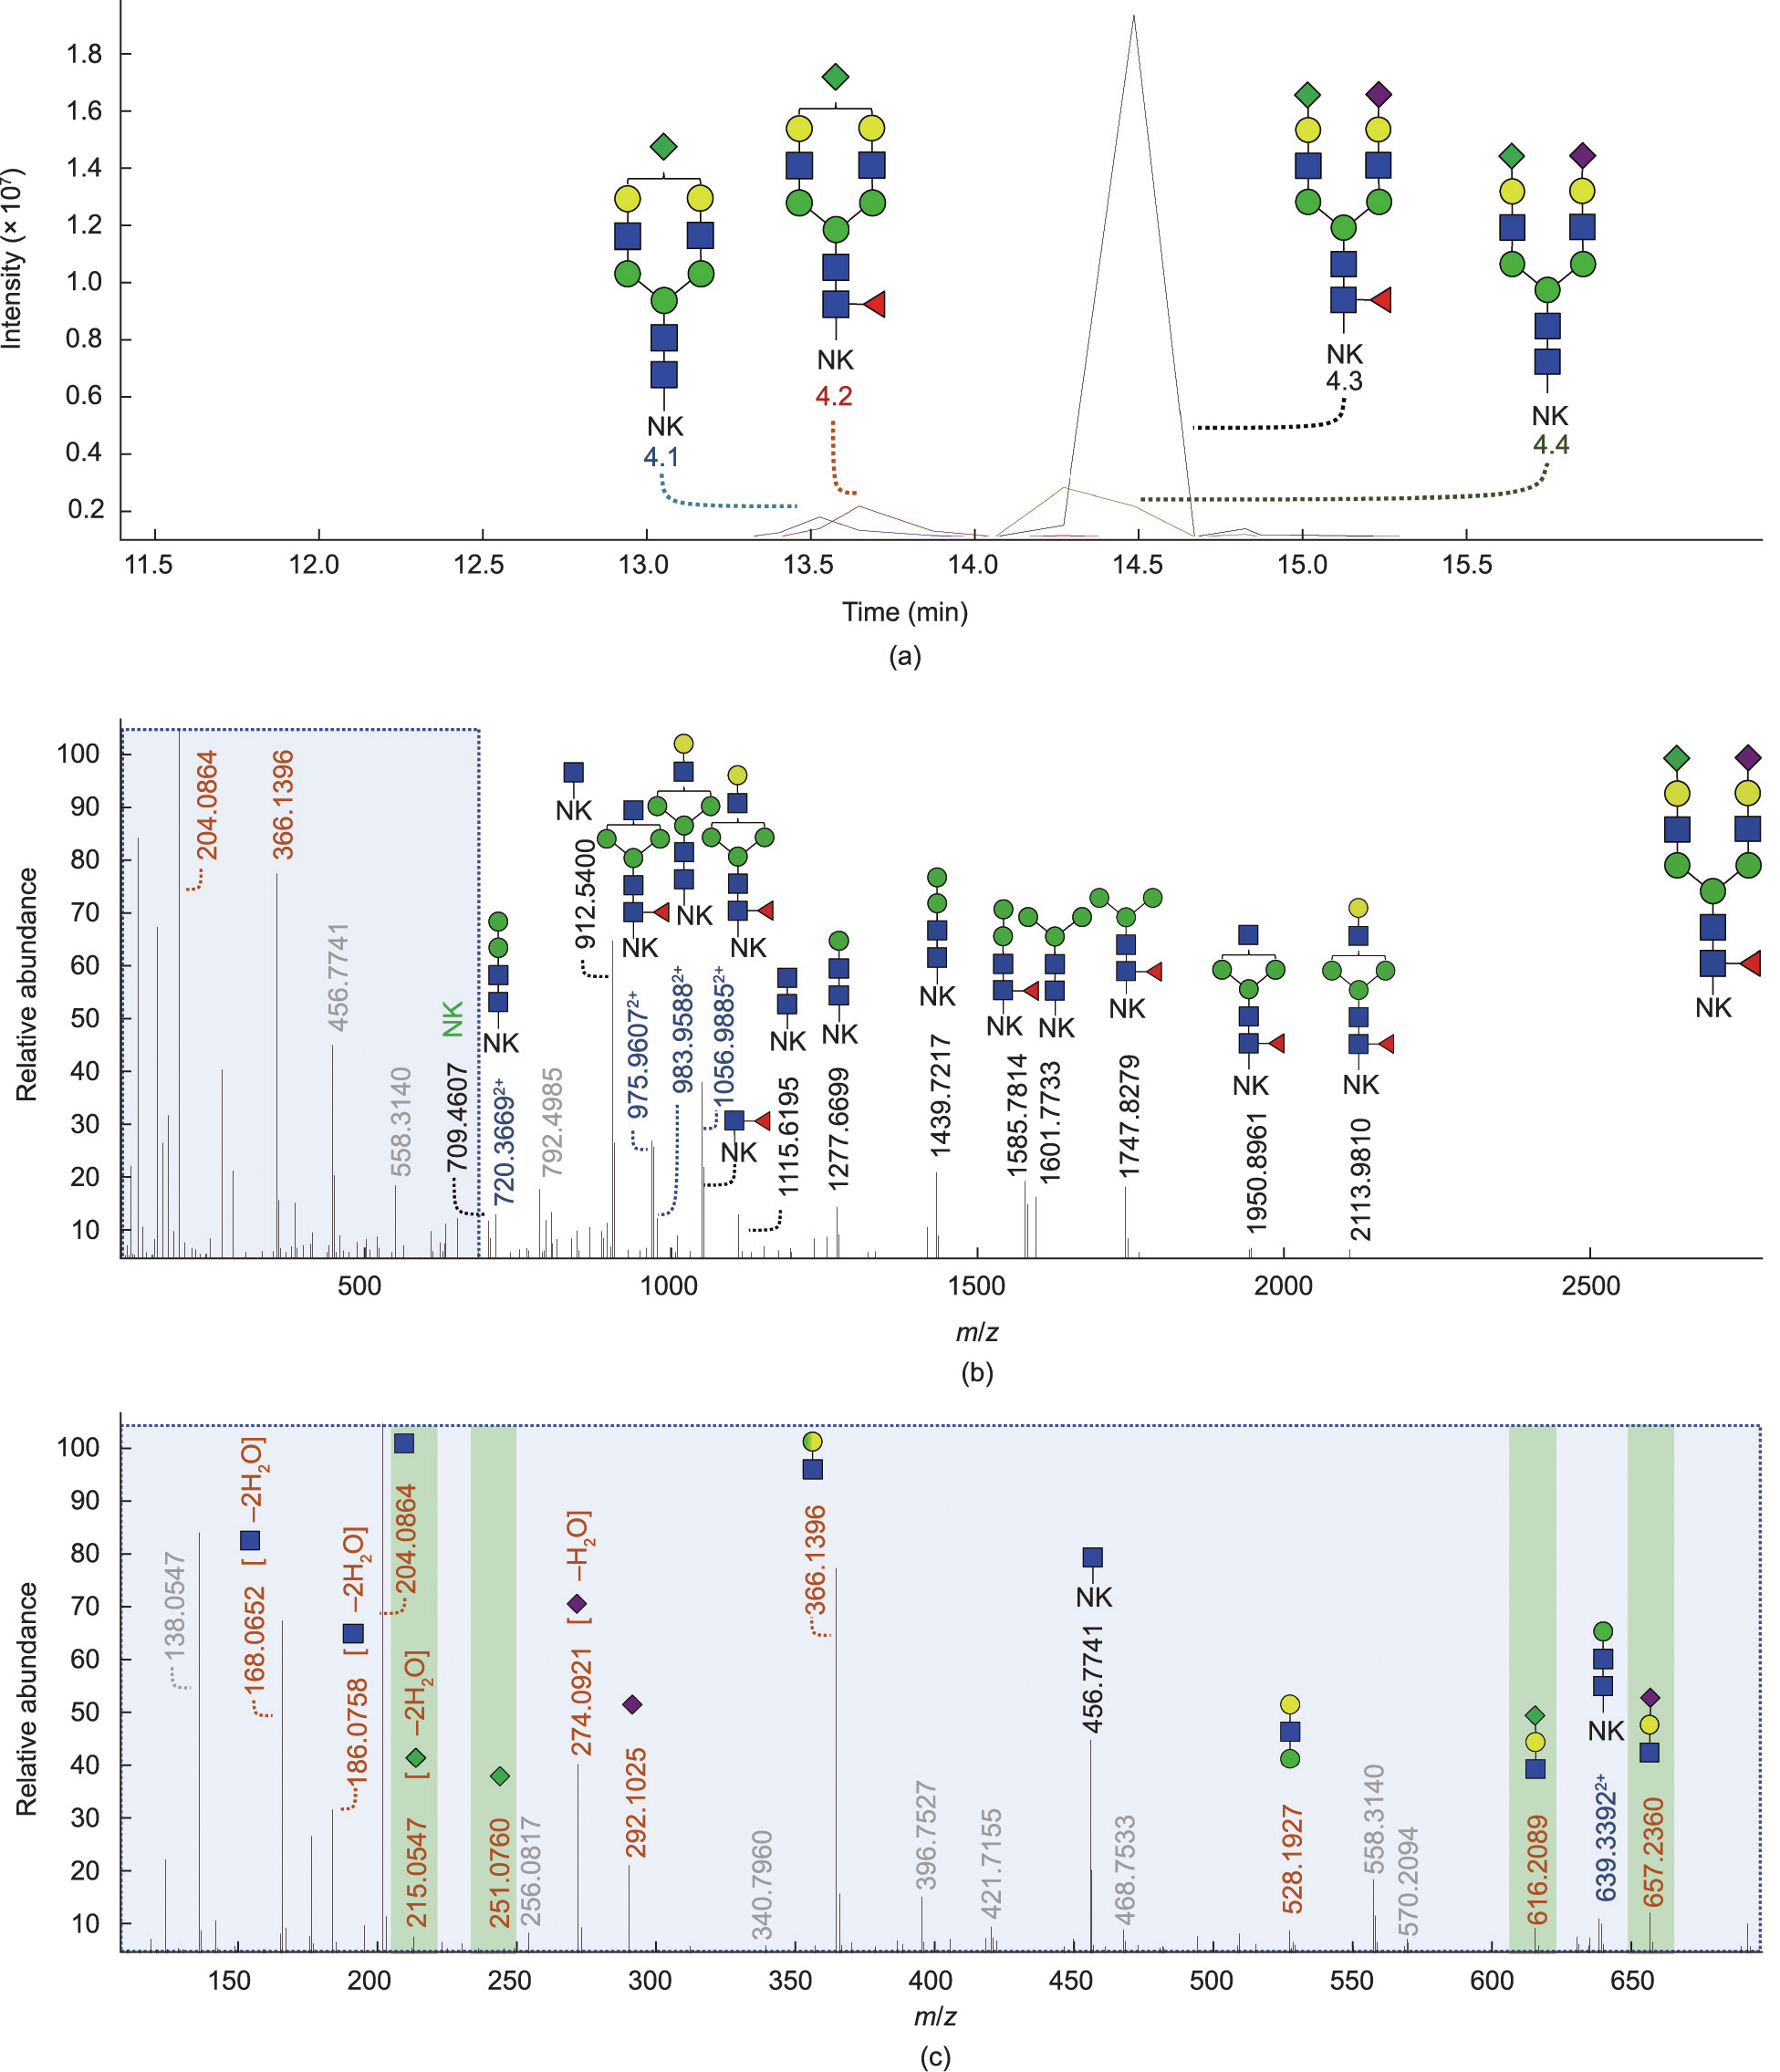
Fig. 4. Identification of the Kdn motif (H1N1K1) on TMT-labeled PSA glycopeptides via RP-LC–MS/MS (Orbitrap) in positive ionization mode. (a) EICs of the four glycopeptides containing the H1N1K1 motif: H5N4K1[NK] (4.1), H5N4F1K1[NK] (4.2), H5N4F1S1K1[NK] (4.3), and H5N4S1K1[NK] (4.4). (b) Full range and (c) magnified tandem mass spectra of the glycopeptide H5N4F1S1K1 with precursor mass at m/z 1007.09303+. The fragments of the full fragmentation spectrum and expanded fragmentation spectrum in the low mass range indicate that this precursor m/z belongs to the glycopeptide with composition H5N4F1K1S1[NK-TMT]. Oxonium (B-)ions are highlighted in orange. Y-ions are highlighted in black and blue for either singly or doubly charged, respectively. Unassigned ions in grey are unknown. The Kdn motif is not specifically assigned to the α1,6- antenna or the α1,3-antenna. Fragmentation data of the mono-sialylated analytes is shown in Fig. S6.
《3.2. Expression of Kdn in a urinary PSA cohort》
3.2. Expression of Kdn in a urinary PSA cohort
To investigate whether the Kdn motif could also be detected on PSA derived from patients’ urine, our previous clinical cohort [27] was reanalyzed with additional patient samples being included (a total of 52 individuals with elevated serum PSA concentrations > 3 ng·mL–1 ). The repeatability of the applied urinary PSA assay was previously validated by determining the intra- and inter-day precision over three different days with three replicates per day, and a system suitability sample was measured prior and after each measurement batch to monitor the performance of the CE–MS [27]. Male urine was considered unsuitable to use during the development of the PSA capturing procedure, as it contains PSA. In contrast, FUP contains no PSA, and the matrix is the closest to that of male urine samples; hence, it was chosen to use for protocol development. By spiking a PSA standard to the FUP, we were able to validate the performance of the overall assay.
The data of nine individuals were excluded, as more than one third of all PSA glycopeptides were not observed due to low signal intensity. The remaining data of 43 patients’ urine were included in the dataset (21 PCa and 22 non-PCa; clinical information is provided in Table S1). This resulted in the overall identification of 71 PSA N-glycopeptides, including the distinction of sialic acid isomers. The data was visualized by means of PCA, and the clustering of the positive controls (FUP spiked with PSA standard from seminal plasma) from both batches indicated that no substantial differences were present between the batches, even though two different time points were used for the processing, as well as the difference in storage and freeze-and-thaw cycles (Fig. S8 in Appendix A). The clustering of the pooled patient sample (including 0.5 μL of all captured and digested samples of batches 1 and 2) within the individual patient samples illustrates the low technical variability of the CE–MS measurements. In agreement with the PSA derived from seminal plasma, Kdn sialylation also had an overall low abundance in the clinical cohort (Table S1 and Fig. S8).
In the PCa samples, a relative abundance of 4.15% ± 1.58% was found for H5N4K1[NK], 0.15% ± 0.04% for H5N4F1K1[NK], 0.27% ± 0.15% for H5N4K1S1[NK], and 0.95% ± 0.39% for H5N4F1K1S1 [NK]. In the non-PCa samples, a relative abundance of 4.91% ± 1.48% was found for H5N4K1[NK], 0.15% ± 0.04% for H5N4F1K1 [NK], 0.29% ± 0.14% for H5N4K1S1[NK], and 0.96% ± 0.24% for H5N4F1K1S1[NK]. A large variation in Kdn sialylation was observed with an average relative standard deviation (RSD) of 41.20% (PCa patients), 32.44% (non-PCa patients), and 36.70% (all patients), implying a large biological variation. Interestingly, tryptic PSA glycopeptides with the theoretical mass of 2133.806 Da (corresponding to the N-glycopeptide with the composition H5N4K1[NK] or H6N3S1[NK]) were found to be 100 times higher in relative abundance in the cohort samples derived from urine compared with the PSA standard derived from seminal plasma. The fragmented precursor mass belonging to both H5N4K1[NK] and H6N3S1[NK] revealed the presence of both analytes in the sample (Fig. S9 in Appendix A). However, the fragments derived from H6N3S1[NK] appeared to be more abundant compared with those from H5N4K1[NK]. Finally, no significant differences between different disease conditions (PCa vs non-PCa) were found for the Kdn features in urine.
《4. Discussion》
4. Discussion
《4.1. Expression of Kdn on mammalian PSA》
4.1. Expression of Kdn on mammalian PSA
Previously, we described the presence of analyte H6N3(F1)S2 in PSA derived from seminal plasma [28] and from the urine of individuals with elevated PSA serum concentrations (> 3 ng·mL–1 ) [27]. However, we were unable to elucidate the structure of these N-glycans, and it remained unclear whether these N-glycans were complex or hybrid types and where the postulated second sialic acid would be positioned. To further investigate this, we studied the PSA standard derived from seminal plasma with MS/MS and detected the unidentified N-glycans in the PSA standard. By combining the evidence obtained from four different analytical approaches (Table 1), we were able to assign these N-glycans to the occurrence of Kdn sialylation. It should be noted that the N1K1 and H1S1 compositions are isomeric and we were able to (partially) reassign the previously assigned H6N3(F1)S1 and H6N3(F1)S2 N-glycans to four Kdn-containing N-glycans (H5N4K1, H5N4F1K1, H5N4K1S1, and H5N4F1K1S1). Interestingly, the distinct oxonium ion of H1N1K1 was observed with all four complementary platforms, while the distinct oxonium ion of K1 was observed only with PGC-nanoLC–MS and RP-nanoLC–MS (Orbitrap). This result might be related to a difference in linkage stability between the Kdn and Neu5Ac monosaccharides that are attached to a galactose and warrants further exploration.
With the CE–MS, isomeric separation was observed for all four Kdn-containing N-glycan compositions (Figs. 1, Figs. S1 and S10 in Appendix A). However, some differences were observed; for example, three isomers were observed for the composition H5N4F1K1S1 by means of CE–MS (Fig. 1 and Fig. S1), whereas four isomers were observed by means of RP-nanoLC–MS (Q-ToF), see Fig. S4(a), and the same observation was made for the mass corresponding to the non-fucosylated N-glycan (H5N4K1S1). To obtain information regarding whether the isomers were related to different sialic acid linkages of Kdn, sialic acid linkage-specific derivatized tryptic PSA glycopeptides were analyzed. The findings from these experiments suggested that the Neu5Ac sialylated antenna varied in linkage, while the Kdn sialylated antenna was only observed in the α2,3 configuration (Fig. 2). These findings are in contrast to those from a previous study, which reported the accumulation of complex free N-glycans in human PCa tissues, with Kdn linked in both the α2,3 and α2,6 configurations to galactose [21]. Moreover, the researchers stated that the α2,6-Kdn N-glycans were the dominant form in these samples and that the accumulation was most probably related to insufficient degradation. It should be noted that α2,6- Kdn N-glycans could still be present on the PSA in our study but be below the limit of detection of our analytical methods. In addition, Kdn antenna occupancy was resolved by PGC-nanoLC–MS analysis, revealing it to be the main determinant of the isomer separation of Kdn-containing glycans.
《4.2. Expression of Kdn in a urinary PSA cohort》
4.2. Expression of Kdn in a urinary PSA cohort
Glycosylation reflects human health and disease. Altered glycosylation is a feature of several diseases, although it is not clear whether the altered glycosylation is caused by or results in a disease [40]. The role of glycosylation in medicine is expanding with increasing knowledge on glycan structures and functions, as many different technologies have been developed for the analysis of glycans and glycoconjugates. For example, MS techniques enable the identification and characterization of glycans, while glycoengineering and chemoenzymatic techniques for the synthesis of glycans enable the development of optimized glycotherapeutics (i.e., preventive (vaccines), predictive, and personalized glycomedicine) [41–43]. Aberrant glycosylation has demonstrated its potential as a biomarker for the better targeting of disease diagnostics and prognosis and as a possible target for therapies [44]. Many glycanbased therapeutics are currently available or under development using glycans as therapeutic drugs or as carriers of therapeutic drugs [40,45–47].
In this study, we report for the first time on Kdn-containing N-glycans on PSA derived from seminal plasma. As demonstrated previously, elevated levels of Kdn (free monosaccharide or conjugated) in human cancer cells and tissues imply that the sugar is associated with cancer development [40]. Thus, Kdn modifications have biomarker potential and may eventually serve as a target for cancer therapy. Therefore, it is interesting to explore Kdn modifications on PSA derived from different biofluids, including urine and serum.
In this study, we explored the urinary glycome, as analyzing the glycomic profile of serum PSA remains challenging: ① Its concentrations are at least 100 times lower compared with urine [48,49], causing it to require a highly sensitive analytical platform; ② plasma is a highly complex and protein-rich matrix, making the purification or enrichment of PSA challenging; and ③ PSA has a relatively low abundance in serum/plasma compared with other proteins, which increases the risk of aspecific binding and complicating the analysis. In addition, several studies have already revealed the biomarker potential of altered urinary glycomic profiles [50–52], and the collection of urine is less invasive for patients. Although no significant differences between different disease conditions (PCa vs non-PCa) were found in the urine, it should be taken into account that a somewhat small cohort was explored and the urine PSA samples showed high diversity (e.g., high variety in PSA concentrations, a relative low number of patients per Gleason score, different clinical stages of tumor, etc.). Therefore, investigation with a larger cohort is recommended before strong conclusions can be drawn about the diagnostic value of this uncommon monosaccharide.
In addition, as the PSA derived from seminal plasma (positive control) was obtained from healthy individuals, it would be interesting to investigate whether the urinary PSA N-glycome of healthy men also shows a higher abundancy of the N-glycan H6N3S1[NK]/H5N4K1[NK] and whether this is a feature related to individuals with elevated PSA concentrations. Moreover, based upon our findings, the N-glycan assignments of previous glycomic studies on PSA, which identified the presence of H6N3(F1)S1 [28,50], should be reevaluated, taking into account that PSA could also contain N-glycans occupied with a Kdn motif and that the previously identified N-glycan might contain H5N4(F1)K1 or that both species are present. It should be noted that this consideration may also apply to other, non-PSA related, N-glycomic studies and that these datasets may therefore require reevaluation as well, in order to investigate the presence of Kdn-containing N-glycans. In more general terms, Kdn may be far more common than is currently thought, and considering Kdn in the compositional assignment of mammalian N-glycans is warranted.
MS-based methods possess great potential for human disease diagnosis [53], as they allow the identification and quantification of active compounds in many clinical areas, such as newborn screening, therapeutic drug monitoring, drugs of abuse, and clinical toxicology [54–56]. The development of advanced MS technologies has pushed clinical MS toward the analysis of peptides and proteins for diagnostic applications, although the quantitative analysis of such compounds—especially glycopeptides—by MS is still challenging. A targeted approach is preferred for MS-based diagnostic examination. Recently, a number of MS-based in vitro diagnostics have been adopted in routine clinical practices, and more can be expected to undergo the transition from lab to clinic in the near future [57,58]. Its remarkably high sensitivity, specificity, and capability to test for multiple diseases in a single measurement make this technology highly powerful in disease detection and therapy monitoring. In the case of the promising PCa biomarkers discovered in free Kdn or in Kdn-containing glycans that may be free or conjugated, cohort studies and clinical trials of the MS-based diagnostic methods should be undertaken for the translation of these biomarkers from discovery to standard clinical practices. Elevated levels of free and conjugated Kdn in humans have been linked to the occurrence of antibodymediated inflammation, as antibodies against Kdn-glycans have been detected in pooled human immunoglobulins [14]. Thus, pathological conditions that elevate Kdn levels could result in antibody-mediated inflammatory pathologies [14]. Kawanishi et al. [14] showed that the ingestion of mannoses led to an increased excretion of free Kdn in human urine, and proposed the hypothesis that the biosynthesis of free Kdn is a critical metabolic pathway that buffers potentially toxic concentrations of cytosolic mannose 6-phosphate and fructose 6-phosphate under conditions of excess mannose in mammals. A mechanism of elevated free Kdn expression in human cancers cells has been proposed by Go et al. [59]: To summarize, the common feature of advanced localized tumor hypoxia induces the activities of crucial enzymes (i.e., Neu5Ac-9-P synthase and phosphomannoisomerase (PMI)) and the expression of messenger RNA (mRNA) for corresponding enzymes in the Kdn biosynthetic pathway [59]. In addition, hypoxia enhances the mannose-induced increase of free Kdn expression [59]. Research has shown that the enzymes Neu5Ac-9-P synthase and CMP-sialic acid synthase—both of which are involved in the biosynthesis of Neu5Ac- and Neu5Gc containing glycans in mammals—also catalyze the synthesis of Kdn and Kdn-containing glycans, albeit with much lower efficiency [18,60]. Furthermore, a study on human cell lines showed that gene mutation (PMI-knockout) and zebrafish Cmas gene transfection can force Kdn incorporation on cell membrane glycans, thereby enhancing Kdn utilization, which implies that Kdn has limited utility in human glycosylation under natural conditions [14]. However, further investigations are needed to fully understand how Kdn is incorporated in the human glycome. Moreover, future endeavors should also focus on the presence of Kdn sialylation in other biofluids and in other human glycoproteins. Finally, studies have shown elevated levels of free Kdn and Kdn sialylation in several human cancers, as well as in end-stage renal disease. It is still unclear what role Kdn plays in these diseases; therefore, the association of Kdn with these human diseases should be addressed. Finally, in relation to human diseases, the potential of free Kdn and Kdn-containing glycans as a valuable glycan biomarker or a target for cancer therapy should be exploited.
《5. Conclusions》
5. Conclusions
In this study, we provided evidence that Kdn sialylation occurs on N-linked glycans of PSA derived from different biofluids (urine and seminal plasma). Moreover, it is very likely that this monosaccharide is not solely present on PSA but is also on other mammalian glycoproteins and may have been misinterpreted in previous mass spectrometric studies, as the N1K1 and H1S1 compositions share the same mass. Further studies are recommended to explore the distribution of Kdn in human glycoproteins and tissues, and to investigate the biosynthesis and biological relevance of Kdn glycoconjugates.
《Acknowledgments》
Acknowledgments
The authors would like to thank Arnoud de Ru, George M.C. Janssen, Carolien A.M. Koeleman, and Irina Dragan for their contributions to this study. This research was supported by the Chinese Scholarship Council, Cure for Cancer Foundation and Astellas Pharma B.V.
《Authors’ contributions》
Authors’ contributions
Wei Wang performed the experiments and data analysis. Tao Zhang performed the experiments and data analysis regarding PGC-nanoLC–MS. Jan Nouta and Guinevere S.M. LageveenKammeijer performed the experiments regarding the clinical cohort. Peter A. van Veelen provided the Orbitrap measurements. Wei Wang, Manfred Wuhrer, and Guinevere S.M. LageveenKammeijer conceptually designed the work. and wrote the manuscript. All authors read and commented on the manuscript.
《Compliance with ethics guidelines》
Compliance with ethics guidelines
Wei Wang, Tao Zhang, Jan Nouta, Peter A. van Veelen, Noortje de Haan, Theo M. de Reijke, Manfred Wuhrer, and Guinevere S.M. Lageveen-Kammeijer declare that they have no conflict of interest or financial conflicts to disclose.
《Data availability》
Data availability
The raw mass spectrometric data files that support the findings of this study and the clinical cohort data files are available in MassIVE in .mzXML format, with the identifier MSV000089140 [https://doi:10.25345/C5BG2HF07]. All other data supporting the findings of this study are available from the corresponding author on request.
《Appendix A. Supplementary material》
Appendix A. Supplementary material
Supplementary data to this article can be found online at https://doi.org/10.1016/j.eng.2023.02.009.


 京公网安备 11010502051620号


