

《1. Introduction》
1. Introduction
Gastrointestinal (GI) cancers, including digestive tract (mouth, throat, esophagus, stomach, colorectum, and appendix) and digestive organ (pancreatic and hepatobiliary) carcinomas, are the most common malignancies, accounting for approximately 39% of all cancer deaths worldwide [1]. In China, among the new cancer patients reported in 2020 (nearly 4.5 million), 478 508 (10.47%) had gastric cancer (GC), 555 477 (12.16%) had colorectal cancer (CRC), and 324 422 (7.10%) had esophageal cancer (EC) [2]. The main health challenges caused by GI cancers have imposed a heavy burden on the healthcare system [3]. Early diagnosis has been shown to be of great clinical significance for cancer management; however, commonly used noninvasive diagnostic approaches lack sufficient accuracy.
Glycosylation is an enzyme-catalyzed post-translational reaction by which oligosaccharides are transferred to specific sites on biological macromolecules (e.g., proteins and lipids) and together form glycoconjugates (i.e., glycoproteins and glycolipids) [4–6]. Glycosylation aberrations can be detected in the tumor tissues and biological fluids of cancer patients. The glycosylation signatures change dramatically along with the process of malignant transformation and tumor progression [7,8]. As such, manifold serological glycoproteins have been widely employed as tumor markers, such as carbohydrate antigen 19–9 (CA19-9) for GI cancers, carcinoembryonic antigen (CEA) for colon cancer, alphafetoprotein (AFP) for liver cancer, carbohydrate antigen 125 (CA125) for ovarian cancer, and prostate-specific antigen (PSA) for prostate cancer [9]. However, these biomarkers possess insufficient sensitivity (Se) and specificity (Sp) [10]. In addition, cancerspecific cell-surface glycophenotypes have been investigated in clinical settings and serve as treatment targets rather than as diagnostic biomarkers for high-throughput screening at the population level. Serological glycoproteins that carry out regulating functions in tumorigenesis, as well as relevant detection techniques, must be identified for the diagnosis and subtype differentiation of GI cancers.
As a major component of humoral immunity and the most abundant immunoglobulin in human plasma, immunoglobulin G (IgG) plays a vital role in the inflammatory response [11,12]. Each IgG contains two N-linked glycosylation sites at asparagine 297 (Asn-297) of the fragment crystallizable (Fc) segment in heavy chains [13]. N-glycans in the Fc region regulate the function of IgG effectors by affecting the binding affinity of Fc receptors [4,14,15]. IgG glycosylation responds quickly to physiological or pathological changes but remains relatively stable within healthy individuals [16]. By detecting glycoconjugates, the features of cancer-associated IgG glycosylation can be displayed. Studies have explored the potential role of the glycol phenotypes of IgG in hepatic, colorectal, gastric, lung, and ovarian cancers [17–20].
Taking advantage of the progress that has been achieved in glycomics analyses, we conducted this investigation to comprehensively analyze the features of IgG N-glycosylation in four types of GI cancer—that is, EC, GC, CRC, and pancreatic cancer (PC)—and to evaluate the performance of glycan-based models for diagnosing GI cancers and subtypes.
《2. Materials and methods》
2. Materials and methods
《2.1. Study participants》
2.1. Study participants
This case-control study included 749 GI cancer patients who were hospitalized at the Cancer Hospital, Chinese Academy of Medical Sciences, Beijing, China, between October 2018 and January 2020 (Fig. S1 in Appendix A). Among them, 100 patients had EC, 121 had GC, 328 had CRC, and 200 had PC. In addition, 112 healthy participants of similar ages were recruited as controls.
The inclusion criteria for cancer patients were as follows: ① patients diagnosed with EC (International Classification of Diseases Tenth Revision (ICD-10) code, C15), GC (C16), CRC (C18), or PC (C25) through histopathological examination of tissue biopsies; ② histological diagnostic criteria conforming to the World Health Organization (WHO) Classification of Tumours (4th edition), Volume 1: Digestive System Tumours [21]; ③ no other severe somatic or psychiatric disorders; and ④ not enrolled in other clinical trials. The exclusion criteria were: ① patients with severe infectious diseases and cardiovascular diseases, such as coronary heart disease、(I25.1) and stroke (I64); ② patients with psychiatric disorders (F99); and ③ patients who declined to participate in this study.
The study protocol was approved by the ethics committee of the National Cancer Center/Cancer Hospital, Chinese Academy of Medical Sciences (No. NCC1839). Written informed consent was obtained from each participant.
《2.2. Collection and storage of blood samples》
2.2. Collection and storage of blood samples
Blood samples were collected by venipuncture after 12 h of overnight fasting. The separated plasma and serum were used for the detection of IgG N-glycans and routine biochemical tests, respectively. All collected blood samples were processed within 8 h and stored at –80 °C until further measurement.
《2.3. Measurements of demographic and clinical variables》
2.3. Measurements of demographic and clinical variables
Demographic information was obtained through in-person interviews with participants and/or their families. Hematology and biochemical parameters, including fasting blood glucose (FBG), total cholesterol (TC), high-density lipoprotein cholesterol (HDL-C), low-density lipoprotein cholesterol (LDL-C), and triglycerides (TG), were determined with an automatic analyzer (Hitachi, Japan) (Table 1).
《Table 1》
Table 1 Characteristics of the study participants.
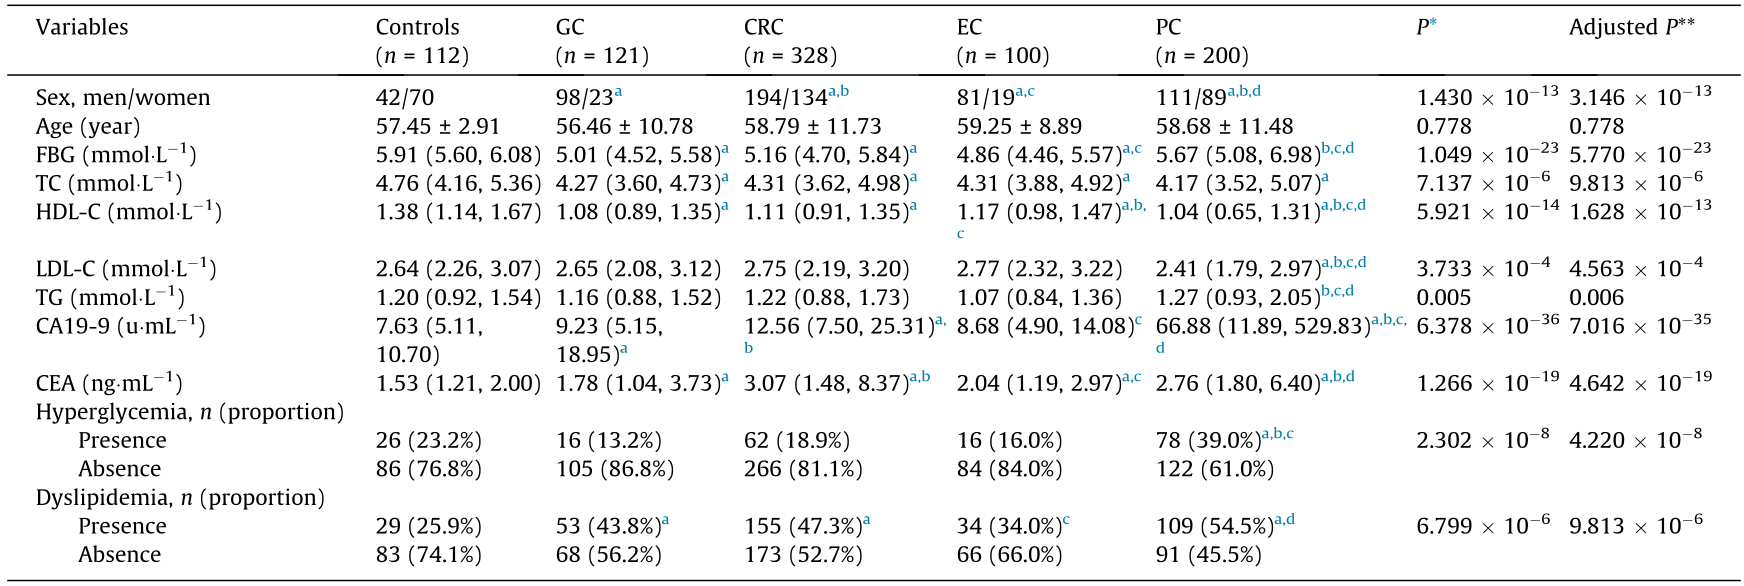
* P value of comparison between five groups; ** false discovery rate (FDR) adjusted P value using the Benjamini–Hochberg procedure, where post hoc comparisons were performed and adjusted with the Benjamini–Hochberg method.
a Statistically significant compared with controls.
b Statistically significant compared with GC
c Statistically significant compared with CRC.
d Statistically significant compared with EC.
《2.4. Analysis of cancer biomarkers and inflammatory cytokines》
2.4. Analysis of cancer biomarkers and inflammatory cytokines
The levels of circulating CA19-9 and CEA were measured by means of immunochemiluminometric assays (AutoLumo A2000Plus, China). The normal range of CA19-9 was 0–37 U·mL–1 , and participants with CA19-9 > 37 U·mL–1 were defined as abnormal [22]. Serological CEA levels were classified into two groups: normal (≤ 5.0 ng·mL–1 ) and elevated (> 5.0 ng·mL–1 ) [23].
To identify the levels of inflammatory cytokines among GI cancers, a subset of the participants (45 EC, 45 GC, 45 CRC, and 45 PC patients, and 48 healthy controls) were randomly selected to test against nine inflammatory cytokines—that is, interleukin-1β (IL-1β), IL-4, IL-6, IL-17A, IL-17F, IL-31, IL-33, soluble CD40 ligand (sCD40L), and tumor necrosis factor-α (TNF-α), using the Bio-Plex 200 suspension array system (Bio-Rad, USA) with the Bio-Plex Pro Human Th17 Cytokine 15-plex Assay (Bio-Rad) [24].
《2.5. Analysis of IgG glycans》
2.5. Analysis of IgG glycans
Isolation of plasma IgG and release of IgG Fc N-linked glycans were performed in accordance with the approaches established previously [25,26]. In brief, a 100 μL plasma sample was added to a 96-well protein G monolithic plate (BIA Separations, Slovenia) for IgG isolation. Isolated IgG samples were denaturized with 1 mL of 0.1 mol·L–1 formic acid and immediately neutralized with 1 mol·L–1 ammonium bicarbonate. For N-glycan release, 4 μL of PNGase F enzyme was added to the IgG samples and incubated in a 37 °C water bath for 18 h.
The released N-glycans were labeled with 2-aminobenzamide (2-AB) and then transferred into an oven at 65 °C for 3 h. The 2- AB labeled glycans were analyzed with hydrophilic interaction liquid chromatography using an ultra-performance liquid chromatography (HILIC-UPLC) instrument (Walters Corporation, USA), by which 24 IgG glycan peaks (GPs) were detected. The structures of these GPs were identified by reference to a dataset established by mass spectrometry [27]. The level of each glycan was quantitated by the percentage of the area of the relevant chromatogram peak to the integrated area of all glycans. Furthermore, we calculated the 54 derived glycan traits using the measurements of the initial glycans, which consisted of sialylation, bisecting N-acetylglucosamine (GlcNAc), galactosylation, and fucosylation traits (Table S1 in Appendix A) [28].
《2.6. Statistical analysis》
2.6. Statistical analysis
The assumption of normal distribution of continuous data was tested using the Kolmogorov–Smirnov test. The mean and standard deviation (SD) were used to represent normally distributed data; otherwise, the median (M) and interquartile range (IQR) were employed when a normal distribution was absent. One-way analysis of variance (ANOVA) was performed to analyze the betweengroup difference in normally distributed variables; otherwise, the nonparametric test (i.e., Kruskal–Wallis test) was carried out. Moreover, multiple comparison correction was performed with the Benjamini–Hochberg method of false discovery rate (FDR) correction. Categorical variables were expressed by frequency and percentage (%) and analyzed by the chi-squared test (χ2 test), accompanied by a post hoc Bonferroni correction. Canonical correlation analysis (CCA) was used to explore the overall correlation between the 24 glycan structures (x) and inflammatory cytokines (y). Identified variables with a statistically significant impact on the canonical variables were judged by the canonical loadings. In general, an absolute value greater than 0.30 was used to define significant loadings [29]. A clustering analysis and heatmap were undertaken to further explore the inflammatory cytokines significantly associated with GI cancers [30].
We established glycan-based diagnostic models for GI cancers. Internal validation was performed by randomly splitting the participants into training and validation sets at a certain ratio (7:3) [31]. First, the least absolute shrinkage and selection operator (Lasso) algorithm was used to screen initial glycans that were significantly associated with GI cancers, thus avoiding overfitting and effectively controlling the model’s complexity. Significant glycans selected with Lasso were then introduced into multivariate logistic regression analysis, with the forward maximum likelihood ratio test being taken as the stopping rule during the model building; in this way, adjusted odds ratios (ORs) and 95% confidence intervals (CIs) were then obtained. A diagnostic model for each GI cancer was developed using the significant glycans. Then, a receiver operator characteristic (ROC) curve was created to evaluate the performance of this model, by which the area under the curve (AUC) value, Se, and Sp were calculated. R software version 4.1.1 (R Core Team, New Zealand) and SPSS software version 25.0 (IBM, USA) were used for statistical analyses. The R package ‘‘glmnet” was used to run the Lasso algorithm. ROC curves and AUC values were generated using the ‘‘pROC” R package and GraphPad Prism (GraphPad Software, Inc., USA). A P value < 0.05 was considered statistically significant.
《3. Results》
3. Results
《3.1. Characteristics of study participants》
3.1. Characteristics of study participants
The demographics, biochemical indicators, and clinical features of the 749 GI cancer patients (mean age 58 years, 484 men and 265 women) and 112 healthy controls are listed in Table 1, as well as in Tables S2–S11 and Figs. S2 and S3 in Appendix A. No statistically significant difference in age was detected between each cancer group and the controls. Significantly lower levels of serum TC and HDL-C were observed among the EC, GC, CRC, and PC patients compared with the healthy control group. The FBG in the EC, GC, and CRC groups was also significantly lower than that in the control group. The prevalence of dyslipidemia was significantly higher in the GC, CRC, and PC patients than in the controls. In addition, the PC patients had a higher prevalence of hyperglycemia than the GC, CRC, and control groups.
《3.2. Description of clinically used cancer biomarkers》
3.2. Description of clinically used cancer biomarkers
The level of CA19-9 in the healthy control group was 7.63 U·mL–1 (IQR: 5.11, 10.70), which was significantly lower than that in the GC (M = 9.23; IQR: 5.15, 18.95), CRC (M = 12.56; IQR: 7.50, 25.31), and PC (M = 66.88; IQR: 11.89, 529.83) groups. The level of CEA in the control group was 1.53 ng·mL–1 (IQR: 1.21, 2.00), which was significantly lower than that in the EC (M = 2.04; IQR: 1.19, 2.97), GC (M = 1.78; IQR: 1.04, 3.73), CRC (M = 3.07; IQR: 1.48, 8.37), and PC (M = 2.76; IQR: 1.80, 6.40) groups.
《3.3. Inflammatory cytokines》
3.3. Inflammatory cytokines
As shown in Tables S12–S22 in Appendix A, the circulating concentrations of IL-1β, IL-31, sCD40L, and TNF-α were significantly higher in the four cancer groups than in the control group. Compared with the EC group, PC patients had significantly higher plasma levels of IL-31, sCD40L, and TNF-α. No significant differences were observed for IL-4, IL-6, IL-17A, IL-17F, or IL-33 between the groups.
A clustering analysis was conducted to identify the patterns of circulating inflammatory cytokines in GI cancers. As shown in Fig. 1, individuals with GI cancers shared similar inflammatory cytokines, which were significantly different from those of the healthy controls (e.g., sCD40L and IL-31).
《Fig. 1》
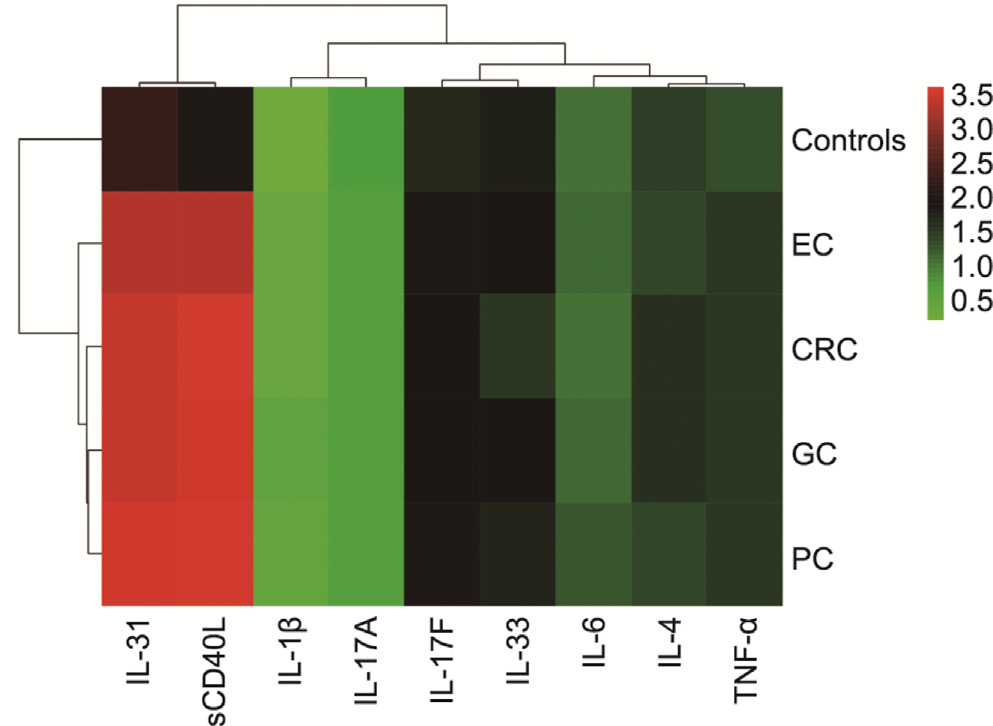
Fig. 1. Clustering analysis of the patterns of inflammatory cytokines in GI cancers.
《3.4. The IgG glycome composition in GI cancer patients》
3.4. The IgG glycome composition in GI cancer patients
Our HILIC-UPLC assay initially identified 24 oligosaccharide chains that were linked to the IgG Fc segment. Of these, there were significant differences in the abundance of 21 glycans between the EC, GC, CRC, PC, and control groups (Table 2; Figs. S4–S7 in Appendix A). We further calculated 54 derived glycan traits using the measurements of the initial glycans [28]. As indicated in Tables S23–S33 in Appendix A, 48 of the 54 derived glycan traits differed between the four types of GI cancer groups and the controls.
Moreover, to explore the modulatory role of IgG N-glycans in the development of GI cancers, we calculated the summary abundances of the four major glycosylation features—that is, sialylation, bisecting GlcNAc, galactosylation, and fucosylation (Table S34 in Appendix A) [13].
《Table 2》
Table 2 A comparison of abundance (%) between 24 initial glycans in the studied groups.
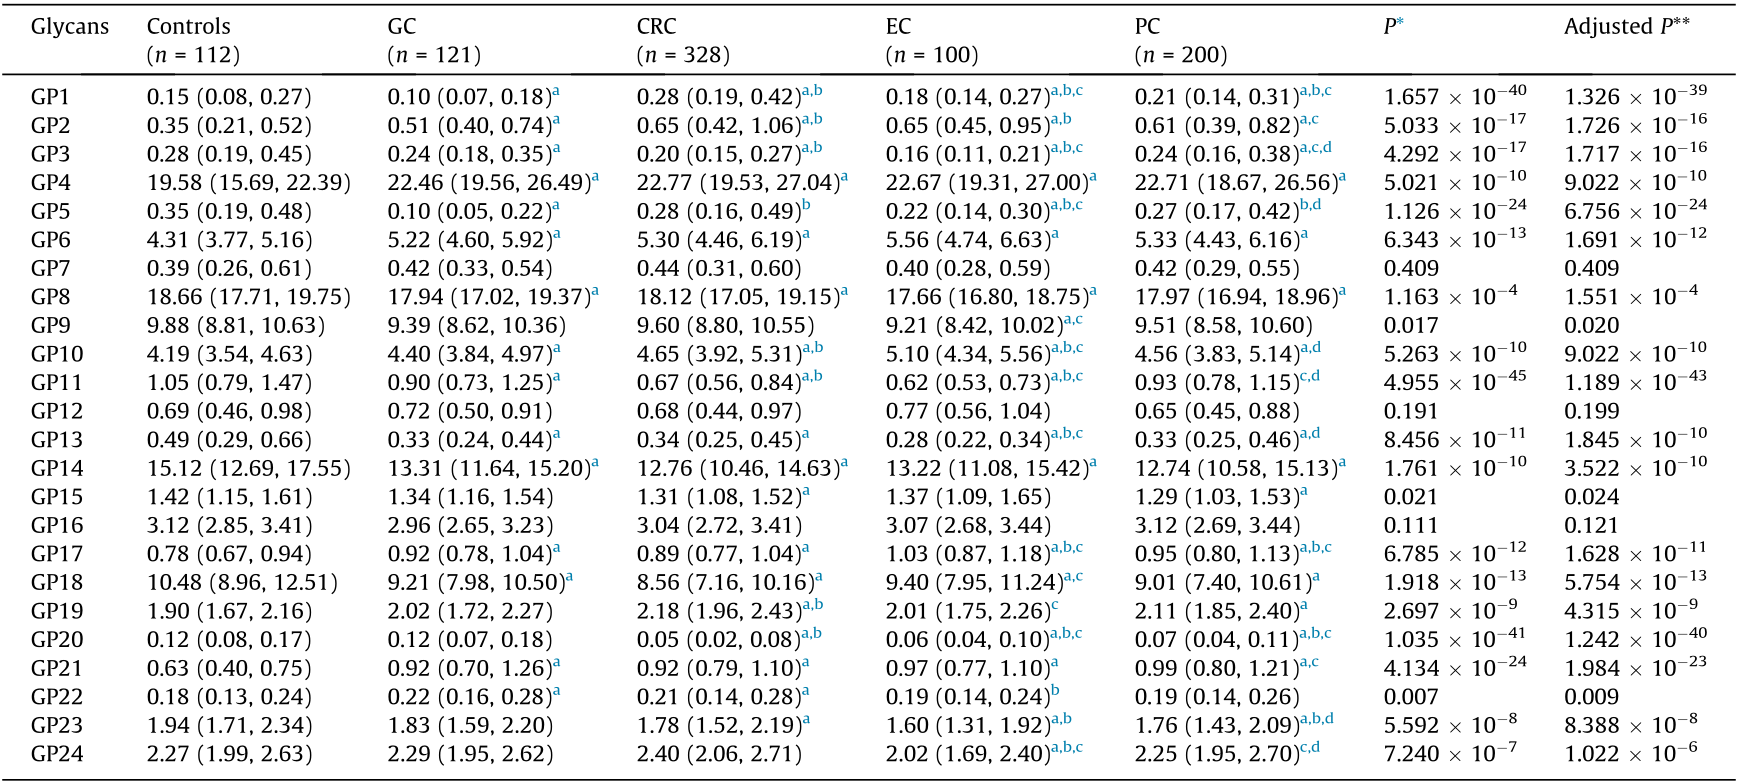
* P value of comparison between five groups; ** FDR adjusted P value using the Benjamini–Hochberg procedure, where post hoc comparisons were performed and adjusted with the Benjamini–Hochberg method.
a Statistically significant compared with controls.
b Statistically significant compared with GC.
c Statistically significant compared with CRC.
d Statistically significant compared with EC.
3.4.1. Galactosylation
As depicted in Table 3, the percentages of glycan structures without a terminal galactose (agalactosylation, G0) were 37.37% in EC, 36.00% in GC, 36.78% in CRC, and 36.85% in PC patients, which were significantly higher than those in the control group (31.42%). The galactosylation traits include glycans with one terminal galactose (monogalactosylation, G1) and two galactoses (digalactosylation, G2) [6]. The abundances of G1 in the EC, GC, CRC, and PC groups were 42.22%, 42.90%, 42.98%, and 43.05%, respectively, which were lower than those in the control group (44.47%). In addition, the abundances of G2 in the EC, GC, CRC, and PC patients (19.75%, 20.40%, 19.30%, and 18.99%, respectively) were also lower than those in the control group (22.93%).
《Table 3》
Table 3 A comparison of the relative abundance (%) of four IgG glycome features.
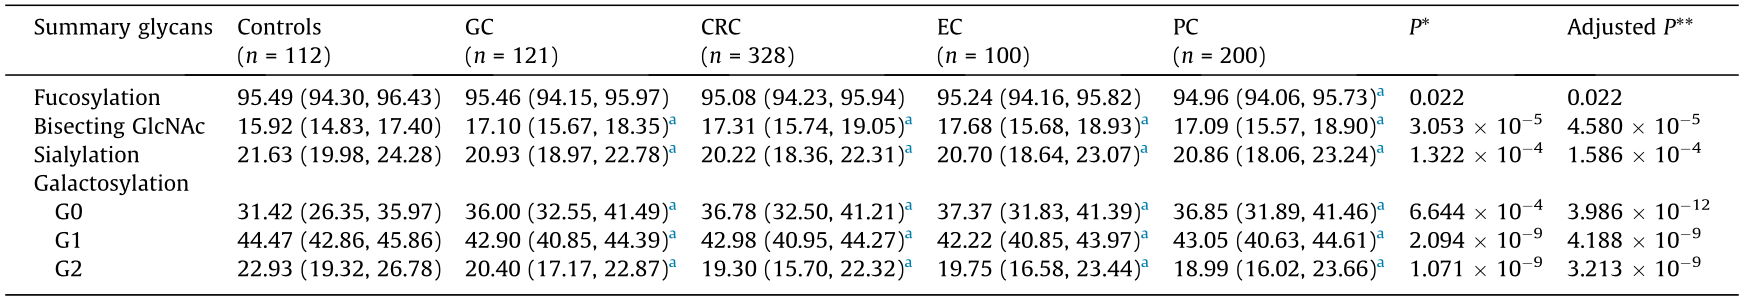
G0: agalactosylation; G1: monogalactosylation; G2: digalactosylation; *P value of comparison between five groups; ** FDR adjusted P value using the Benjamini–Hochberg procedure, where post hoc comparisons were performed and adjusted with the Benjamini–Hochberg method.
a Statistically significant compared with controls.
3.4.2. Sialylation
In total, a lower level of sialylation was identified in the EC (20.70%), GC (20.93%), CRC (20.22%), and PC (20.86%) groups than in the controls (21.63%) (Table 3).
3.4.3. Bisecting GlcNAc
The percentage of glycans with bisecting GlcNAc was significantly higher in the EC (17.68%), GC (17.10%), CRC (17.31%), and PC (17.09%) patients than in the controls (15.92%) (Table 3).
3.4.4. Fucosylation
The level of fucosylation was significantly lower in the PC patients (94.96%) than in the controls (95.49%) (Table 3).
These findings indicated a significant decrease in galactosylated, sialylated, and fucosylated glycans among GI cancers, while bisecting GlcNAc was significantly higher among these glycans. Details on galactosylation, sialylation, bisecting GlcNAc, and fucosylation are provided in Tables S35–S38 and Box S1 in Appendix A.
《3.5. Association of IgG N-glycans with GI cancers》
3.5. Association of IgG N-glycans with GI cancers
As listed in Table S39 in Appendix A, after being adjusted for sex, FBG, TC, HDL-C, and the prevalence of dyslipidemia, four glycans were significantly associated with EC: GP10 (OR: 7.371; 95% CI: 2.301, 23.608; P = 0.001); GP11 (OR: 5.943 × 10⁻⁶ ; 95% CI: 3.061 × 10⁻⁸ , 0.001; P < 0.001); GP14 (OR: 0.758; 95% CI: 0.607, 0.948; P = 0.015); and GP23 (OR: 0.195; 95% CI: 0.055, 0.697; P = 0.012). Meanwhile, sex, FBG, TC, HDL-C, and the prevalence of dyslipidemia showed no significance.
For the logistic regression analysis of GC, GP5 (OR: 4.489 × 10⁻⁴ ; 95% CI: 1.817 × 10⁻⁵ , 0.011; P < 0.001), GP6 (OR: 2.652; 95% CI: 1.625, 4.326; P < 0.001), sex (OR: 0.190; 95% CI: 0.070, 0.519; P = 0.001), FBG (OR: 0.585; 95% CI: 0.435, 0.787; P < 0.001), and TC (OR: 0.438; 95% CI: 0.25, 0.745; P = 0.002) were of significance (Table S40 in Appendix A).
With regard to CRC, two glycans and three covariates were statistically significant: GP2 (OR: 12.941; 95% CI: 3.840, 43.616; P < 0.001), GP20 (OR: 1.305 × 10⁻¹⁰; 95% CI: 3.535 × 10⁻¹⁴, 4.818 × 10⁻⁷ ; P < 0.001), sex (OR: 0.428; 95% CI: 0.203, 0.901; P = 0.026), FBG (OR: 0.647; 95% CI: 0.496, 0.844; P = 0.001), and HDL-C (OR: 0.222; 95% CI: 0.087, 0.566; P = 0.002) (Table S41 in Appendix A).
Four glycans and one covariate were significantly associated with PC: GP17 (OR: 53.358; 95% CI: 9.165, 310.659; P < 0.001), GP19 (OR: 3.855; 95% CI: 1.506, 9.869; P = 0.005), GP20 (OR: 3.076 × 10⁻⁵ ; 95% CI: 1.251 × 10⁻⁷ , 0.008; P < 0.001), GP23 (OR: 0.115; 95% CI: 0.046, 0.286; P < 0.001), and HDL-C (OR: 0.061; 95% CI: 0.022, 0.175; P < 0.001) (Table S42 in Appendix A).
《3.6. Association between IgG N-glycans and inflammatory cytokines》
3.6. Association between IgG N-glycans and inflammatory cytokines
The compositions of IgG N-glycans were significantly correlated with inflammatory cytokines, with a canonical correlation coefficient (r) of 0.556 (P = 0.005) (Fig. 2). Six glycans (GP1, GP2, GP4, GP14, GP15, and GP18) were associated with sCD40L, IL-31, TNFα, IL-17A, and IL-6. Moreover, a strong association was observed between GP18 and the canonical variables, with a loading of 0.497, and the response variable with the highest canonical loading was –0.669 (sCD40L).
《Fig. 2》

Fig. 2. Canonical structures of the IgG N-glycans and inflammatory cytokines. An absolute value of canonical loadings greater than 0.30 was considered significant. All variables are sorted by the absolute value of their canonical loadings. Positive relationships are represented in red boxes, while negative relationships are shown in black boxes.
《3.7. Discrimination of EC, GC, CRC, and PC from healthy controls based on IgG N-glycosylation》
3.7. Discrimination of EC, GC, CRC, and PC from healthy controls based on IgG N-glycosylation
As shown in Figs. 3 and 4, to establish a diagnostic model of GI cancers on the basis of the 24 initial glycans, a Lasso algorithm was used and a logistic regression analysis was carried out, according to which four glycans (GP10, GP11, GP14, and GP23) were employed for the diagnosis of EC (Fig. 3(a)); a ROC curve analysis was used to evaluate the performance of this diagnostic model (Fig. 4(a)). The AUC value was 0.972 (95% CI: 0.945, 0.998), with an Se of 95.3% and an Sp of 95.0%, indicating that the glycan-based model had a significantly better performance than CA19-9 (AUC: 0.693; 95% CI: 0.603, 0.783) and CEA (AUC: 0.797; 95% CI: 0.723, 0.871).
《Fig. 3》

Fig. 3. Logistic regression analyses of the associations between the initial glycans and GI cancers. (a) EC; (b) GC; (c) CRC; (d) PC.
《Fig. 4》
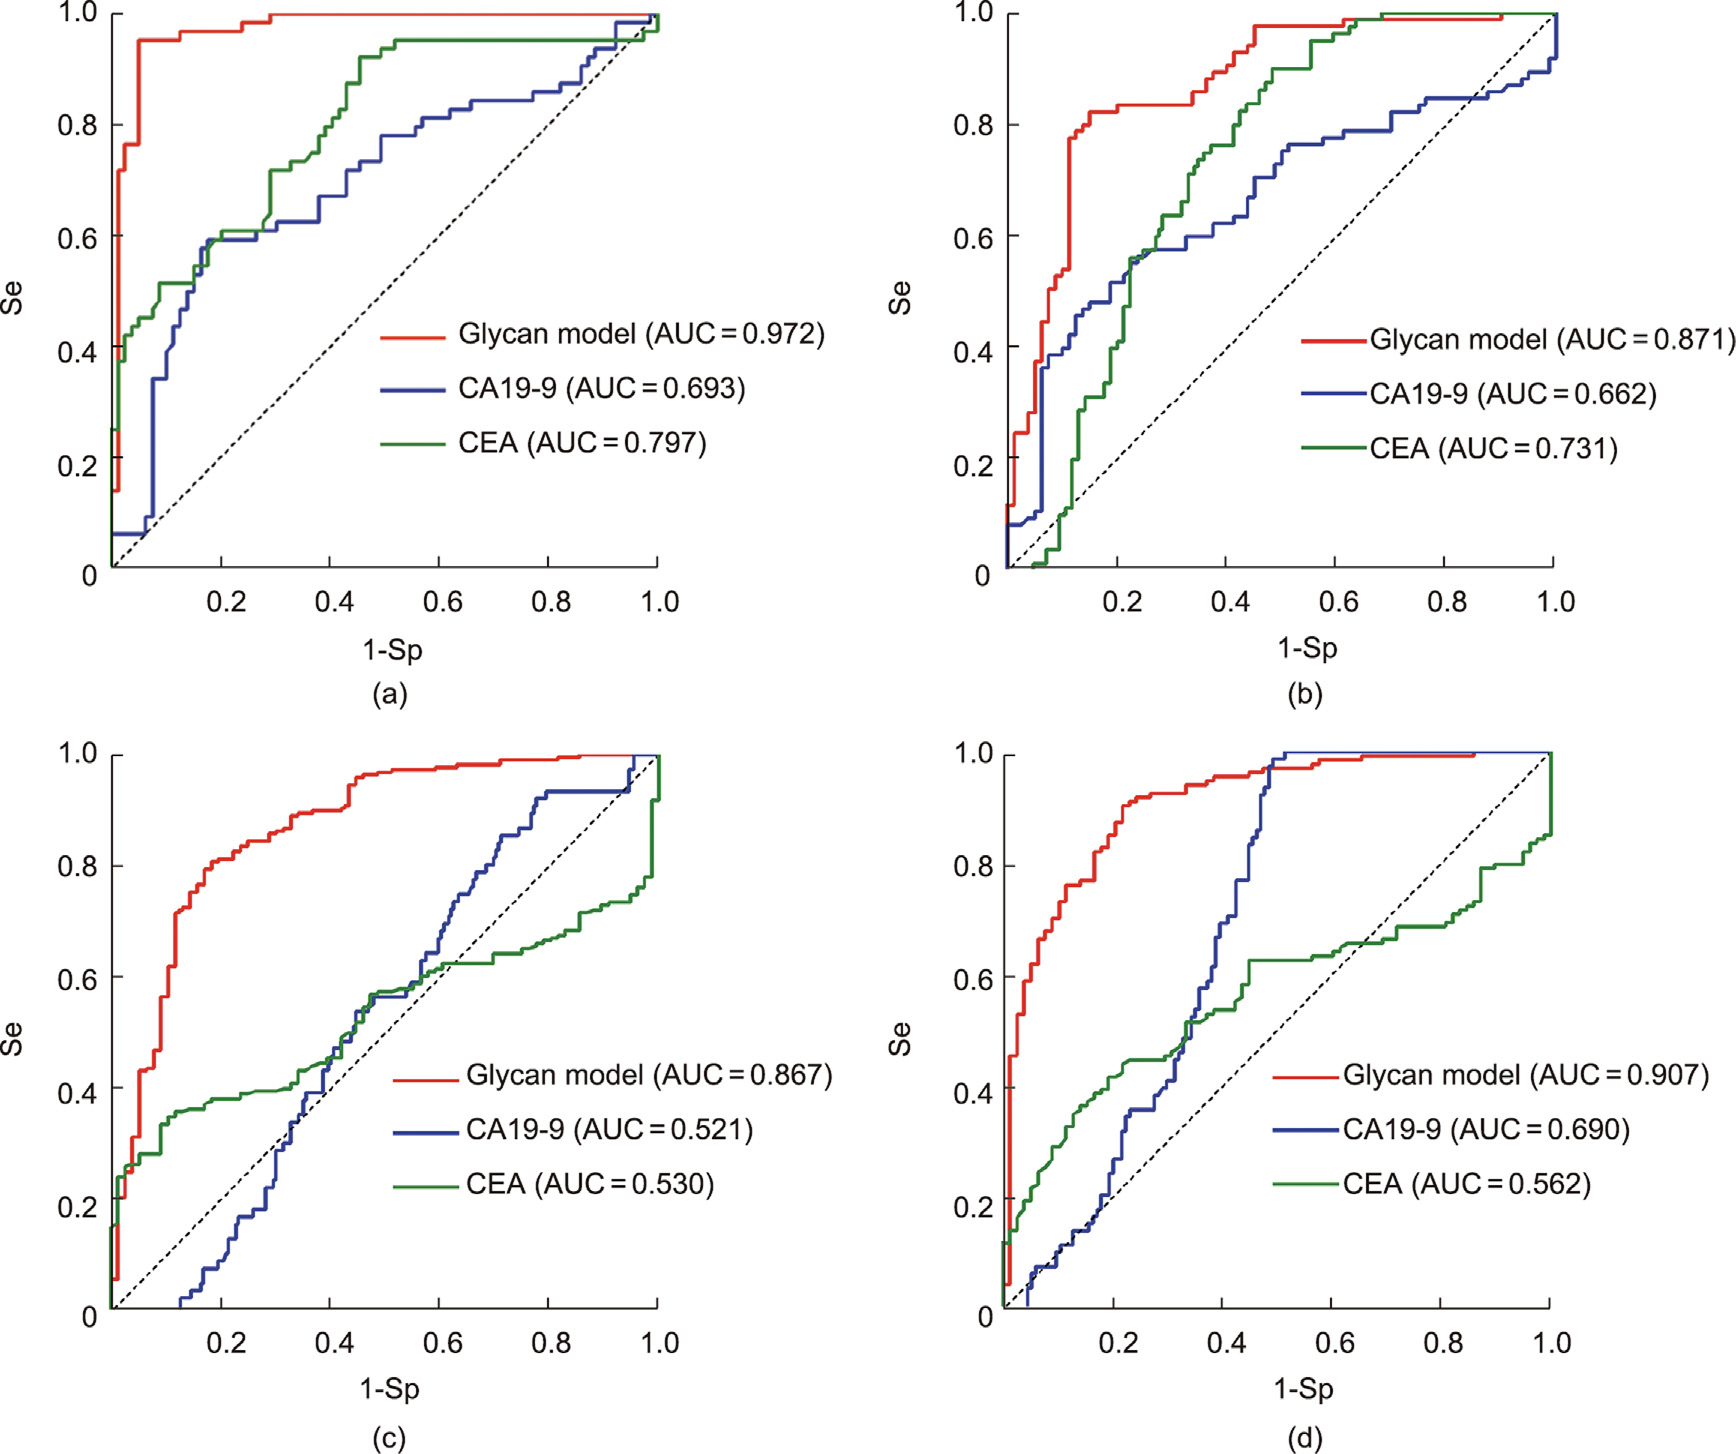
Fig. 4. Receiver operating characteristic curves (ROC) with AUC values for glycan-based prediction models. Glycan model of (a) EC; (b) GC; (c) CRC; (d) PC.
GP5, GP6, and GP18 were employed for the diagnosis of GC, and also demonstrated a better performance (AUC: 0.871; 95% CI: 0.815, 0.926) compared with CA19-9 (AUC: 0.662; 95% CI: 0.577, 0.747) and CEA (AUC: 0.731; 95% CI: 0.653, 0.810) (Figs. 3(b) and 4(b)).
In addition, the diagnostic model of CRC, which consisted of GP2 and GP20, showed a significantly better performance (AUC: 0.867; 95% CI: 0.816, 0.917) than CA19-9 (AUC: 0.521; 95% CI: 0.453, 0.590) and CEA (AUC: 0.530; 95% CI: 0.466, 0.594) (Figs. 3(c) and 4(c)).
Furthermore, GP6, GP8, GP10, GP15, GP17, GP19, GP20, GP21, and GP23 were selected for the diagnosis of PC, and also demonstrated a significantly better performance (AUC: 0.907; 95% CI: 0.865, 0.949) than CA19-9 (AUC: 0.690; 95% CI: 0.620, 0.759) and CEA (AUC: 0.562; 95% CI: 0.486, 0.639) (Figs. 3(d) and 4(d)).
In the validation dataset, the glycan-based models had AUCs of 0.991 (95% CI: 0.977, 0.999), 0.874 (95% CI: 0.791, 0.957), 0.856 (95% CI: 0.785, 0.928), and 0.872 (95% CI: 0.800, 0.944) for EC, GC, CRC, and PC, respectively (Fig. 5).
《Fig. 5》
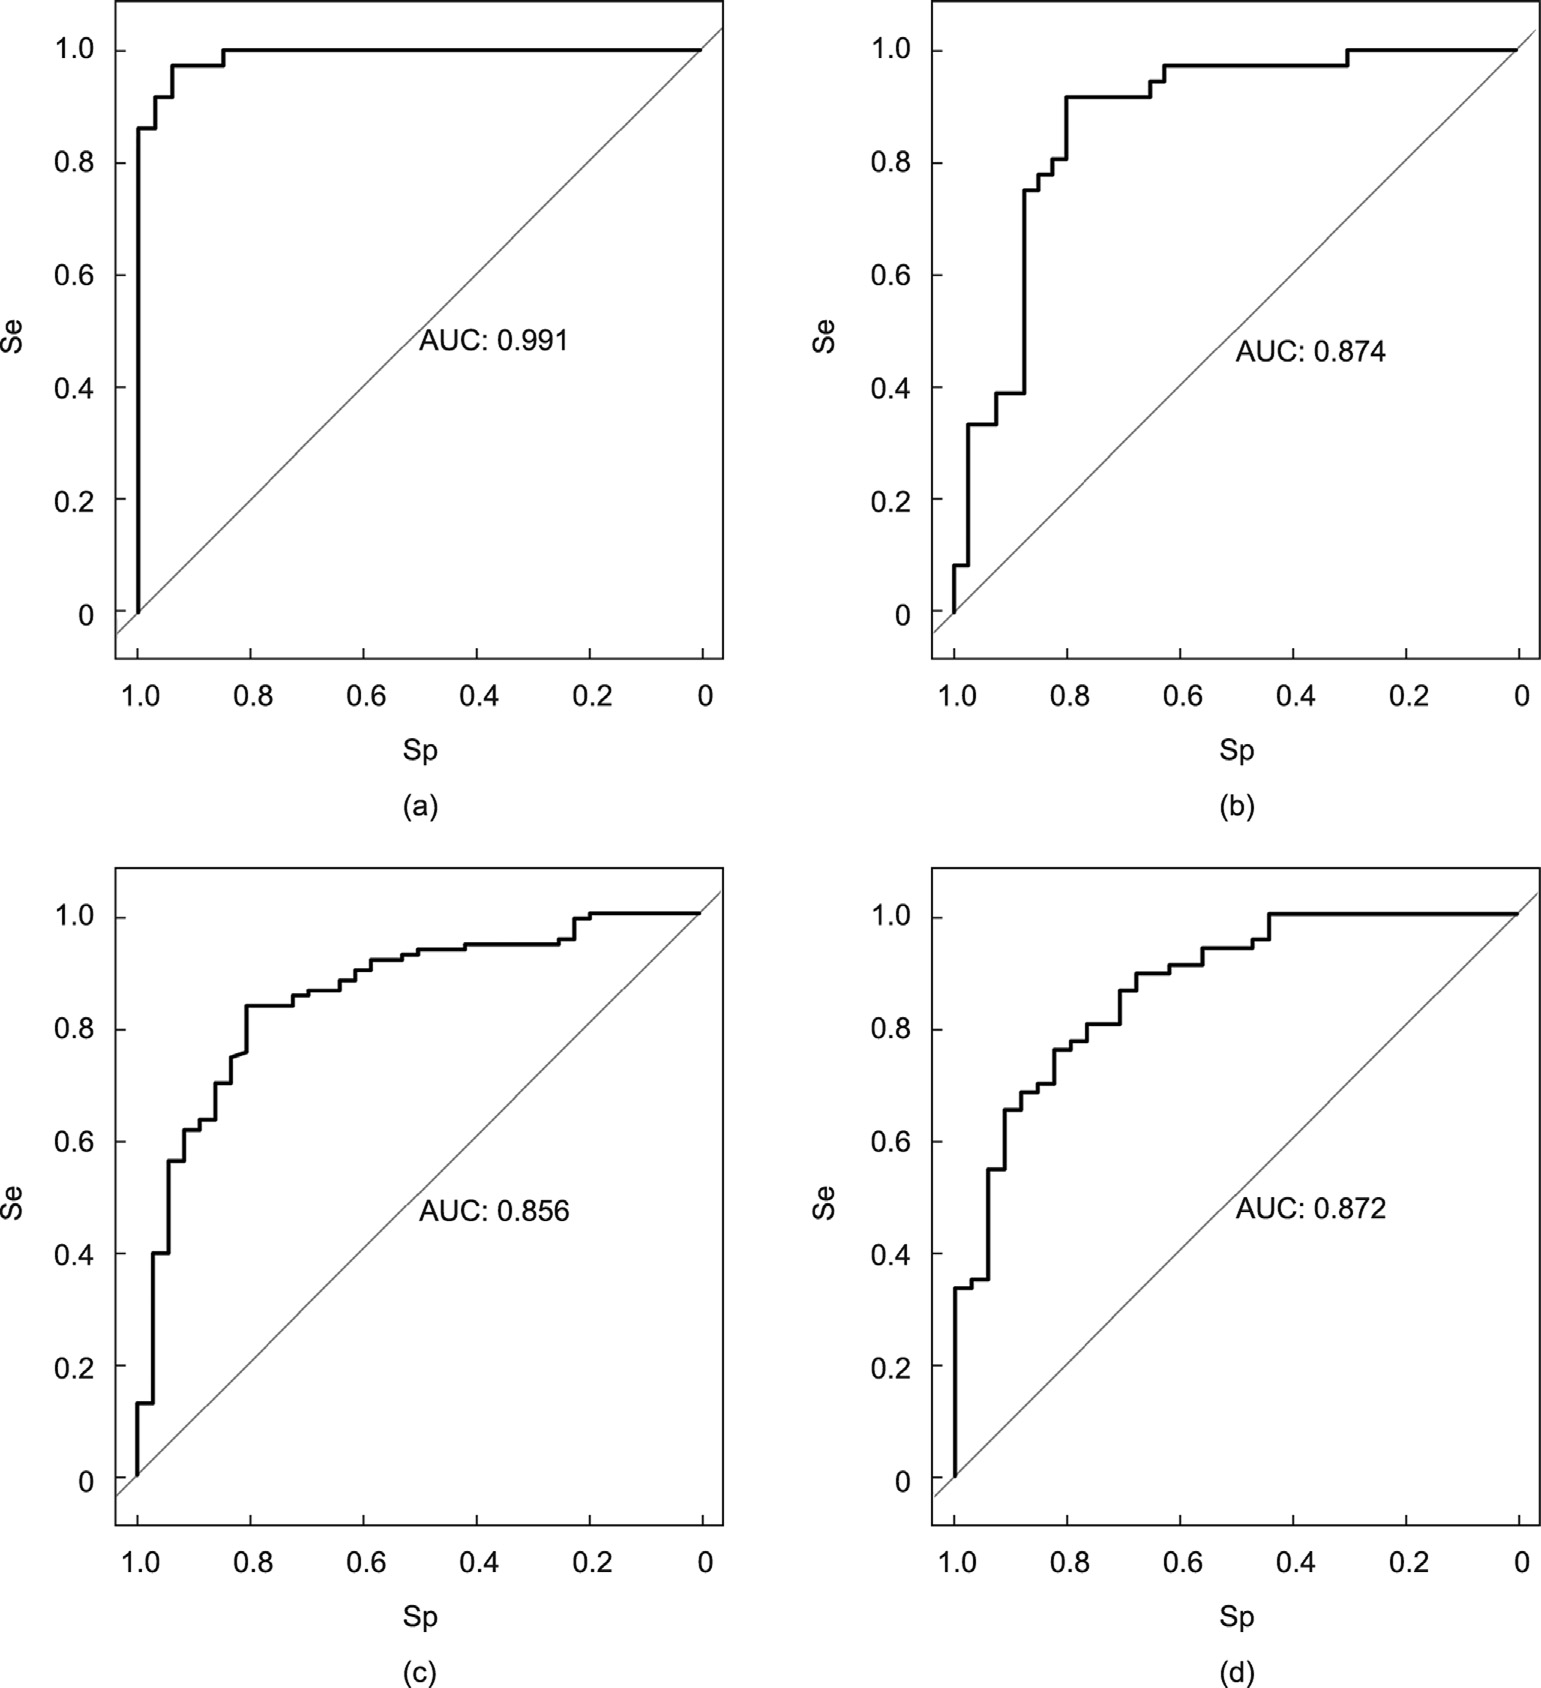
Fig. 5. ROC curves in the internal validation set. (a) EC; (b) GC; (c) CRC; (d) PC.
《3.8. Comparison between glycans in early and advanced GI cancers》
3.8. Comparison between glycans in early and advanced GI cancers
As shown in Tables S43–S46 in Appendix A, the glycosylation patterns were similar in early- and advanced-stage cancer patients.
《3.9. Diagnostic model for GI cancer patients in early and advanced stages》
3.9. Diagnostic model for GI cancer patients in early and advanced stages
In this study, clinical stages I–II were defined as early stage, and stages III–IV were defined as advanced stage (Fig. S3 in Appendix A). Taking 24 glycans as a starting point, a diagnostic model for early-stage EC was established, with four glycans (GP11, GP21, GP23, and GP24) being included in the model (Table S47 in Appendix A). Three glycans (GP11, GP17, and GP23) were selected to establish a diagnostic model for advanced EC (Table S47 in Appendix A).
Regarding a subgroup analysis of GC, two glycans (GP5 and GP6) were employed for the diagnosis of early GC, and two glycans (GP4 and GP5) were selected for developing a diagnostic model for advanced GC (Table S48 in Appendix A). With regard to CRC, four glycans (GP8, GP10, GP11, and GP20) were employed for the diagnosis of early-stage patients, and two glycans (GP2 and GP18) were selected for the diagnosis of advanced patients (Table S49 in Appendix A). Furthermore, two glycans (GP2 and GP13) were employed for the diagnosis of early PC, and six glycans (GP7, GP8, GP17, GP18, GP20, and GP23) were selected for the diagnosis of advanced PC (Table S50 in Appendix A). Details of the model validation are provided in Fig. S8 in Appendix A.
《4. Discussion》
4. Discussion
The massive amount of data generated by high-throughput genomics and proteomics experiments has advanced our understanding of cancer; nevertheless, there is still a surprising scarcity of well-validated, clinically useful biomarkers. In addition to genomics and proteomics, the emerging field of glycomics is gaining importance in glycomedicine and cancer research [32]. Glycan moieties of IgG Fc segments (i.e., galactose, sialic acid, bisecting GlcNAc, and fucose) participate in the pathophysiological process of inflammatory disorders and provide potential for the early diagnosis and targeted treatment of inflammatory diseases, including cancers (Table S51 in Appendix A) [9,25,28,33,34].
This study comprehensively analyzed serological IgG N-glycan profiles in four types of GI cancer (EC, GC, CRC, and PC) by means of an HILIC-UPLC-based high-throughput method. We demonstrated a decrease in IgG sialylation and galactosylation and an increase in bisecting GlcNAc among GI patients. These alterations in IgG glycosylation induced a pathological increase in inflammatory cytokines, such as IL-1β, IL-31, sCD40L, and TNF-α, and contributed to the development of GI cancers. In addition, the IgG N-glycosylation trait has the capacity to serve as a potential biomarker for GI cancer diagnosis and subtype differentiation from healthy individuals, and demonstrates a significantly higher performance than clinically used serological biomarkers such as CA19-9 and CEA. Consequently, high-throughput assay of IgG N-glycans is expected to be exploited for the early diagnosis and targeted treatment of GI cancers.
The mechanism of tumorigenesis is regulated by both acute and chronic inflammation [35,36]. A variety of molecules, especially pro-inflammatory cytokines (e.g., IL-1β, IL-6, and TNF-α), are engaged in the development of cancer [37–40]. Studies have demonstrated that IgG N-glycans modulate the pro- and antiinflammatory balance in both inflammatory and autoimmune diseases [15,41–43]. In the current study, an overall correlation between GI cancer-related IgG N-glycans and inflammatory cytokines was identified, supporting previous findings in the investigation of patients with primary tumors of the GI tract [44]. These findings emphasize the role of IgG N-glycosylation in the regulation of inflammatory response.
IgG sialylation—also known as sialic acid or N-acetylneuraminic acid (Neu5Ac)—plays a role in the anti-inflammatory properties of IgG [45–47]. During the development of IgG N-glycans, the terminal sialic acid residue covalently attaches to galactose and leads to a reduced capacity to ligate Fc RIIIa on natural killer (NK) cells, thereby lowering inflammatory activity via antibodydependent cell cytotoxicity (ADCC) [48,49]. The absence of sialic acid dramatically impacts the function of IgG, shifting from anti- to pro-inflammatory. Consistent with our findings, a decrease in sialylation has also been associated with GI cancers [7,8,50,51].
Galactosylation can promote IgG of its affinity for the inhibitory FcRIIb and thereby increase its anti-inflammatory activities [52]. A decrease in IgG galactosylation—termed agalactosylation—can expose GlcNAc residues; this increases IgG binding with mannose-binding lectin, which results in the upregulation of CDC activity and leads to the initiation of inflammation [5,52–54]. Studies have reported that the complement effector system is extensively activated in various tumor microenvironments, leading to tumor initiation and growth [55]. Consistent with our findings, an elevated level of agalactosylated IgG has been detected in GC, CRC, and PC patients, indicating its role in the development of cancers [8,51,54,56–58]. Studies have also suggested that agalactosylation is strongly correlated with an increase in proinflammatory cytokines such as TNF-α and C-reactive protein (CRP) [59,60]. Our findings showed significantly higher TNF-a levels in EC, GC, CRC, and PC patients, evidencing that the agalactosylation of IgG plays a crucial role in the upregulation of the inflammatory process in cancer.
Fucosylation has been intensively studied due to its mechanisms of antibody-based therapeutics against tumors via ADCC. Fucosylation on IgG inhibits ADCC via decreased FcRIIIa binding on NK cells, downregulating the pro-inflammatory activity of IgG [61,62]. The ADCC activity of IgG without a core fucose on the N-glycan is enhanced by up to 100-fold [63]. A decreased level of fucosylation was observed in PC patients in our study, supporting the findings in another Chinese PC patients, among which significantly lower fucosylation, sialylation and galactosylation were demonstrated [7]. Moreover, lower fucosylated IgG promotes the production of pro-inflammatory cytokines that are secreted by monocytes, including IL-1β, IL-6, and TNF-α [64]. Similarly, fucoserich IgG reduces the production of TNF-α and IL-6, resulting in anti-inflammatory activity [65]. Our findings showed that TNF-α, IL-1β, IL-31, and sCD40L levels were significantly higher in GI cancer patients than in the controls, supporting the abovementioned findings [66–68].
The bisecting GlcNAc of IgG regulates ADCC by causing an increase in affinity to FcRIIIa, leading to the pro-inflammatory function of IgG [47,69]. This disruption in the balance of inflammation progression is considered to play an important role in the development of carcinomas [62,70]. In the present study, we observed an increase in bisecting GlcNAc among EC, GC, CRC, and PC patients, which was consistent with analogous findings in previous reports [7,50,54,57]. An in vitro experiment showed that a decrease in bisecting GlcNAc was associated with increasing levels of IL-21 [71]. However, no IL-21 values were detected in the serum of our study participants.
Although ADCC is a crucial pathway against tumors, the upregulation of ADCC induced by abnormal IgG N-glycans has not been demonstrated to be associated with more accurate diagnosis. Studies have reported that decreased galactosylation, decreased sialylation, and increased bisecting GlcNAc in IgG N-glycans are associated with poorer prognosis among CRC patients [51].
Massive quantities of serum biomarkers have been investigated to monitor the clinical progression of cancer or to define treatment regimens. Although some of these tumor biomarkers play an important role in disease management, they are of limited use as diagnostic tools due to insufficient Sp or Se. At present, the noninvasive IgG N-glycan assay provides a high level of accuracy in the diagnosis of inflammatory and immune diseases [72]. The combination of the HILIC analysis of fluorescently tagged N-glycans with UPLC analysis has been demonstrated to be a valuable approach [27]. In the current study, the high-throughput analysis of IgG N-glycosylation presented significantly high AUC values of 0.972, 0.871, 0.867, and 0.907 for distinguishing EC, GC, CRC, and PC, respectively. Consistent with findings in prostate cancer, lung cancer, and bladder cancer [73–75], the present findings demonstrate the potential of IgG N-glycosylation for the early diagnosis of GI cancers.
This study has several limitations that should be interpreted. First, the case-control study design limited the inference of the causal effect between IgG N-glycosylation and diseases. Second, even though glycosylation can have major etiological effects in cancers, environmental and lifestyle factors were not measured in this study, although they play important roles in the development of cancers.
In conclusion, our findings indicate that decreases in IgG sialylation and galactosylation, together with an increase in bisecting GlcNAc, might play important roles in the carcinogenesis and progression of GI cancers. Serological IgG N-glycosylation may serve as a potential candidate for noninvasively assisting the clinical diagnosis of GI cancer subtypes. To the best of our knowledge, this is the first report on integrative comparisons of IgG N-glycosylation profiles in EC, GC, CRC, and PC patients; it offers opportunities for the identification of new diagnostic biomarkers for GI cancers.
《Acknowledgments》
Acknowledgments
This work was supported by the Shandong Provincial Natural Science Foundation (ZR2022MH082) and the National Natural Science Foundation of China (81872682). We thank Professor Youxin Wang at Capital Medical University for his helpful suggestions on this work.
《Compliance with ethics guidelines》
Compliance with ethics guidelines
Pengcheng Liu, Xiaobing Wang, Aishe Dun, Yutong Li, Houqiang Li, Lu Wang, Yichun Zhang, Cancan Li, Jinxia Zhang, Xiaoyu Zhang, Lixing Ma, and Haifeng Hou declare that they have no conflicts of interest or financial conflicts to disclose.
《Appendix A. Supplementary data》
Appendix A. Supplementary data
Supplementary data to this article can be found online at https://doi.org/10.1016/j.eng.2023.02.008.


 京公网安备 11010502051620号


