2022, Volume 19, Issue 12
Engineering >> 2022, Volume 19, Issue 12 doi: 10.1016/j.eng.2021.02.019
Ground-based Hyperspectral Stereoscopic Remote Sensing Network: A Promising Strategy to Learn Coordinated Control of O3 and PM2.5 over China
a Department of Precision Machinery and Precision Instrumentation, University of Science and Technology of China, Hefei 230026, China
b Center for Excellence in Regional Atmospheric Environment, Institute of Urban Environment, Chinese Academy of Sciences, Xiamen 361021, China
c Key Lab of Environmental Optics & Technology, Anhui Institute of Optics and Fine Mechanics, Hefei Institutes of Physical Science, Chinese Academy of Sciences, Hefei 230031, China
d Key Laboratory of Precision Scientific Instrumentation of Anhui Higher Education Institutes, University of Science and Technology of China, Hefei 230026, China
e Anhui Province Key Laboratory of Polar Environment and Global Change, University of Science and Technology of China, Hefei 230026, China
f School of Earth and Space Sciences, University of Science and Technology of China, Hefei 230026, China
g School of Environmental Science and Optoelectronic Technology, University of Science and Technology of China, Hefei 230026, China
h Institute of Physical Science and Information Technology, Anhui University, Hefei 230601, China
i School of Environment and Civil Engineering, Jiangnan University, Wuxi 214122, China
Next Previous
Abstract
With the coming of the “14th Five-Year Plan”, the coordinated control of particulate matter with an aerodynamic diameter no greater than 2.5 μm (PM2.5) and O3 has become a major issue of air pollution prevention and control in China. The stereoscopic monitoring of regional PM2.5 and O3 and their precursors is crucial to achieve coordinated control. However, current monitoring networks are currently inadequate for monitoring the vertical profiles of both PM2.5 and O3 simultaneously and support air quality control. The University of Science and Technology of China (USTC) has established a nationwide ground-based hyperspectral stereoscopic remote sensing network based on multi-axis differential optical absorption spectroscopy (MAX-DOAS) since 2015. This monitoring network provides a significant opportunity for the regional coordinated control of PM2.5 and O3 in China. One-year vertical profiles of aerosol, NO2 and HCHO monitored from four MAX-DOAS stations installed in four megacities (Beijing, Shanghai, Shenzhen, and Chongqing) were used to characterize their vertical distribution differences in four key regions, Jing–Jin–Ji (JJJ), Yangtze River Delta (YRD), Pearl River Delta (PRD), and Sichuan Basin (SB), respectively. The normalized and yearly averaged aerosol vertical profiles below 400 m in JJJ and PRD exhibit a box shape and a Gaussian shape, respectively, and both show exponential shapes in YRD and SB. The NO2 vertical profiles in four regions all exhibit exponential shapes because of vehicle emissions. The shape of the HCHO vertical profile in JJJ and PRD was Gaussian, whereas an exponential shape was shown in YRD and SB. Moreover, a regional transport event occurred at an altitude of 600–1000 m was monitored in the southwest–northeast pathway of the North China Plain (NCP) by five MAX-DOAS stations (Shijiazhuang (SJZ), Wangdu (WD), Nancheng (NC), Chinese Academy of Meteorological Sciences (CAMS), and University of Chinese Academy of Sciences (UCAS)) belonging to the above network. The aerosol optical depths (AOD) in these five stations decreased in the order of SJZ > WD > NC > CAMS > UCAS. The short-distance regional transport of NO2 in the 700–900 m layer was monitored between WD and NC. As an important precursor of secondary aerosol, the peak of NO2 air mass in WD and NC all occurred 1 h earlier than that of aerosol. This was also observed for the short-distance regional transport of HCHO in the 700–900 m layer between NC and CAMS, which potentially affected the O3 concentration in Beijing. Finally, CAMS was selected as a typical site to determine the O3–NOx–volatile organic compounds (VOCs) sensitivities in vertical space. We found the production of O3 changed from predominantly VOCs-limited conditions to mainly mixed VOCs–NOx-limited condition from the 0–100 m layer to the 200–300 m layer. In addition, the downward transport of O3 could contribute to the increase of ground surface O3 concentration. This ground-based hyperspectral stereoscopic remote sensing network provide a promising strategy to support management of PM2.5 and O3 and their precursors and conduct attribution of sources.
Keywords
MAX-DOAS ; Stereoscopic monitoring ; Regional transport ; Ozone production ; Control strategy
Figures

Fig. 1

Fig. 2
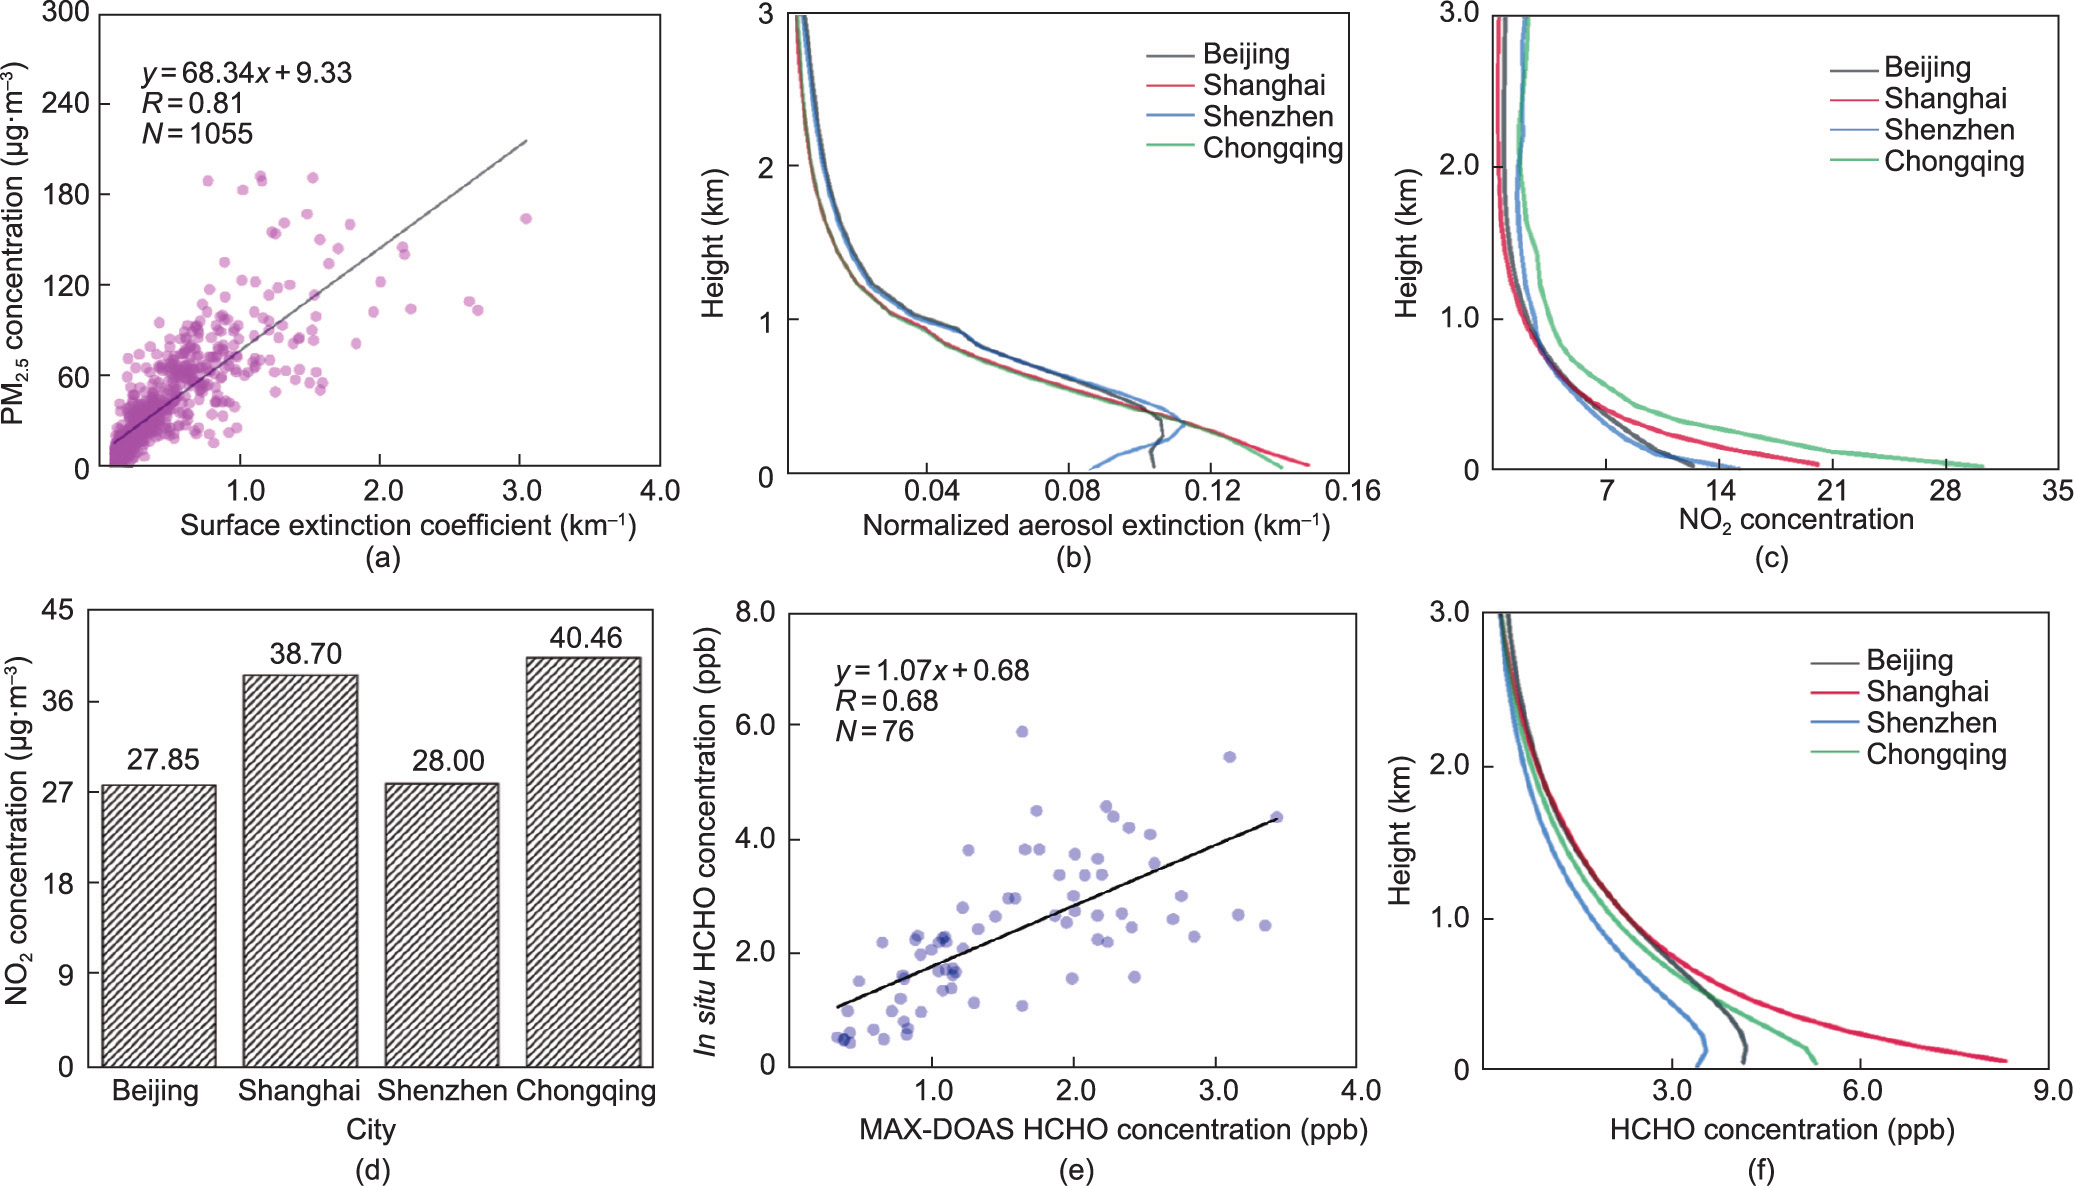
Fig. 3

Fig. 4
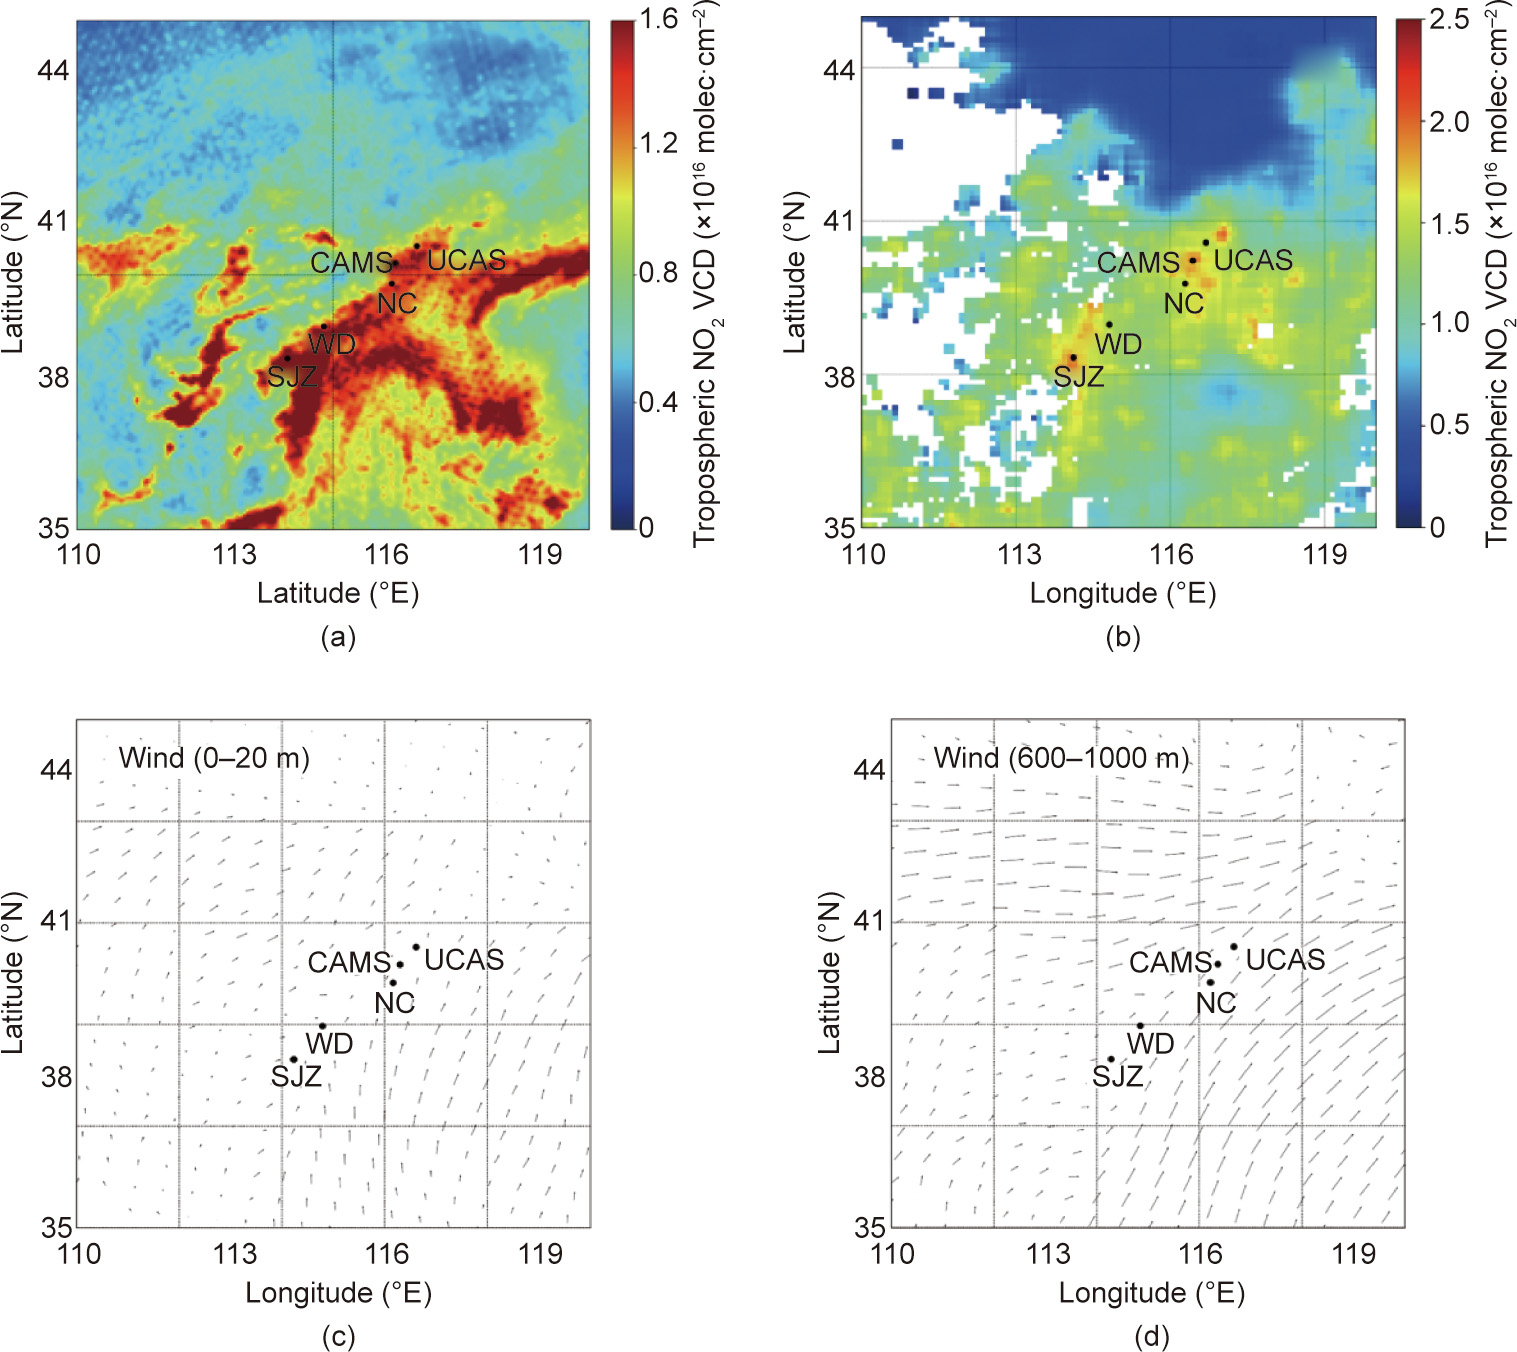
Fig. 5
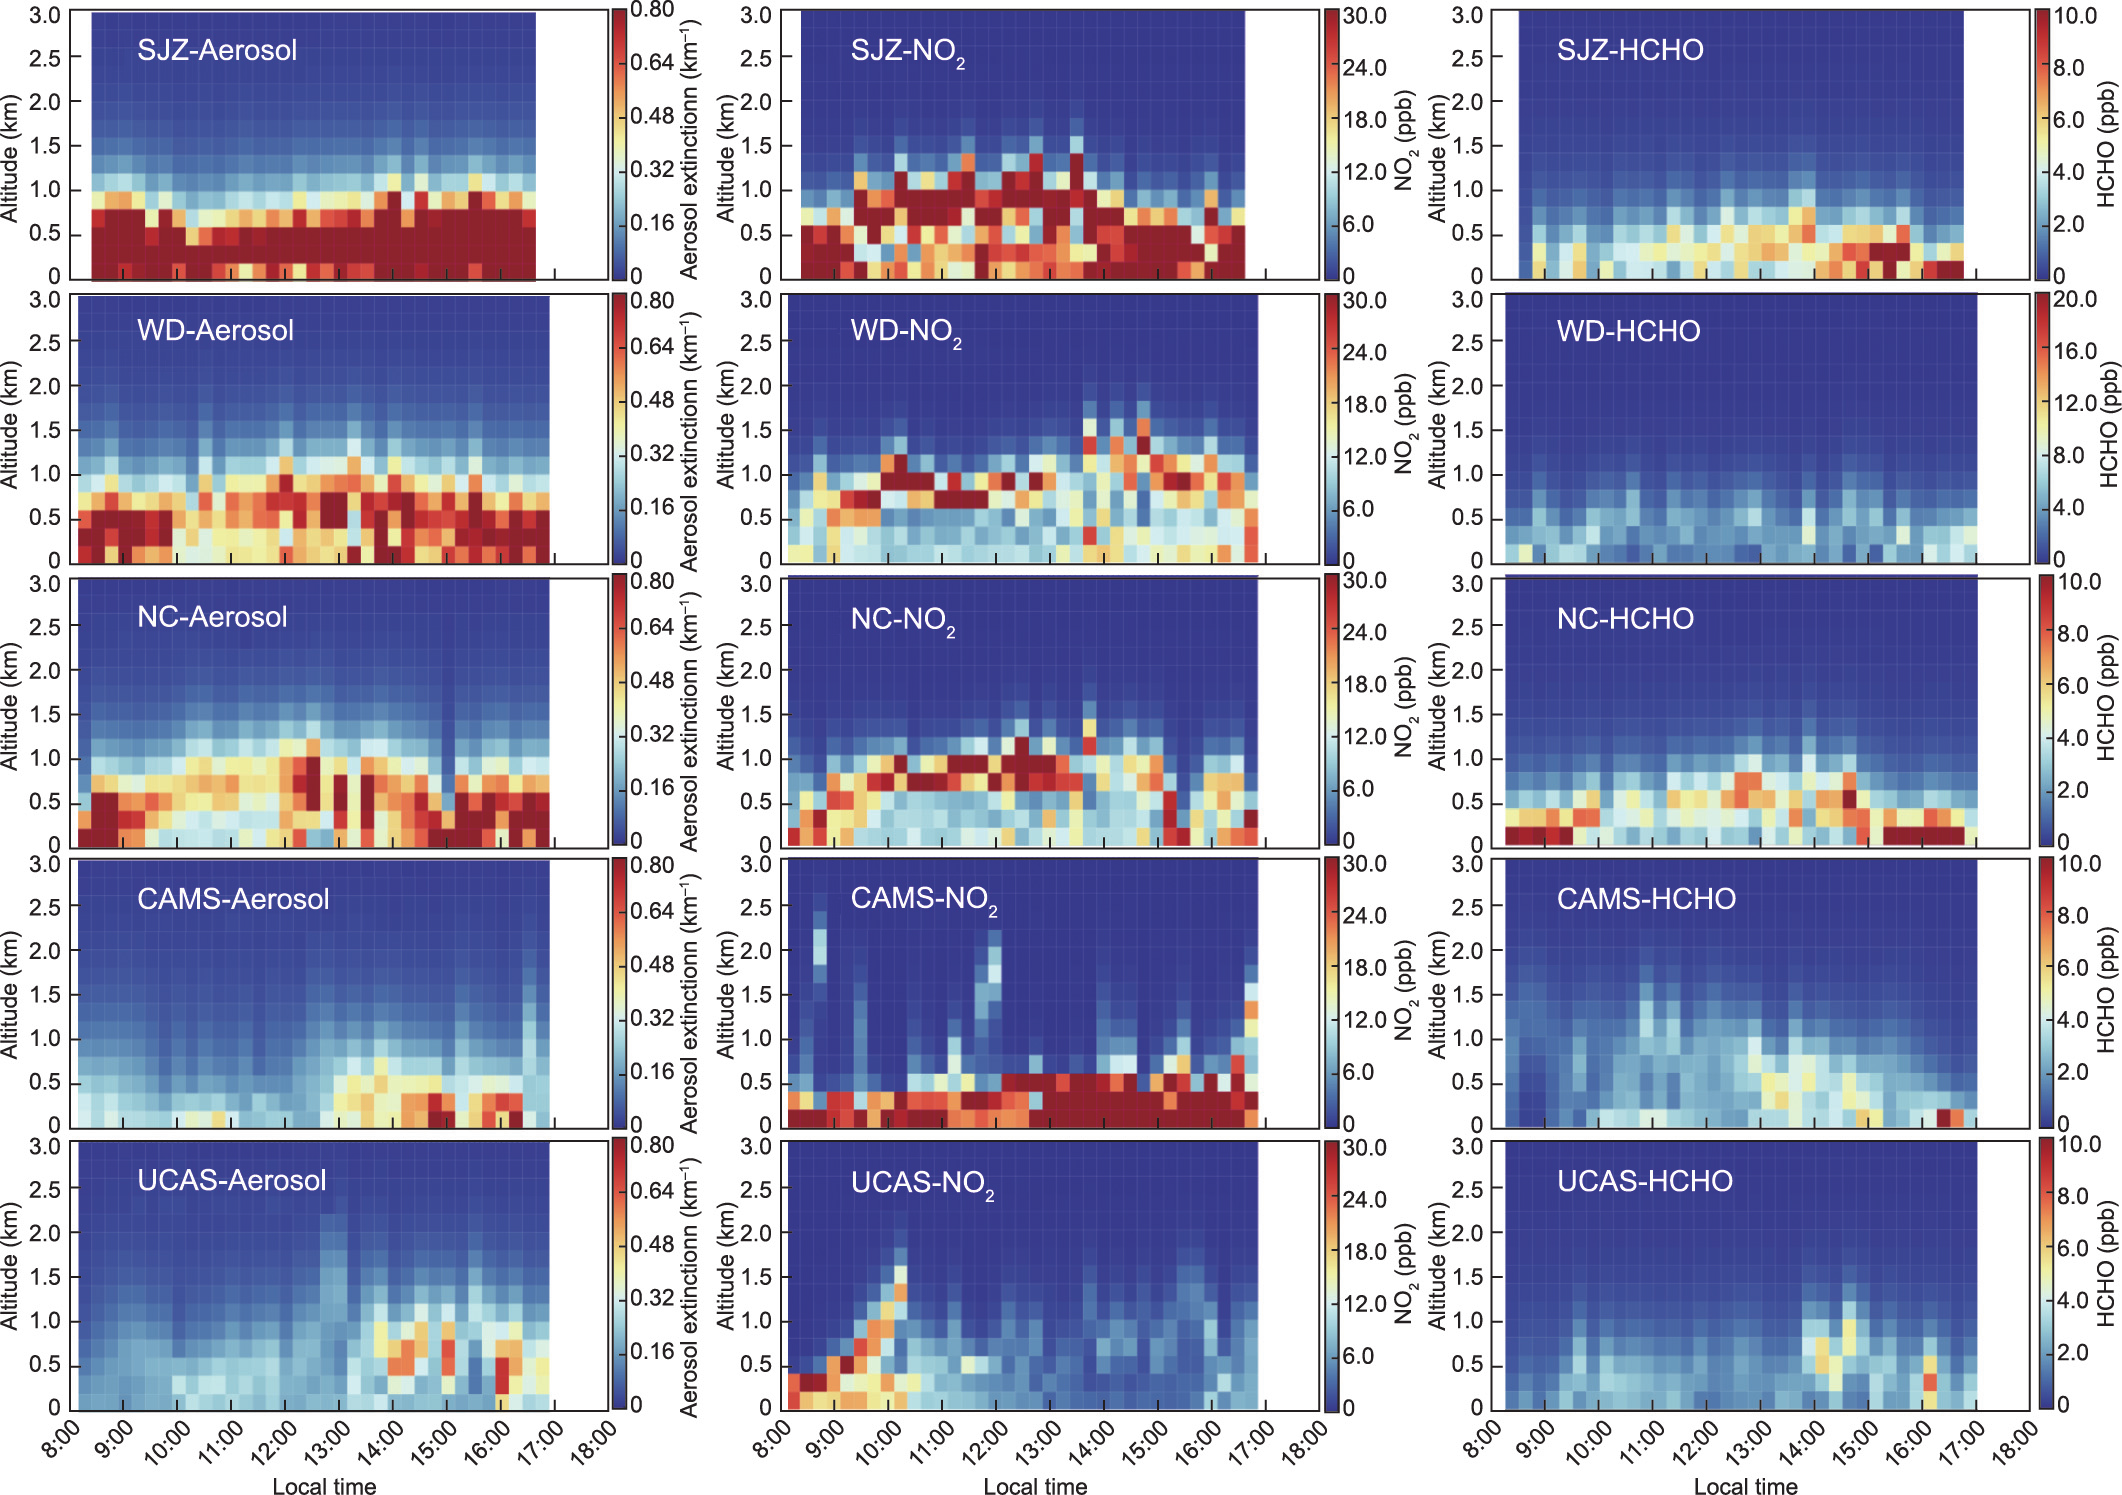
Fig. 6

Fig. 7

Fig. 8
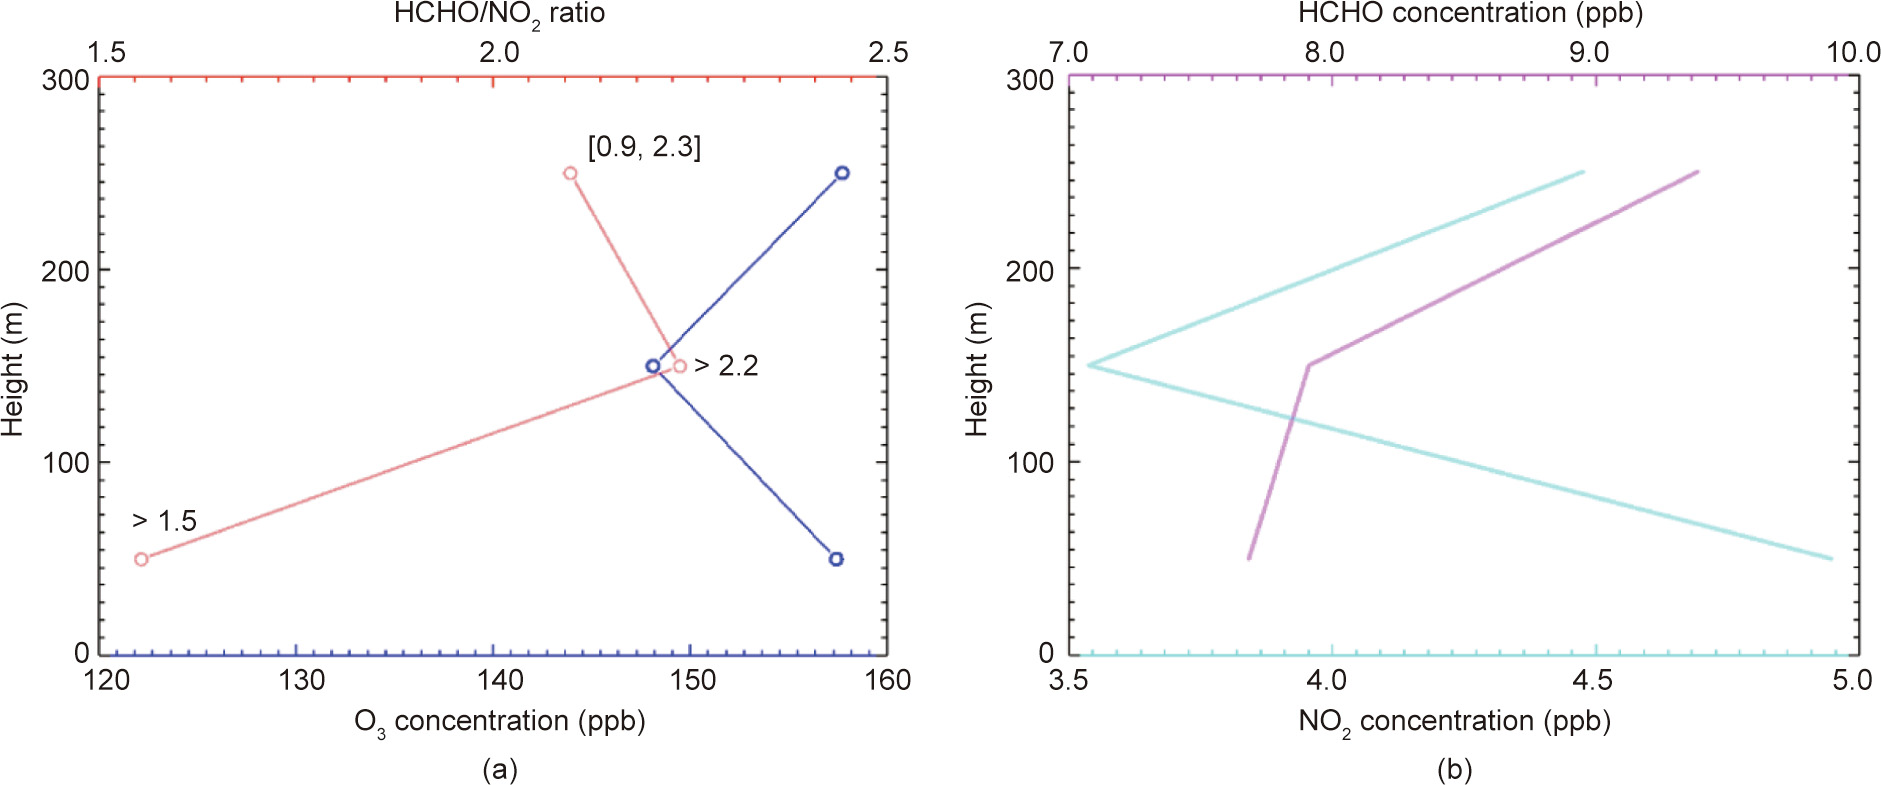
Fig. 9
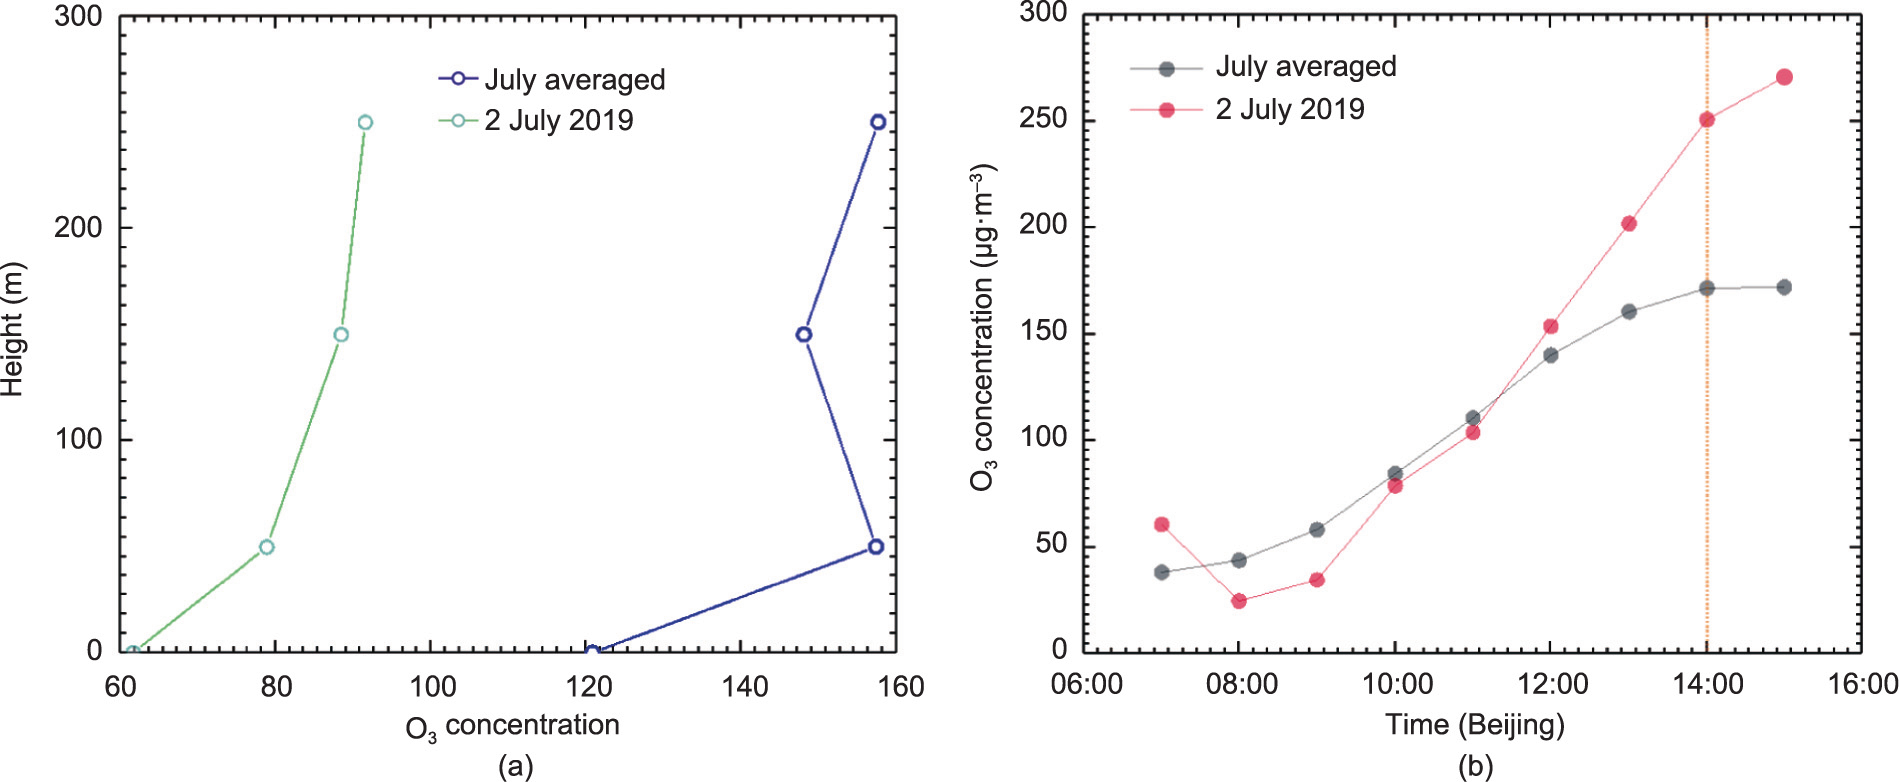
Fig. 10
References
[ 1 ] Feng Y, Ning M, Lei Yu, Sun Y, Liu W, Wang J. Defending blue sky in China: effectiveness of the ‘‘Air Pollution Prevention and Control Action Plan” on air quality improvements from 2013 to 2017. J Environ Manage 2019;252:109603. link1
[ 2 ] Maji KJ, Li VOK, Lam JCK. Effects of China’s current Air Pollution Prevention and Control Action Plan on air pollution patterns, health risks and mortalities in Beijing 2014–2018. Chemosphere 2020;260:127572. link1
[ 3 ] Jiang X, Li G, Fu W. Government environmental governance, structural adjustment and air quality: a quasi-natural experiment based on the ThreeYear Action Plan to Win the Blue Sky Defense War. J Environ Manage 2021;277:111470. link1
[ 4 ] Fan H, Zhao C, Yang Y. A comprehensive analysis of the spatio–temporal variation of urban air pollution in China during 2014–2018. Atmos Envion 2020;220:117066. link1
[ 5 ] Zhang K, Zhao C, Fan H, Yang Y, Sun Y. Toward understanding the differences of PM2.5 characteristics among five China urban cities. Asia–Pac J Atmos Sci 2020;56:493–502. link1
[ 6 ] Gao C, Xiu A, Zhang X, Chen W, Liu Y, Zhao H, et al. Spatiotemporal characteristics of ozone pollution and policy implications in northeast China. Atmos Pollut Res 2020;11(2):357–69. link1
[ 7 ] Jin X, Fiore A, Boersma KF, Smedt ID, Valin L. Inferring changes in summertime surface ozone–NOx–VOC Chemistry over US urban areas from two decades of satellite and ground-based observations. Environ Sci Technol 2020;54(11): 6518–29. link1
[ 8 ] Tadic I, Crowley JN, Dienhart D, Eger P, Harder H, Hottmann B, et al. Net ozone production and its relationship to nitrogen oxides and volatile organic compounds in the marine boundary layer around the Arabian Peninsula. Atmos Chem Phys 2020;20(11):6769–87. link1
[ 9 ] Kong L, Tang X, Zhu J, Wang Z, Li J, Wu H, et al. A six-year long (2013–2018) high-resolution air quality reanalysis dataset over China base on the assimilation of surface observations from CNEMC. Earth Syst Sci Data 2021;13:529–70. link1
[10] Zheng C, Zhao C, Li Y, Wu X, Zhang K, Gao J, et al. Spatial and temporal distribution of NO2 and SO2 in Inner Mongolia urban agglomeration obtained from satellite remote sensing and ground observations. Atmos Environ 2018;188:50–9. link1
[11] Su W, Liu C, Chan KL, Hu Q, Liu H, Ji X, et al. A improved TROPOMI tropospheric HCHO retrieval over China. Atmos Meas Tech 2020;13(11):6271–92. link1
[12] Liu X, Bhartia PK, Chance K, Froidevaux L, Spurr RJD, Kurosu TP. Validation of Ozone Monitoring Instrument (OMI) ozone profiles and stratospheric ozone columns with Microwave Limb Sounder (MLS) measurements. Atmos Chem Phys 2010;10(5):2539–49. link1
[13] Zhang K, Zhou L, Fu Q, Yan L, Bian Q, Wang D, et al. Vertical distribution of ozone over Shanghai during late spring: a balloon borne observation. Atmos Environ 2019;208:48–60. link1
[14] Li XB, Peng ZR, Lu QC, Wang D, Hu XM, Wang D, et al. Evaluation of unmanned aerial system in measuring lower tropospheric ozone and fine aerosol particles using portable monitors. Atmos Environ 2020;222:117134. link1
[15] Xing C, Liu C, Wang S, Chan KL, Gao Y, Huang X, et al. Observations of the vertical distributions of summertime atmospheric pollutants and the corresponding ozone production in Shanghai, China. Atmos Chem Phys 2017;17(23):14275–89. link1
[16] Richter A, Adukpo D, Fietkau S, Heckel A, Ladstätter-Weißenmayer A, Löwe A, et al. SCIAMACHY validation using ground-based DOAS measurements of the university of Bremen BREDOM network. In: Proceedings of the ENVISAT Validation Workshop; 2002 Dec 9–13; Frascati, Italy. Frascati: ESRIN; 2002. link1
[17] Clémer K, Van Roozendael M, Fayt C, Hendrick F, Hermans C, Pinardi G, et al. Multiple wavelength retrieval of tropospheric aerosol optical properties from MAX-DOAS measurements in Beijing. Atmos Meas Tech 2010;3(4):863–78. link1
[18] Kanaya Y, Irie H, Takashima H, Iwabuchi H, Akimoto H, Sudo K, et al. Long-term MAX-DOAS network observations of NO2 in Russia and Asia (MADRAS) during the period 2007–2012: instrumentation, elucidation of climatology, and comparisons with OMI satellite observations and global model simulations. Atmos Chem Phys 2014;14:7909–27. link1
[19] Galle B, Johansson M, Rivera C, Zhang Y, Kihlman M, Kern C, et al. Network for observation of volcanic and atmospheric change (NOVAC)—a global network for volcanic gas monitoring: network layout and instrument description. J Geophys Res 2010;115(D5):D05304. link1
[20] Xing C, Liu C, Wang S, Hu Q, Liu H, Tan W, et al. A new method to determine the aerosol optical properties from multiple-wavelength O4 absorptions by MAX-DOAS observation. Atmos Meas Tech 2019;12(6):3289–302. link1
[21] Xing C, Liu C, Hu Q, Fu Q, Lin H, Wang S, et al. Identifying the wintertime sources of volatile organic compounds (VOCs) from MAX-DOAS measured formaldehyde and glyoxal in Chongqing, southwest China. Sci Total Environ 2020;715:136258. link1
[22] Wang T, Hendrick F, Wang P, Tang G, Clémer K, Yu H, et al. Evaluation of tropospheric SO2 retrieved from MAX-DOAS measurements in Xianghe, China. Atmos Chem Phys 2014;14(20):11149–64. link1
[23] Wagner T, Beirle S, Brauers T, Deutschmann T, Frieß U, Hak C, et al. Inversion of tropospheric profiles of aerosol extinction and HCHO and NO2 mixing ratios from MAX-DOAS observations in Milano during the summer of 2003 and comparison with independent data sets. Atmos Meas Tech 2011;4(12): 2685–715. link1
[24] Roscoe HK, Van Roozendael M, Fayt C, du Piesanie A, Abuhassan N, Adams C, et al. Intercomparison of slant column measurements of NO2 and O4 by MAX-DOAS and zenith-sky UV and visible spectrometers. Atmos Meas Tech 2010;3(6): 1629–46. link1
[25] Karin K, Van Roozendael M, Francois H, Arnoud A, Ermioni D, Frieß U, et al. Intercomparison of NO2, O4, O3 and HCHO slant column measurements by MAX-DOAS and zenith-sky UV–visible spectrometers during the CINDI-2 campaign. Atmos Meas Tech Disc 2019;157:1–58. link1
[26] Vandaele AC, Hermans C, Simon PC, Carleer M, Colin R, Fally S, et al. Measurements of the NO2 absorption cross-section from 42 000 cm-1 to 10 000 cm-1 (238–1000 nm) at 220 K and 294 K. J Quant Spectrosc Ra 1998;59(3–5): 171–84. link1
[27] Meller R, Moortgat GK. Temperature dependence of the absorption cross sections of formaldehyde between 223 and 323 K in the wavelength range 225–375 nm. J Geophys Res 2000;105(D6):7089–101. link1
[28] Serdyuchenko A, Gorshelev V, Weber M, Chehade W, Burrows JP. High spectral resolution ozone absorption cross-sections—part 2: temperature dependence. Atmos Meas Tech 2014;7(2):625–36. link1
[29] Thalman R, Volkamer R. Temperature dependent absorption cross-sections of O2–O2 collision pairs between 340 and 630 nm and at atmospherically relevant pressure. Phys Chem Chem Phys 2013;15(37):15371–81. link1
[30] Fleischmann OC, Hartmann M, Burrows JP, Orphal J. New ultraviolet absorption cross-sections of BrO at atmospheric temperatures measured by time-windowing Fourier transform spectroscopy. J Photoch Photobio A 2004;168(1–2):117–32. link1
[31] Rothman LS, Gordon IE, Barber RJ, Dothe H, Gamache RR, Goldman A, et al. HITEMP, the high-temperature molecular spectroscopic database. J Quant Spectrosc Ra 2010;111(15):2139–50. link1
[32] Chance KV, Spurr RJD. Ring effect studies: rayleigh scattering, including molecular parameters for rotational Raman scattering, and the Fraunhofer spectrum. Appl Opt 1997;36(21):5224–30. link1
[33] Chance K, Kurucz RL. An improved high-resolution solar reference spectrum for earth’s atmosphere measurements in the ultraviolet, visible, and near infrared. J Quant Spectrosc Ra 2010;111(9):1289–95. link1
[34] Aliwell S, Van Roozendael M, Johnston P, Richter A, Wagner T, Arlander D, et al. Analysis for BrO in zenith-sky spectra: an intercomparison exercise for analysis improvement. J Geophys Res 2002;107(D14):4199. link1
[35] Wagner T, Beirle S, Remmers J, Shaiganfar R, Wang Y. Absolute calibration of the colour index and O4 absorption derived from Multi Axis (MAX-) DOAS measurements and their application to a standardised cloud classification algorithm. Atmos Meas Tech 2016;9(9):4803–23. link1
[36] Rodgers CD. Inverse methods for atmospheric sounding: theory and practice. Singapore–New Jersey–London–Hong Kong: World Scientific Publishing; 2000. link1
[37] Spurr RJD. VLIDORT: a linearized pseudo-spherical vector discrete ordinate radiative transfer code for forward model and retrieval studies in multilayer multiple scattering media. J Quant Spectrosc RA 2006;102(2):316–42. link1
[38] Frieß U, Monks PS, Remedios JJ, Rozanov A, Sinreich R, Wagner T, et al. MAXDOAS O4 measurements: a new technique to derive information on atmospheric aerosols: 2. modeling studies. J Geophys Res 2006;111(D14):D14203. link1
[39] Grell GA, Peckham SE, Schmitz R, McKeen SA, Frost G, Skamarock WC, et al. Fully coupled ‘‘online” chemistry within the WRF model. Atmos Environ 2005;39(37):6957–75. link1
[40] Xin J, Wang Y, Pan Y, Ji D, Liu Z, Wen T, et al. The campaign on atmospheric aerosol research network of China: CARE-China. Bull Am Meteorol Soc 2015;96 (7):1137–55.
[41] Dao X, Lin Y, Cao F, Di S, Hong Y, Xing G, et al. Introduction to the national aerosol chemical composition monitoring network of China: objectives, current status, and outlook. Bull Am Meteorol Soc 2019;100 (12):ES337–51.
[42] Lv L, Liu W, Zhang T, Chen Z, Dong Y, Fan G, et al. Observations of particle extinction, PM2.5 mass concentration profile and flux in north China based on mobile lidar technique. Atmos Environ 2017;164:360–9. link1
[43] Zhang Q, Ma X, Tie X, Huang M, Zhao C. Vertical distributions of aerosols under different weather conditions: analysis of in-situ aircraft measurements in Beijing, China. Atmos Environ 2009;43(34):5526–35. link1
[44] Liu P, Zhao C, Liu P, Deng Z, Huang M, Ma X, et al. Aircraft study of aerosol vertical distributions over Beijing and their optical properties. Tellus B Chem Phys Meteorol 2009;61(5):756–67. link1
[45] Liu Q, He Q, Fang S, Guang Y, Ma C, Chen Y, et al. Vertical distribution of ambient aerosol extinctive properties during haze and haze-free periods based on the micro-pulse lidar observation in Shanghai. Sci Total Environ 2017;574:1502–11. link1
[46] Ning G, Wang S, Ma M, Ni C, Shang Z, Wang J, et al. Characteristics of air pollution in different zones of Sichuan Basin, China. Sci Total Environ 2018;612:975–84. link1
[47] Liu C, He L, Pi D, Zhao J, Lin L, He P, et al. Integrating LIDAR data and fourdimensional flux method to analyzing the transmission of PM2.5 in Shenzhen. Phys Chem Earth 2019;110:81–8. link1
[48] Zhao C, Wang Y, Shi X, Zhang D, Wang C, Jiang JH, et al. Estimating the contribution of local primary emissions to particulate pollution using highdensity station observations. JGR Atmos 2019;124(3):1648–61. link1
[49] Vlemmix T, Hendrick F, Pinardi G, De Smedt I, Fayt C, Hermans C, et al. MAXDOAS observations of aerosols, formaldehyde and nitrogen dioxide in the Beijing area: comparison of two profile retrieval approaches. Atmos Meas Tech 2015;8(2):941–63. link1
[50] Chan KL, Wiegner M, Wenig M, Pöhler D. Observations of tropospheric aerosols and NO2 in Hong Kong over 5 years using ground based MAX-DOAS. Sci Total Environ 2018;619-620:1545–56. link1
[51] Li L, Lu C, Chan P, Zhang X, Yang H, Lan Z, et al. Tower observed vertical distribution of PM2.5, O3 and NOx in the Pearl River Delta. Atmos Environ 2020;220:117083.
[52] Wang QW, Tan ZM. Multi-scale topographic control of southwest vortex formation in Tibetan Plateau region in an idealized simulation. J Geophys Res Atmos 2014;119(20):11543–61. link1
[53] Yu S, Gao W, Xiao D, Peng J. Observational facts regarding the joint activities of the southwest vortex and plateau vortex after its departure from the Tibetan Plateau. Adv Atmos Sci 2016;33(1):34–46. link1
[54] Lee H, Ryu J, Irie H, Jang SH, Park J, Choi W, et al. Investigations of the diurnal variation of vertical HCHO profiles based on MAX-DOAS measurements in Beijing: comparisons with OMI vertical column data. Atmosphere 2015;6(11): 1816–32. link1
[55] Wang Y, Dörner S, Donner S, Böhnke S, De Smedt I, Dickerson RR, et al. Vertical profiles of NO2, SO2, HONO, HCHO, CHOCHO and aerosols derived from MAXDOAS measurements at a rural site in the central western North China Plain and their relation to emission sources and effects of regional transport. Atmos Chem Phys 2019;19(8):5417–49. link1
[56] Wang Y, Lampel J, Xie P, Beirle S, Li A, Wu D, et al. Ground-based MAX-DOAS observations of tropospheric aerosols, NO2, SO2 and HCHO in Wuxi, China, from 2011 to 2014. Atmos Chem Phys 2017;17(3):2189–215. link1
[57] Luo Y, Dou Ke, Fan G, Huang S, Si F, Zhou H, et al. Vertical distributions of tropospheric formaldehyde, nitrogen dioxide, ozone and aerosol in southern China by ground-based MAX-DOAS and LIDAR measurements during PRIDEGBA 2018 campaign. Atmos Environ 2020;226:117384. link1
[58] Streets DG, Fu JS, Jang CJ, Hao J, He K, Tang X, et al. Air quality during the 2008 Beijing Olympic Games. Atmos Environ 2007;41(3):480–92. link1
[59] Wu J, Li G, Cao J, Bei N, Wang Y, Feng T, et al. Contributions of trans-boundary transport to summertime air quality in Beijing. China. Atmos Chem Phys 2017;17(3):2035–51. link1
[60] Ge B, Wang Z, Lin W, Xu X, Li J, Ji D, et al. Air pollution over the North China Plain and its implication of regional transport: a new sight from the observed evidences. Environ Pollut 2018;234:29–38. link1
[61] Ge BZ, Xu XB, Lin WL, Li J, Wang ZF. Impact of the regional transport of urban Beijing pollutants on downwind areas in summer: ozone production efficiency analysis. Tellus B Chem Phys Meteorol 2012;64(1):17348. link1
[62] Zhao C, Wang Y, Zeng T. East China plains: a ‘‘basin” of ozone pollution. Environ Sci Technol 2009;43(6):1911–5. link1
[63] Zhu S, Li X, Yu C, Wang H, Wang Y, Miao J. Spatiotemporal variations in satellite-based formaldehyde (HCHO) in the Beijing–Tianjin–Hebei region in China from 2005 to 2015. Atmosphere 2018;9(1):5. link1
[64] Liu Y, Song M, Liu X, Zhang Y, Hui L, Kong L, et al. Characterization and sources of volatile organic compounds (VOCs) and their related changes during ozone pollution days in 2016 in Beijing. China. Environ Pollut 2020;257:113599. link1
[65] Platt U, Stutz J. Differential optical absorption spectroscopy. Berlin: Springer; 2008. p. 229–375. link1
[66] Altshuller AP. Production of aldehydes as primary emissions and from secondary atmospheric reactions of alkenes and alkanes during the night and early morning hours. Atmos Environ 1993;27(1):21–32. link1
[67] Seinfeld JH, Pandis SN. Atmospheric chemistry and physics: from air pollution to climate change. Hoboken: John Wiley & Sons; 2012. link1
[68] Schroeder JR, Crawford JH, Fried A, Walega J, Weinheimer A, Wisthaler A, et al. New insights into the column CH2O/NO2 ratio as an indicator of near-surface ozone sensitivity. J Geophys Res Atmos 2017;122(16):8885–907. link1
[69] Geng F, Tie X, Xu J, Zhou G, Peng Li, Gao W, et al. Characterizations of ozone, NOx, and VOCs measured in Shanghai, China. Atmos Environ 2008;42(29):6873–83. link1
[70] Liu H, Liu C, Xie Z, Li Y, Huang X, Wang S, et al. A paradox for air pollution controlling in China revealed by ‘‘APEC Blue” and ‘‘Parade Blue”. Sci Rep 2016;6(1):34408. link1
[71] Su W, Liu C, Hu Q, Fan G, Xie Z, Huang X, et al. Characterization of ozone in the lower troposphere during the 2016 G20 conference in Hangzhou. Sci Rep 2016;7(1):1–11. link1


 京公网安备 11010502051620号


