
《1. Introduction》
1. Introduction
Following rapid economic development, air pollution has become a serious threat in China. To tackle the major challenge of improving air quality, the Chinese government has successively disseminated the ‘‘Action Plan for Air Pollution Prevention and Control” (the so-called national ‘‘Ten Measures of Air”) and ‘‘Three-Year Action Plan to Win the Blue Sky Defense War” (the ‘‘Blue Sky Defense War”) since 2013 [1–3]. Following these continuous efforts on emission control and restriction, SO2 and PM2.5 emissions have been considerably decreased by 70% and 46%, respectively, from 2013 to 2019. Although major pollutants such as PM2.5 have reduced substantially, O3 concentrations have maintained an upward trend in recent years [4,5]. The 90th percentile of the daily averaged maximum eight-hour O3 concentration in 337 main cities of China increased 20.3% from 2013 to 2019. Tropospheric O3 is produced by emissions of nitrogen oxides (NOx = NO + NO2) and volatile organic compounds (VOCs) and their photolysis [6–8]. The emission reduction of NOx and VOCs was only 26% and 2%, respectively, from 2013 to 2019. In short, China is facing a complex air pollution problem with high PM2.5 and O3 concentrations that developed countries have not experienced. Therefore, it is urgent to carry out stereoscopic monitoring of PM2.5, O3, and their precursors and promote the coordinated control of PM2.5 and O3 compound pollution.
In addition to local emission and secondary formation of air pollutants, regional transport is also a driving force of air pollution that cannot be ignored. Currently, the main technological means being used to study air pollution include in situ observation, satellite observation, model simulation, and ground-based remote sensing observations. Since 2012, the Chinese government has successively established a nationwide ground-based air quality monitoring network—China National Environmental Monitoring Center (CNEMC) with 1497 stations to monitor surface concentrations of SO2, NO2, CO, PM10, PM2.5, and O3, providing a basis for air quality evaluation and related scientific research [9]. Satellite observations can monitor the horizontal distribution of the vertical column densities (VCDs) of aerosol, NO2, HCHO, and O3 at a large scale; however, their temporal and spatial resolution is limited and most of the environmental remote sensing monitoring satellites only overpass the target area once a day, with a maximum spatial resolution of only (3.5 × 7) km2 [10–12]. In addition, both CNEMC and satellite technology cannot monitor the vertical futures of atmospheric composition. Moreover, the chemical transport model is an important means to assist atmospheric environmental monitoring, forecasting and research on atmospheric pollution mechanisms; however, inadequate modelling of air pollutants in the vertical has been recognized as an important deficiency. Many important processes that determine formation, conversion, and transport of air pollutants occur above the surface, often in distinct vertical layers between 0 and 2 km above the surface. To compensate for the lack of vertical technology, multiple research units have carried out vertical observations of atmospheric composition using aircraft, unmanned aerial system (UAS), and light detection and ranging (LiDAR) technologies [13– 15]. However, LiDAR only can monitor aerosol and O3 vertical profiles and has a monitoring overlap height. Aircraft and UAS consume considerable labor and material resources and cannot achieve continuous monitoring.
The ground-based hyperspectral stereoscopic remote sensing network is composed of multiple stations. Multi-axis differential optical absorption spectroscopy (MAX-DOAS) provides a promising strategy to learn coordinated control of O3 and PM2.5. It can provide vertical distribution data for PM2.5, O3, and their precursors and help to advance diagnostic understanding and prediction of air pollution. To date, several MAX-DOAS networks have been reported around the world. The University of Bremen, Germany established the Bremian DOAS network for atmospheric measurements (BREDOM) network, including 15 stations distributed throughout Europe and Africa [16]. The Royal Belgian Institute for Space Aeronomy (BIRA-IASB) set up an MAX-DOAS network, including six stations around the world [17]. The Japan Agency for Marine– Earth Science and Technology (JAMSTEC) and European Union established the MAX-DOAS network over Russia and Asia (MADRAS) with seven stations and Network for Observation of Volcanic and Atmospheric Change (NOVAC) with 15 stations [18,19]. A ground-based hyperspectral stereoscopic remote sensing network based on MAX-DOAS with 34 stations coving seven regions of China (north China, east China, south China, southwest China, northwest China, northeast China, and central China) was established by the University of Science and Technology of China (USTC) in 2015. The major purpose of this network is to realize a long-term, continuous, and stereoscopic monitoring of the stereoscopic distribution of atmospheric composition over China. It can make up for the lack of vertical observation capabilities of in situ stations and meet the actual needs of precise location of air pollution sources, quantification of regional transmission, and evaluation of the relative contribution of meteorology and emissions to guide air quality management.
In this study, we used one-year observation data of four megacities (Beijing, Shanghai, Shenzhen, and Chongqing) to determine the regional differences of vertical distribution of aerosol, NO2 and HCHO in Jing–Jin–Ji (JJJ) area, Yangtze River Delta (YRD) area, Pearl River Delta (PRD) area, and Sichuan Basin (SB) area based on above network. A typical transport process with a southwest– northeast pathway over the North China Plain (NCP) was analyzed to reveal the impact of regional transport on air pollution in Beijing. Moreover, O3–NOx–VOCs sensitivities in the vertical direction at a one-year time scale in Beijing were determined based on the above network. The development of this ground-based hyperspectral stereoscopic remote sensing network is helpful to promote coordinated control of O3 and PM2.5 over China in the ‘‘14th FiveYear Plan” and boost our understanding of air pollution.
《2. Methodology and calculation》
2. Methodology and calculation
《2.1. Introduction to the network》
2.1. Introduction to the network
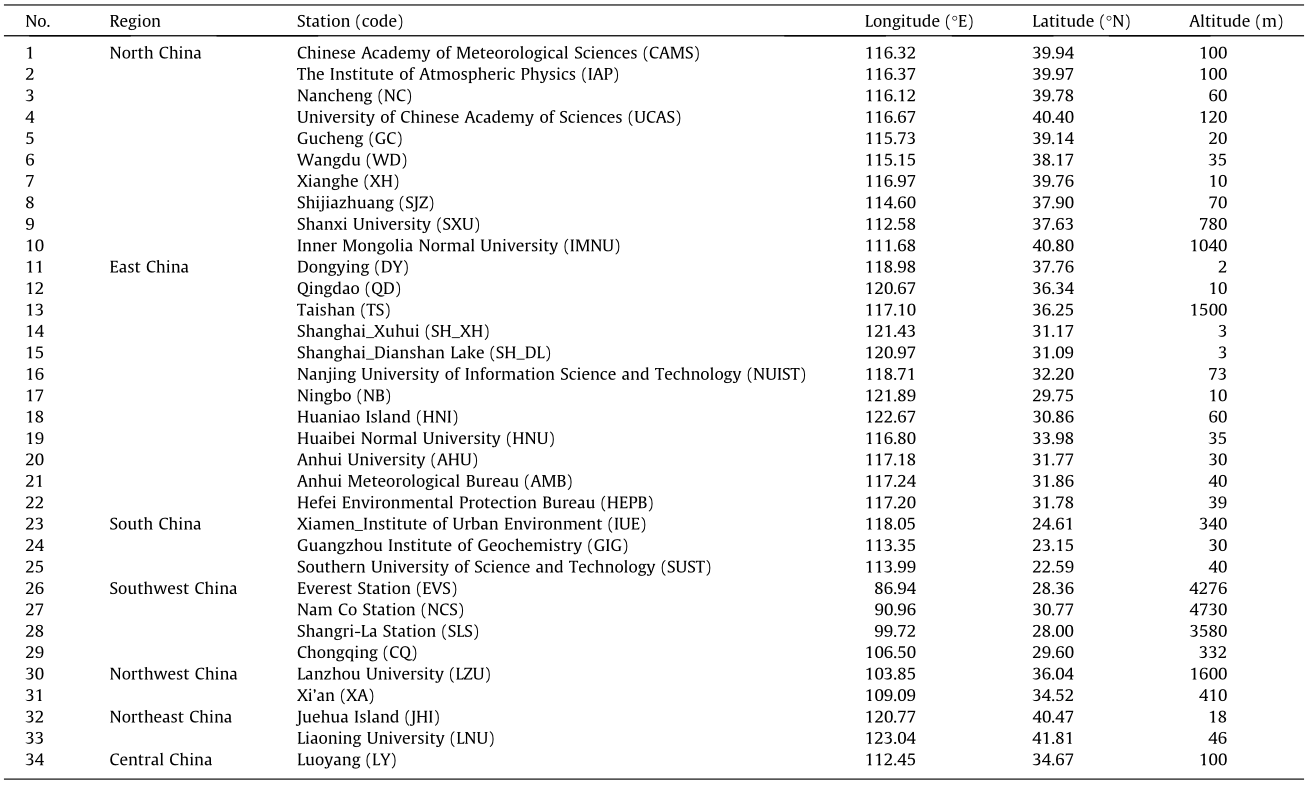
USTC has organized and complete the construction of a groundbased hyperspectral stereoscopic remote sensing network over China between December 2016 and October 2020. The core instrument within this network is MAX-DOAS. Table 1 shows the geographic distribution and details of the network stations, respectively, which include 34 standard instruments and cover seven major regions of China (ten stations in north China, 12 stations in east China, three stations in south China, four stations in southwest China, two stations in northwest China, two stations in northeast China, and one station in central China). Table 2 presents the observational elements and the instrument detection limit and vertical distribution spatiotemporal resolution of these elements.
《Table 1》
Table 1 Geographic of MAX-DOAS network of China. The classification of regions is based on the standards of the Administrative Division of China.
《Table 2》
Table 2 Observational elements, detection limit, and temporal and spatial resolutions across the network.
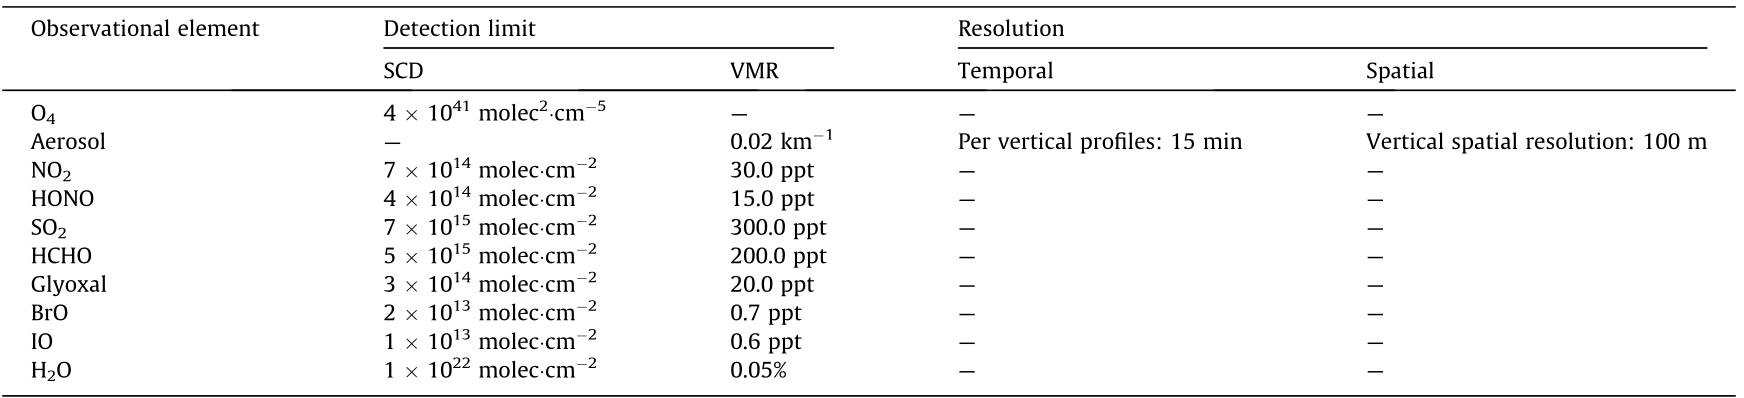
SCD: slant column density; VMR: volume mixing ratio; molec: molecule; ppt: part per trillion.
《2.2. Ground-based hyperspectral stereoscopic remote sensing measurements》
2.2. Ground-based hyperspectral stereoscopic remote sensing measurements
2.2.1. Instrument setup
The MAX-DOAS instrument consists of three major parts (Fig. 1): a telescope with an accuracy of < 0.1° and a field of view of < 0.3°, two spectrometers (AvaSpec-ULS2048L-USB2 (Avantes, the Netherlands); ultraviolet (UV) range: 296–408 nm; visible range: 420–565 nm; spectral resolutions: 0.45 nm) with temperature stabilized at 20 °C (deviation < 0.05 °C), and a computer acting as the system controller and data acquisition and transmission unit. The viewing elevation angle and azimuth angle of the telescope are controlled by two stepping motors. The telescope collects scattered sunlight and then the prism reflector and quartz fiber direct it to the spectrometers. Moreover, a charge-coupled device detector camera (ILX511 with 2048 individual pixels (Sony, Japan)) is used to convert the optical signal from analog to digital.
《Fig. 1》

Fig. 1. Schematic view of the MAX-DOAS instrument.
A full elevation sequence consists of 11 angles (i.e., 1°, 2°, 3°, 4°, 5°, 6°, 8°, 10°, 15°, 30°, and 90°), and one sequence takes about 12 min due to the time consuming of the rotation of elevation stepping motor. The settings of exposure time and scan number depend on the intensity of the scattered sunlight. The data acquisition unit is controlled by JavaScript to automatically collect scattered sunlight during the daytime and collect dark current and offset during the night. The dark current and offset were removed during the spectral analysis. In order to avoid the strong influence of stratospheric absorbers, the spectra measured with a solar zenith angle (SZA) of > 75° were filtered [20–22].
2.2.2. Spectral analysis
The software QDOAS developed by BIRA-IASB↑ is based on the least squares algorithm, and was used to analyze measured spectra from MAX-DOAS. The zenith spectrum is generally used as a reference spectrum to make differences with off-zenith spectra of each elevation sequence during the retrieval. The direct DOAS fitting results are slant column densities (DSCDs) [23]. Moreover, the ring spectrum was calculated for the measured spectrum with reference to the absorption from the stratosphere. DSCDs of oxygen dimer (O4) and NO2 were analyzed in the interval of 338.0–370.0 nm, and the 336.5–359.0 nm wavelength interval was used for HCHO absorption analysis, based on recommended settings from the Cabauw intercomparison campaign for nitrogen dioxide measuring instruments (CINDI) [24,25]. Details of fit settings for O4, NO2, and HCHO are listed in Table 3 [26–34]. A typical DOAS fit example of the above three species is shown in Fig. 2. To ensure the validity of the retrieved data, O4, NO2, and HCHO DSCDs with a root mean square (RMS) larger than 5 × 10⁻⁴ were filtered out. In addition, considering the cloud effect, a threshold obtained through fitting a fifth-order polynomial to color index data at each time was used to filter out DSCDs with a color index less than 10% [35].
↑ http://uv–vis.aeronomie.be/software/QDOAS/ (last access: December 15 2020).
《Table 3》
Table 3 DOAS settings used for the O4, NO2, and HCHO DSCDs’ retrieval.
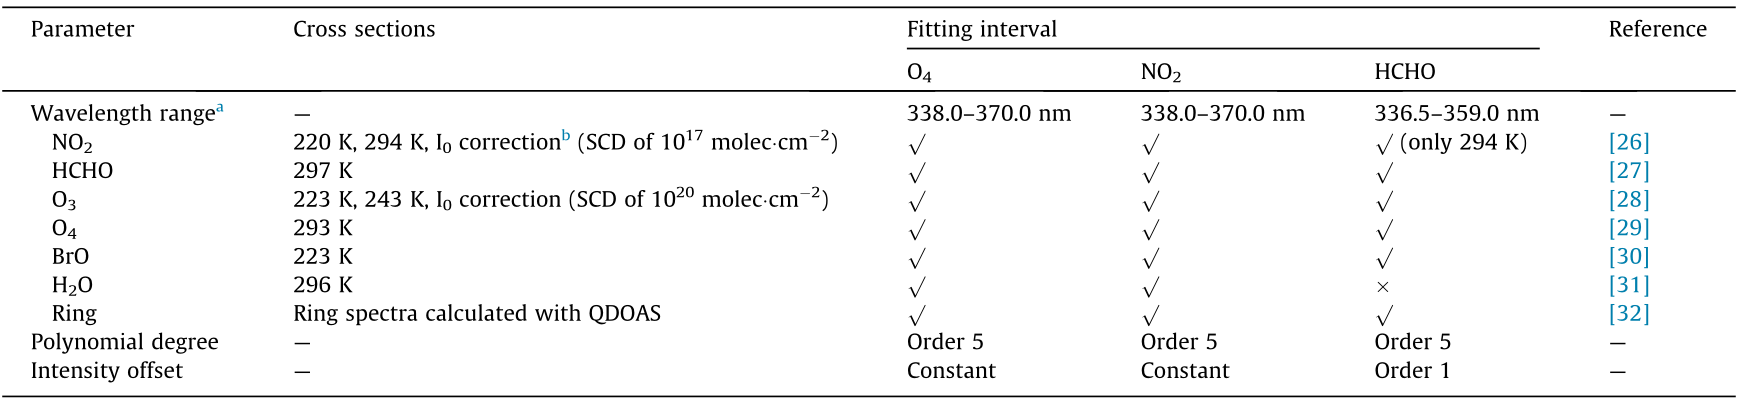
a Wavelength calibration: based on a high-resolution solar reference spectrum (SAO2010 solar spectra) [33].
b Solar I0 correction [34].
《Fig. 2》

Fig. 2. Typical DOAS spectral fittings for (a) O4, (b) NO2, and (c) HCHO. RMS: root mean square.
2.2.3. Vertical profile retrieval algorithm
The vertical profile inversion algorithm for aerosol and trace gases (i.e., NO2 and HCHO) was developed based on the optical estimation method (OEM) [36] and employs the radiative transfer model linearized pseudo-spherical vector discrete ordinate radiative transfer models (VLIDORT) as the forward model [37]. The following cost function χ2 was selected to determine the maximum a posteriori state vector x.

where  describes the measurement vector y (measured DSCDs) as a function of the retrieval state vector x (aerosol and trace gases vertical profiles) and true atmospheric state parameters b (i.e., temperature and pressure profiles, albedo, single scattering albedo, asymmetry factor, and Ångström exponent). The temperature and pressure profiles were taken from a climatology database [17]. Aerosol optical properties are selected from the monthly averaged results of the moderate resolution imaging spectroradiometer (MODIS).
  is the a priori vector. The exponential decreasing shape was selected for the initial a priori profiles of all aerosol and trace gases. In the iteration process, the state profile retrieved from the previous step will be used as the a priori profile for the next step. Moreover, aerosol optical depth (AOD) simulated by weather research and forecasting model coupled with chemistry (WRF– Chem) is also an input priori information in this algorithm.
  and
and  describe the covariance matrices of and y, respectively. The inversion strategy is based on a Gauss–Newton (GN) scheme. Jacobians of
  are used as weighting function in this strategy, which describes the changes of simulated DSCDs of each elevation angle when x within a certain layer is varied. This weighting function calculation process greatly improves the inversion speed compared with the method proposed in the algorithm of Ref. [38]. The determination of air mass factor (AMF) is crucial for the retrieval of trace gases vertical profile. Therefore, two inversion steps were used in this algorithm. The aerosol vertical profile was retrieved first, and then inputted into VLIDORT to participate in retrieval of the vertical profile of the trace gases.
《2.3. Ancillary data》
2.3. Ancillary data
Surface PM2.5, NO2, and O3 concentrations were obtained from the stations of national environmental monitoring network↑ . Surface HCHO concentrations were measured by an AERO LASER AL4021 installed in Peking University (116.31 °E, 39.98 °N). A dynamical-chemical model (WRF–Chem) was used to simulate AOD, wind speed, and direction. A detailed description of this model can be found in Ref. [39]. The horizontal simulation resolution was set to (10 × 10) km2 , and 44 hybrid pressure-sigma levels were set from the ground to 5000 Pa in the vertical direction. The O3 vertical profiles were monitored by in situ instruments installed on the tower located in the IAP with a temporal resolution of 1 h.
↑ https://quotsoft.net/air/ (last access: November 2 2020).
《3. Results and discussion》
3. Results and discussion
《3.1. Regional differences in vertical distribution of aerosol and trace gases》
3.1. Regional differences in vertical distribution of aerosol and trace gases
In the last few years, PM2.5 and O3 in China have shown clear characteristics of regional uneven distribution and frequent transmission. Current monitoring networks in China are mainly focused on the ground surface layer [40,41] without monitoring the stereoscopic distribution of PM2.5 and O3 and their precursors, which creates obstacles to the full understanding of their formation to assist air quality management. Therefore, we focused on the vertical structure difference of PM2.5 and O3 and their precursors in four central cities (Beijing, Shanghai, Shenzhen, and Chongqing) to represent the overall conditions in the four major polluted regions of China: the JJJ, YRD, PRD, and SB area.
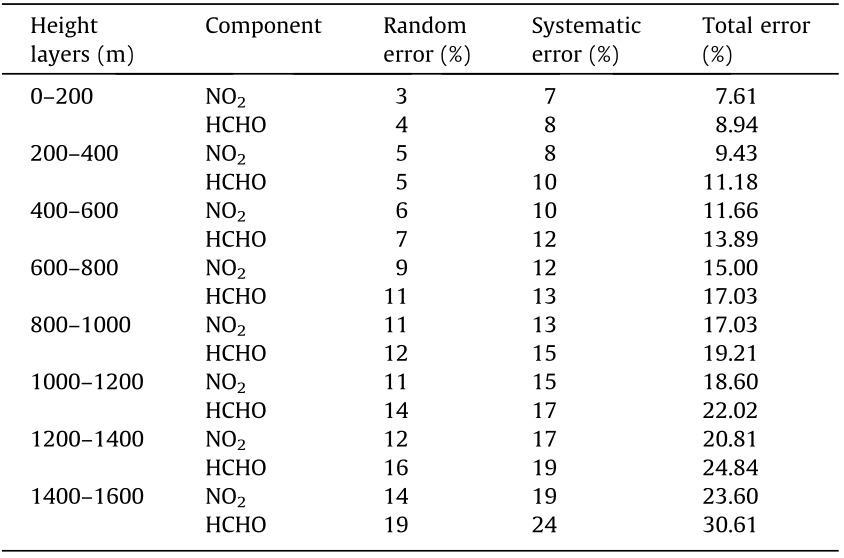
Four MAX-DOAS stations in the above four central cities, CAMS, SH_XH, SUST, and CQ (Table 1), were selected to study the difference of vertical structure of aerosol, NO2, and HCHO from 1 March 2019 to 1 March 2020. The CAMS station was selected for retrieved error analysis, and the details are presented in Table 4. Aerosol is the primary pollutant in the atmospheric environment. As shown in Fig. 3(a), a good agreement was observed between the hourly averaged aerosol surface extinction coefficient from the MAXDOAS retrievals and the in situ PM2.5 mass concentration in CAMS during the winter of 2019. The correlation coefficient between aerosol and PM2.5 depends on the relative humidity (RH) [42], due to the hygroscopic growth of fine particles. To avoid the influence of the RH on the aerosol extinction coefficient in different cities, we normalized the yearly averaged aerosol extinction profiles retrieved from these four stations (Fig. 3(b)). The normalized aerosol extinction vertical profile exhibits a box shape under 400 m in CAMS, indicating that the aerosol particles were well mixed by the turbulence and the weak horizontal transport in the boundary layer height (BLH). Zhang et al. [43] and Liu et al. [44] also found a similar aerosol vertical distribution structure by aircraft measurements in Beijing. The normalized aerosol extinction vertical profile in SH_XH showed an exponential shape. This is likely to be because aerosol pollutants in Shanghai are mainly from local emission, except for the biomass burning season that can be affected by regional transport [45]. The normalized aerosol extinction vertical profile also showed an exponential shape in Chongqing, because the distribution of particulate matter concentrations in SB showed high horizontal homogeneities [46]. The normalized aerosol extinction vertical profile exhibits a Gaussian shape in SUST. Liu et al. [47] reported that the regional transport contributes more than 50% to PM2.5 concentrations, and local emission only contributed about 10% in Shenzhen. Moreover, the relative contributions from local emissions and regional transport could vary considerably by location. For example, unlike in Shenzhen, Zhao et al. [48] found that the local contribution is around 40%–70% (average 63%) in an industrial city in NCP.
《Table 4》
Table 4 Estimated errors for retrieved NO2 and HCHO in different height layers in CAMS station.
《Fig. 3》
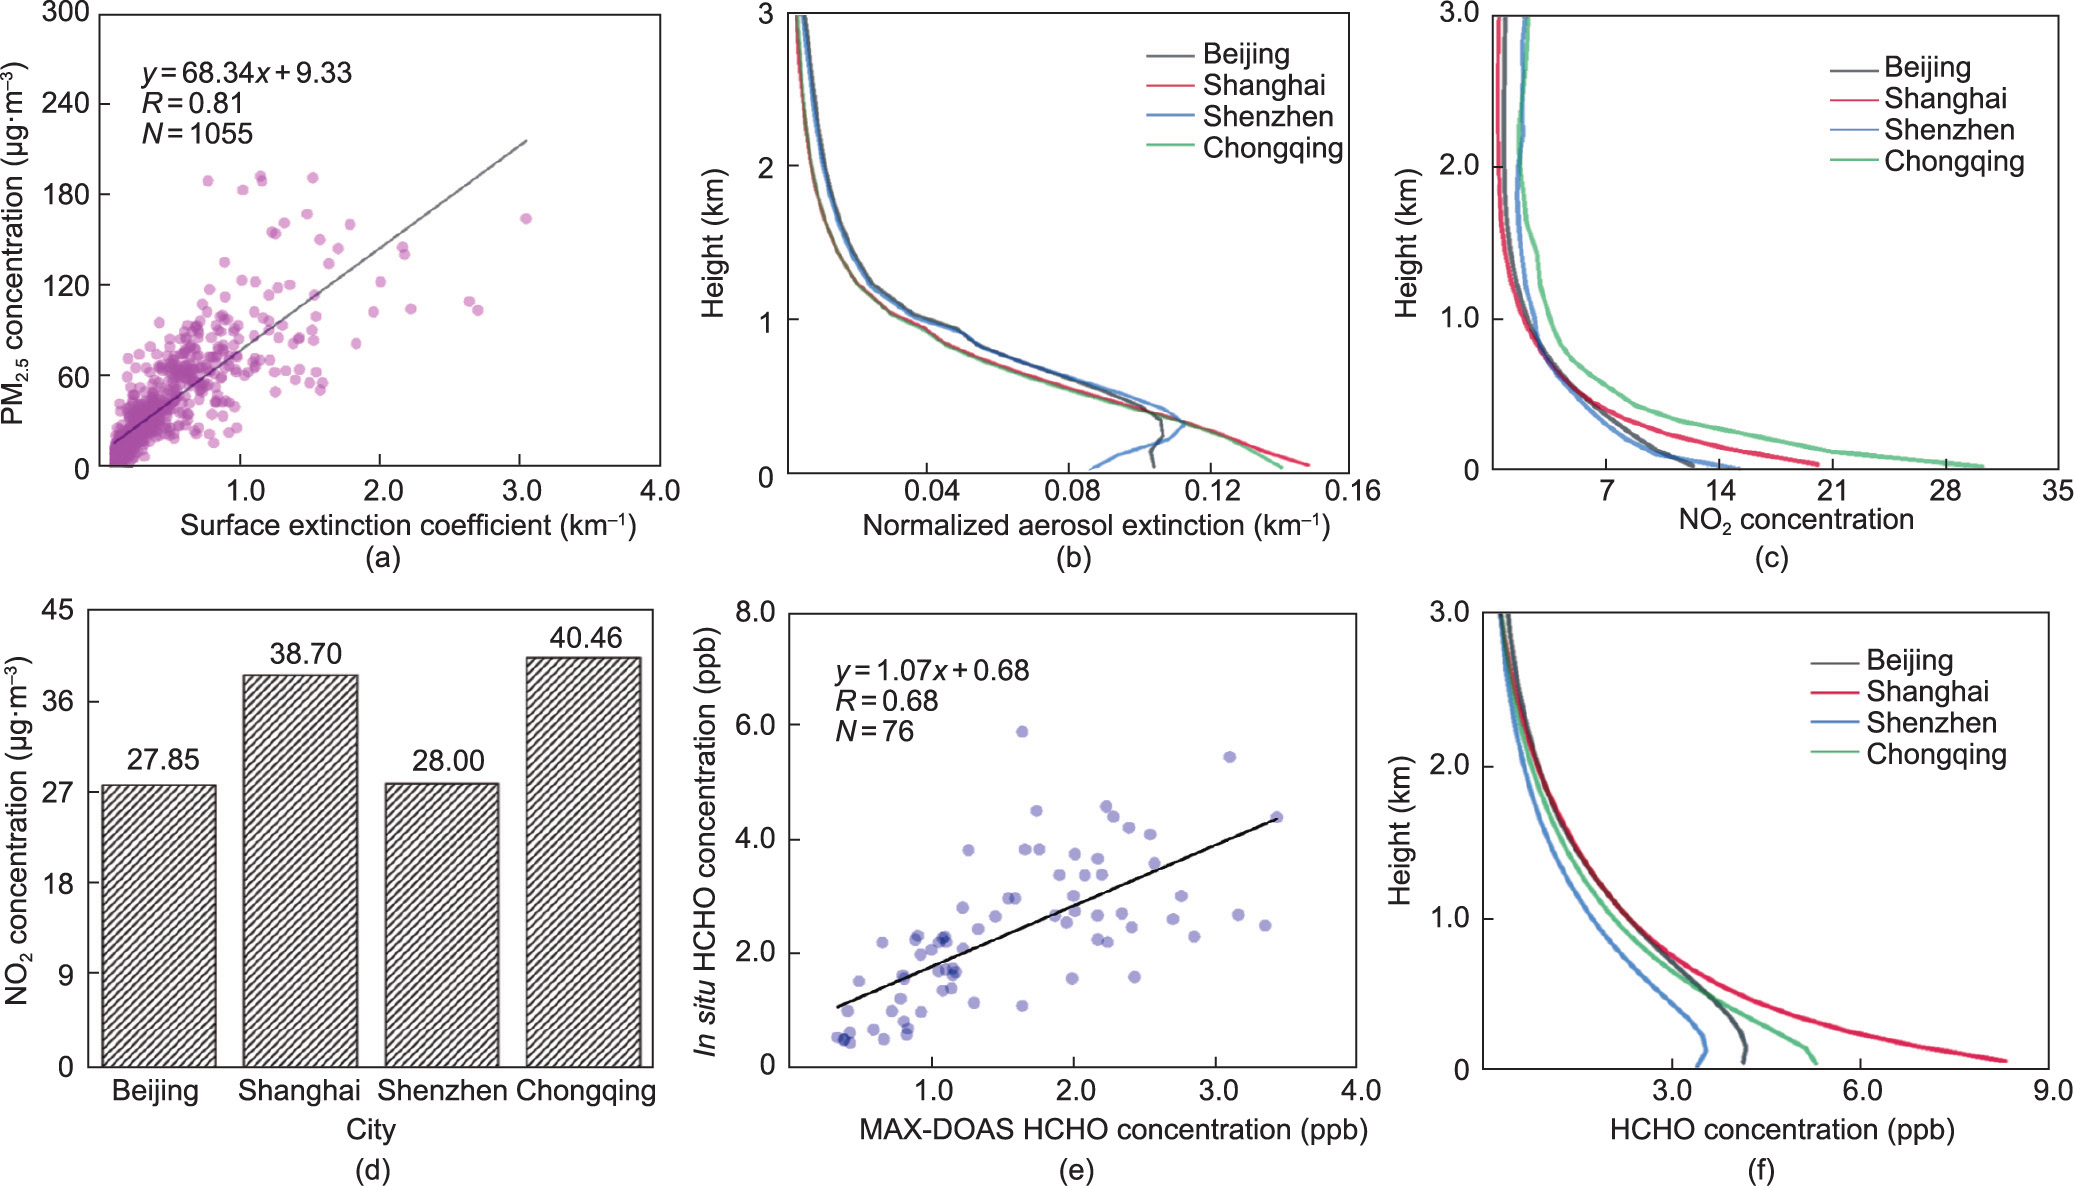
Fig. 3. (a) The scatter plots of surface PM2.5 and surface aerosol extinction in Beijing 2019. (b) The normalized and yearly averaged aerosol profiles in Beijing, Shanghai, Shenzhen, and Chongqing. (c) The yearly averaged vertical profiles of NO2 in the above four cities. (d) The yearly averaged surface NO2 concentration in above four cities. (e) describes the scatter plots of surface HCHO between in situ measured and MAX-DOAS retrieved. R: Pearson correlation coefficient. (f) The yearly averaged vertical profiles of HCHO in above four cities. N: the number of valid data; ppb: part per billion.
NO2 and HCHO are the common precursors of secondary aerosol and O3. Fig. 3(c) shows the yearly averaged NO2 vertical profiles in the above four stations. The vertical distribution structure of NO2 in these four stations all exhibit an exponential shape due to the traffic emissions [13,15,49–51]. Moreover, the adverse diffusion condition is also a driving force causing NO2 to be mainly distributed at the surface in Chongqing [52,53]. Compared with Fig. 3(d), we found that the variation of yearly averaged NO2 surface concentration from MAX-DOAS retrievals and in situ measurements agreed well among the above four stations. The surface NO2 concentrations at these four stations decreased in the order of CQ > SH_XH > SUST > CAMS. The basin topography hinders the regional diffusion of NO2, resulting in the highest surface NO2 concentration among the four stations in CQ. The considerable decrease in the NO2 concentration in Beijing can be attributed to the powerful emission reduction and regional joint prevention and control measures in recent years and the impact of the coronavirus disease 2019 (COVID-19) in early 2020. As shown in Fig. 3(e), the hourly averaged HCHO surface concentration from the MAX-DOAS retrievals show a good agreement with in situ HCHO surface concentration with a Pearson correlation coefficient (R) of 0.68 in CAMS from May to October of 2019. Fig. 3(f) shows the yearly averaged HCHO vertical profiles in the above four stations, respectively, which exhibited a Gaussian shape in CAMS, and the highest HCHO concentration was distributed in the 100–200 m layer. That is because the short-distance regional transport of secondary HCHO produced from VOCs photolysis in the southwest of Beijing is also a non-ignorable source of HCHO in CAMS, especially in summer [54,55]. The yearly averaged HCHO shows an exponential shape and the highest surface concentration among above the four stations in SH_XH because the HCHO concentration mainly originates from local primary emission and the photolysis of VOCs [15,56]. The yearly averaged HCHO also showed an exponential shape due to the local industrial emissions in CQ [21]. The yearly averaged HCHO exhibited a Gaussian shape in SUST. Luo et al. [57] reported that the short-distance regional transport of industrial emissions located in northeast Shenzhen is one of the sources of HCHO in SUST.
《3.2. Regional transmission analysis of aerosol and the corresponding precursors》
3.2. Regional transmission analysis of aerosol and the corresponding precursors
The NCP is one of the most polluted regions in China, and several megacities are located in this area (i.e., Beijing, Tianjin, and Shijiazhuang). The NCP is surrounded by Mt. Taihang to the west and Mt. Yan to the north. The semi-basin geographical features and continental monsoon climate mean that regional transport is an important factor affecting air quality in the NCP. The southwest wind belt is the main transport pathway in this region, which can drive PM2.5 and O3 and their precursors to be transmitted in the southwest–northeast direction. Several studies have explored the influences of regional transport over NCP. A community multiscale air quality (CMAQ) model simulation study reported by Streets et al. [58] indicates that unfavorable meteorological conditions can drive the regional transport of PM2.5 and O3 between Beijing and the NCP through this southwest-northeast pathway in summer. Wu et al. [59] used a WRF–Chem simulation to evaluate the contributions of regional transport from NCP to the elevated PM2.5 and O3 levels in Beijing during summer, and indicated that regional transport contributed 61.5% and 36.6% to PM2.5 and O3, respectively. Based on synchronous in situ observations in several cities of the Beijing–Tianjin–Hebei (BTH) region, Ge et al. [60] found the regional transport from southwest to northeast dominated by southwesterly winds is an important role of the daytime elevated PM2.5 and O3 levels. Ge et al. [61] and Zhao et al. [62] also reported a south-to-north transport bell existing over the NCP, which caused regional transport of PM2.5 and O3. However, current in situ observations and air quality models are woefully inadequate to fully understand the regional transport of PM2.5 and O3 and their precursors. Air quality models without stereoscopic observation data as support remain large uncertainties in modeling and prediction studies, and the regional transport of air pollutants will be greatly underestimated when using in situ observations alone because the transport process is always associated with a highlayer transport belt. A ground-based hyperspectral stereoscopic remote sensing strategy that can monitor the stereoscopic distribution of air pollutants is greatly needed to beat down the disadvantages of the above two techniques in evaluating the regional transport of air pollutants.
Fig. 4 shows the location and topography of the BTH region, and five different MAX-DOAS stations (SJZ, WD, NC, CAMS, and UCAS) of the network are located in the southwest–northeast pathway of this region. A typical southwest–northeast transport process in this region occurring on 5 March 2020, was selected as a case study to indicate the advantages of ground-based hyperspectral stereoscopic remote sensing strategy assisted by the wind field dataset simulated by the WRF model in evaluating transport of air pollutants. Figs. 5(a) and (b) describe the spatial variations of NO2 and HCHO from the tropospheric monitoring instrument (TROPOMI) in the BTH region on 5 March 2020. NO2 showed a clear belt distribution along the southwest–northeast pathway, and HCHO showed a continuous regional distribution between NC and CAMS. Figs. 5(c) and (d) present the regional wind field information at 0– 20 and 600–1000 m, respectively. The wind direction in these two layers were all from the southwest to northeast along the transmission pathway, and the wind speed in the 600–1000 m layer was about three times that in the 0–20 m layer. Correspondingly, the 600–1000 m layer was the main height of transmission.
《Fig. 4》

Fig. 4. Study area location, topography, and distribution of MAX-DOAS stations. Black points represent the stations.
Fig. 6 shows the vertical distributions of aerosol, NO2, and HCHO in the above five stations located along the southwest– northeast pathway on 5 March 2020. It was found that the AOD in these five stations decreased in the order of SJZ > WD > NC > CAMS > UCAS. The high-extinction air mass gradually increased to 700 m after 10:00 in SJZ and was transported to the northeast direction along the transmission pathway driven by the southwest wind. Subsequently, high-extinction aerosols at 800 m were measured in WD after 12:00 and in NC after 13:00. Subsequently, the transmission height of aerosol gradually decreased, and then high-extinction signals were measured near the ground surface after 14:30 in CAMS. Driven by topography and the continuous southwest wind, the high-extinction air mass increased once again and continued to be transported in the northeast direction from CAMS. Finally, the high-extinction aerosol was measured at 500 m in UCAS after 16:00. High-concentration NO2 near the ground surface was measured in SJZ and CAMS, which was mainly related to the high vehicle emissions in Shijiazhuang and Beijing. There are no clear ground NO2 emission sources in WD and NC, with high vegetation coverage. Nevertheless, highconcentration NO2 air masses at 800 m were measured in WD after 11:00 and in NC after 12:00, respectively. At the same transmission height in these two stations, the appearance of high-concentration NO2 air masses were all about 1 h earlier than those of aerosols. The transport process was accompanied by the formation of secondary inorganic aerosols, based on NO2 as a main precursor. Moreover, the high-altitude transmission process of HCHO between NC and CAMS stations was also observed (Fig. 6), and mapped to the HCHO transmission belt observed by TROPOMI between NC and CAMS shown in Fig. 5(b). HCHO at NC station is mainly produced by the photolysis of natural source VOCs [63,64]. The air mass carrying secondary-generated HCHO gradually increased to 800 m driven by meteorological elements (i.e., wind and BLH) after 12:00 in NC. Half an hour later, highconcentration HCHO air mass was measured at 800 m in CAMS. The regional transmission of HCHO could affect the variation of O3 concentration in Beijing to a certain extent.
《Fig. 5》
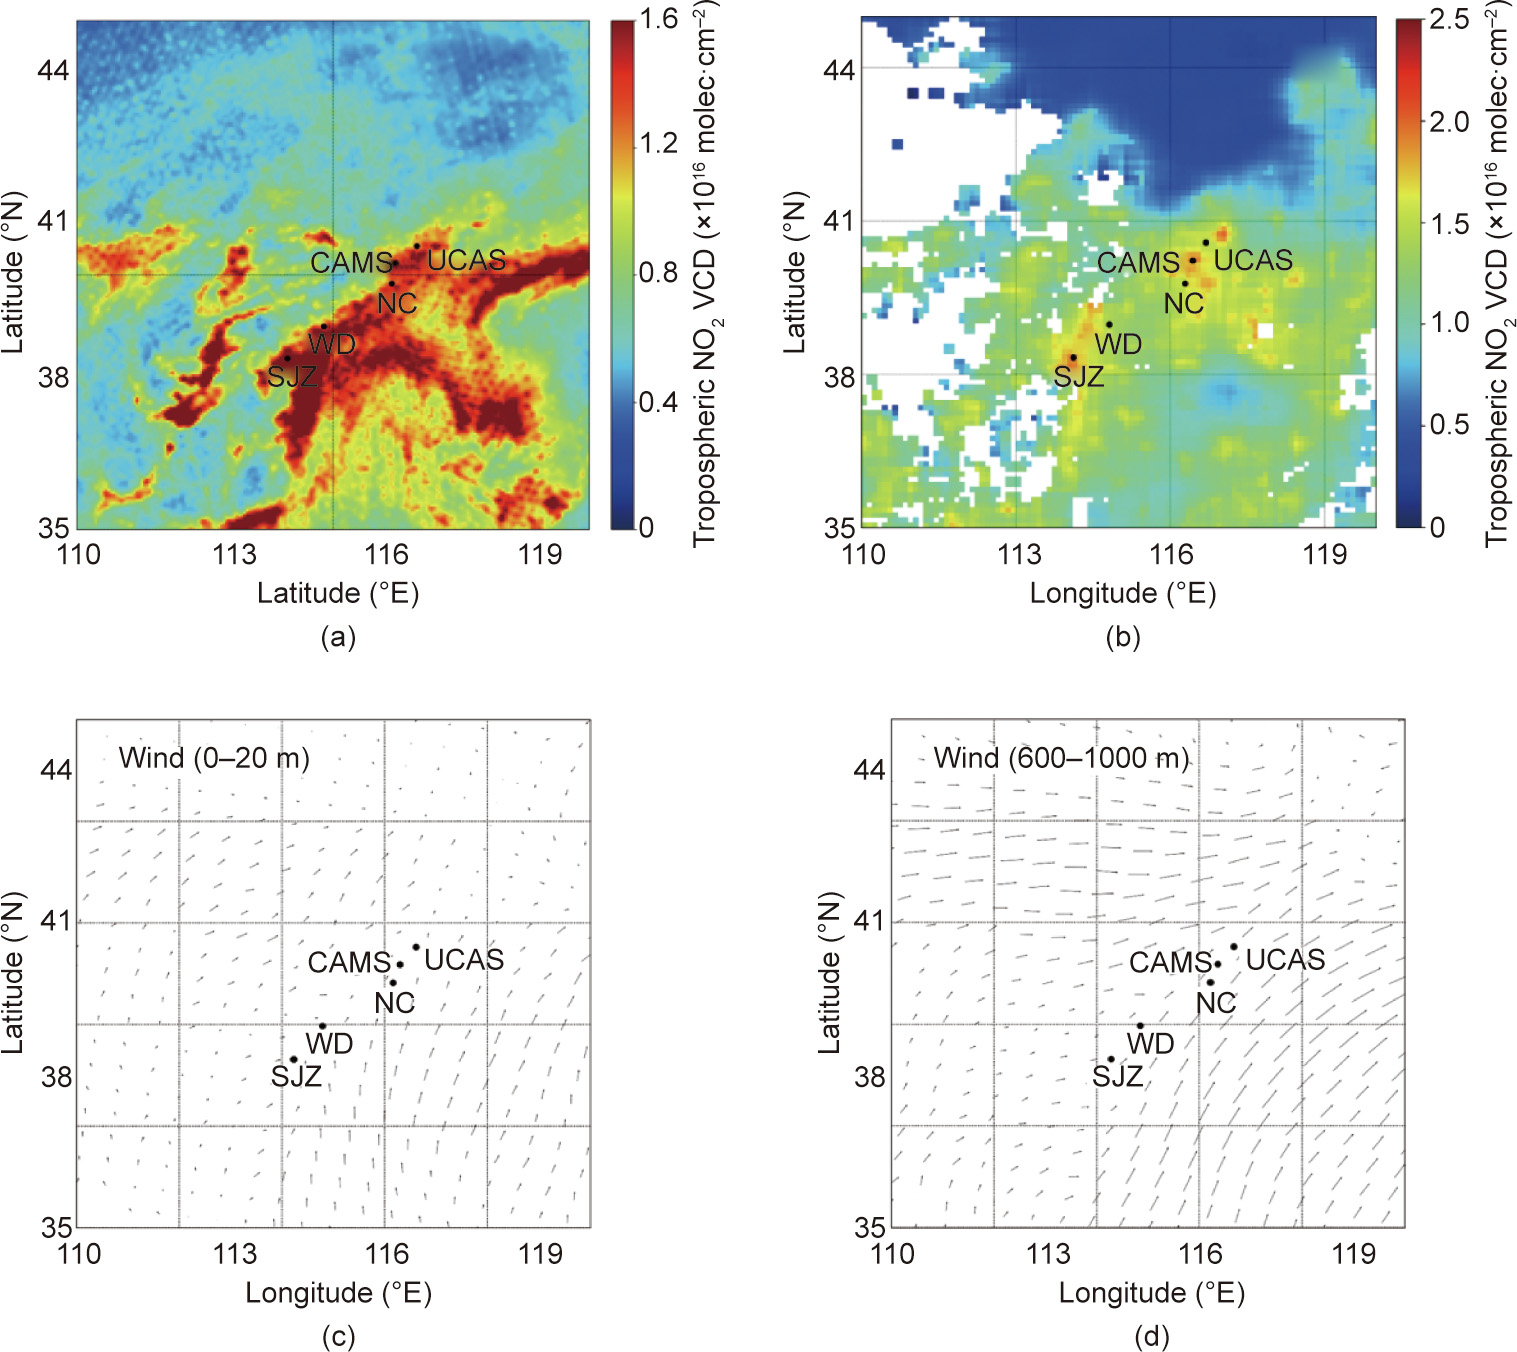
Fig. 5. (a, b) The spatial distribution in NCP of NO2 and HCHO monitored by TROPOMI on 5 March 2020, respectively. (c, d) The wind field on 0–20 and 600–1000 m layers simulated by WRF on 5 March 2020, respectively. The arrows represent the wind direction.
《Fig. 6》
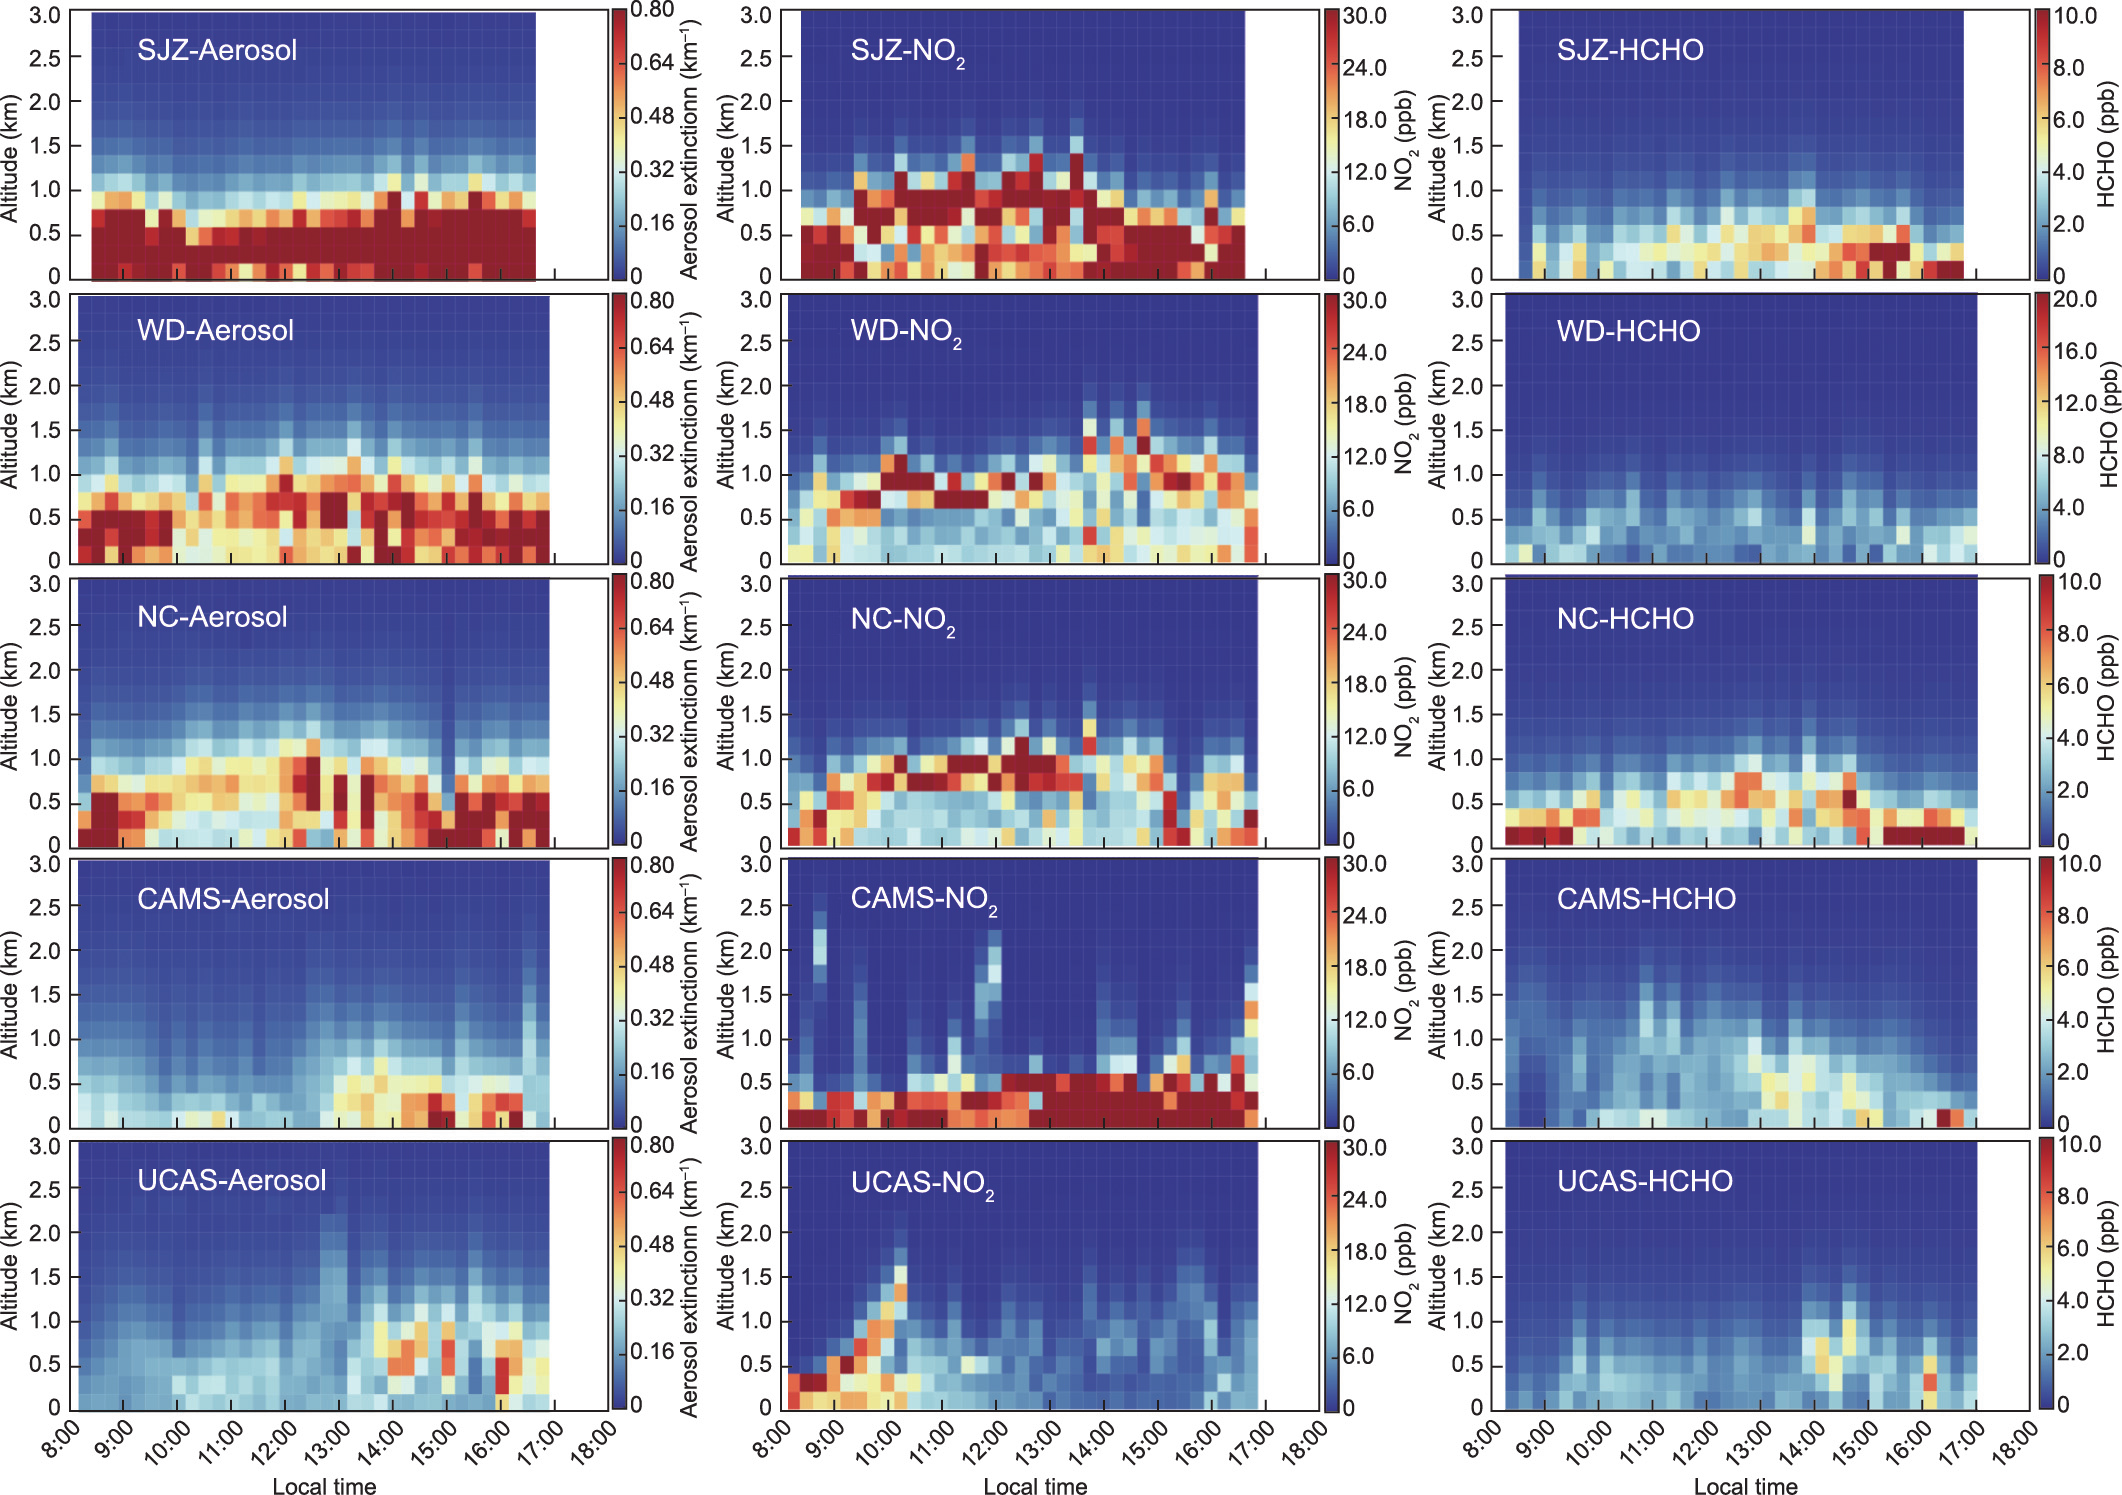
Fig. 6. Vertical profiles of aerosol, NO2, and HCHO in SJZ, WD, NC, CAMS, and UCAS stations on 5 March 2020, respectively.
《3.3. O3–NOx–VOCs sensitivities in vertical space》
3.3. O3–NOx–VOCs sensitivities in vertical space
In recent years, the continuous increase of O3 concentration has caused it to become the second major pollutant after PM2.5, which has a serious impact on ambient air quality and human health in China. The O3 in the lower troposphere mainly originates from photochemical reactions of its precursors, regional transport, and the free tropospheric or stratospheric invasion [65]. NOx and VOCs are two major precursors of O3. The chemical formation of O3 depends upon the one (NOx or VOCs) with substance being inadequate in the reactions. Therefore, the key to controlling O3 pollution is to effectively control the emissions of its precursors. However, the sensitive types of O3 formation vary with altitude. We also need to be very clear about the sensitive types of O3 formation in different heights within the BLH to effectively control O3 formation. HCHO is an oxidation product of most VOCs and related to their total reactivity [66–68]. It can thus be applied as an indicator of VOCs. Nevertheless, researchers have mainly focused on the sensitive types of O3 formation at different altitudes. For example, Geng et al. [69] indicated that the formation of surface O3 is mainly under a VOC-sensitive regime in Shanghai using in situ measured O3, NOx, and VOCs. Liu et al. [70] used ozone monitoring instrument (OMI)-observed NO2 and HCHO tropospheric VCDs to determine the sensitive types of O3 formation in Beijing during the 2014 Asia–Pacific Economic Cooperation (APEC) summit and 2015 Grand Military Parade.
Observations of NO2 and HCHO vertical distributions from ground-based hyperspectral stereoscopic remote sensing network can help to investigate the O3 formation pathways in different regions. In this study, Beijing was selected as a typical city to determine sensitive types of O3 formation in three different height layers (0–100, 100–200, and 200–300 m) from May to October 2019. The O3 concentrations in these layers were measured using in situ instruments installed in a tower at the IAP. The NO2 and HCHO concentrations in these three layers were retrieved from MAXDOAS at the IAP station. With reference to Su et al. [71], the sensitivity thresholds of O3 formation in these three layers were determined by the slope of the linear regression analysis for O3 versus the normalized HCHO or NO2 ratios. Fig. 7 shows the time series of O3, NO2, and HCHO all with temporal resolutions of 1 h in these three layers from May to October 2019. As shown in Fig. 8, the sensitive types of O3 formation were divided into VOCs-limited, VOCs–NOx-limited, and NOx-limited. The O3 production sensitivity regimes in the 0–100, 100–200, and 200–300 m layers are shown in Table 5. In the 0–100 m layer, the chemical sensitivity of local O3 production is mainly under VOCs-limited conditions, accounting for 71.10% of the effective time of the total observation period. The VOCs–NOx-limited and NOx-limited conditions accounted for 16.46% and 12.44%, respectively. The NOx-limited conditions mainly occurred in July and early October. In the 100–200 m layer, the chemical sensitivity of local O3 production accounted for 64.31%, 27.02%, and 8.67% under VOCs-limited, VOCs–NOx-limited, and NOx-limited conditions, respectively. In the 200–300 m layer, the chemical sensitivity of local O3 production accounted for 56.10%, 35.55%, and 8.35% under VOCs-limited, VOCs–NOx-limited, and NOx-limited conditions, respectively. The proportions of VOCslimited, and NOx-limited conditions of the chemical sensitivity of local O3 production gradually decreased from the 0–100 m layer to the 200–300 m layer, whereas the proportion of VOCs–NOx-limited conditions showed the opposite trend.
《Fig. 7》

Fig. 7. The time series of NO2, HCHO, O3, and the O3 production sensitivity on (a) 0–100, (b) 100–200, and (c) 200–300 m layers, respectively.
《Fig. 8》

Fig. 8. O3 production sensitivity regimes in 0–100, 100–200, and 200–300 m layers.
《Table 5》
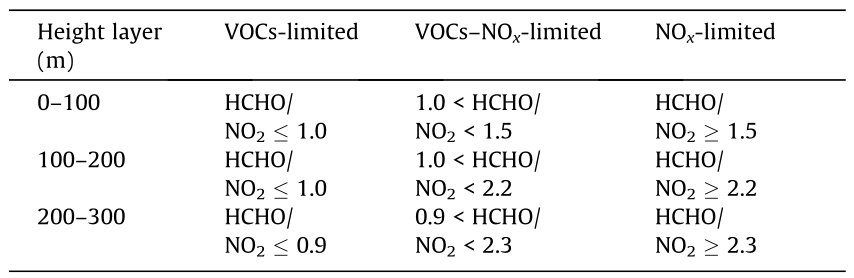
Table 5 O3 production sensitivity regimes in 0–100, 100–200, and 200–300 m height layers.
The O3, NO2, and HCHO vertical profiles measured at 14:00 on 2 July 2019 were selected as a typical case to study the O3–NOx– VOCs sensitivities in different layers. As shown in Fig. 9(a), a high O3 concentration was observed in the 0–100 m layer, and the corresponding chemical sensitivity of local O3 production in this layer indicated an NOx-limited regime. We also found that the NO2 concentration at this layer also had a high value (Fig. 9(b)). Fig. 10(a) depicts the O3 vertical profile at 14:00 on 2 July 2019 and the averaged O3 vertical profile of July 2019. The averaged concentration of the former was approximately twice that of the latter, especially in the 0–100 m layer, in which the former was approximately 1.99 times higher than that of the later. In order to estimate the influence of the high O3 concentration in the 0–100 m layer to the ground surface, the diurnal cycle of ground surface concentration of O3 on 2 July 2019 was compared with that the monthly average diurnal cycle for July 2019 (Fig. 10(b)). The monthly averaged diurnal cycle of O3 peaked at 14:00 and decreased thereafter; however, the diurnal cycle of O3 on 2 July 2019 also peaked at 14:00, but continued to increase at least until 15:00. This indicates that the downward transport of O3 in BLH could contribute to the increase of the ground surface O3 concentration.
《Fig. 9》
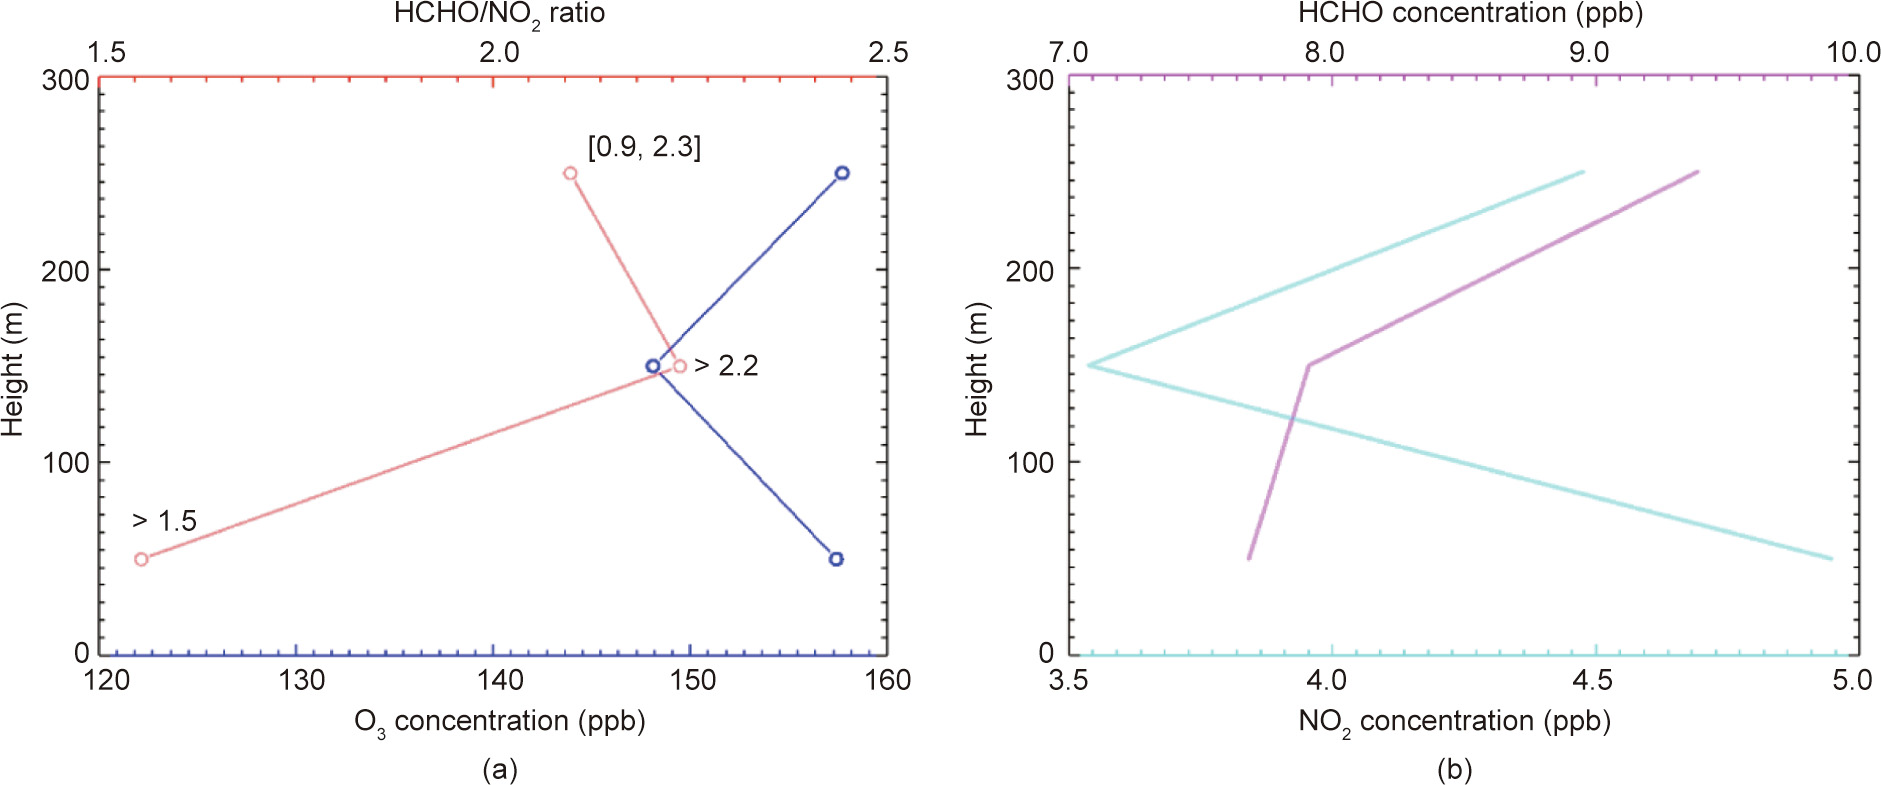
Fig. 9. (a) The vertical distribution of O3 and HCHO/NO2 ratios; and (b) the vertical distribution of NO2 and HCHO at 14:00 on 2 July 2019.
《Fig. 10》
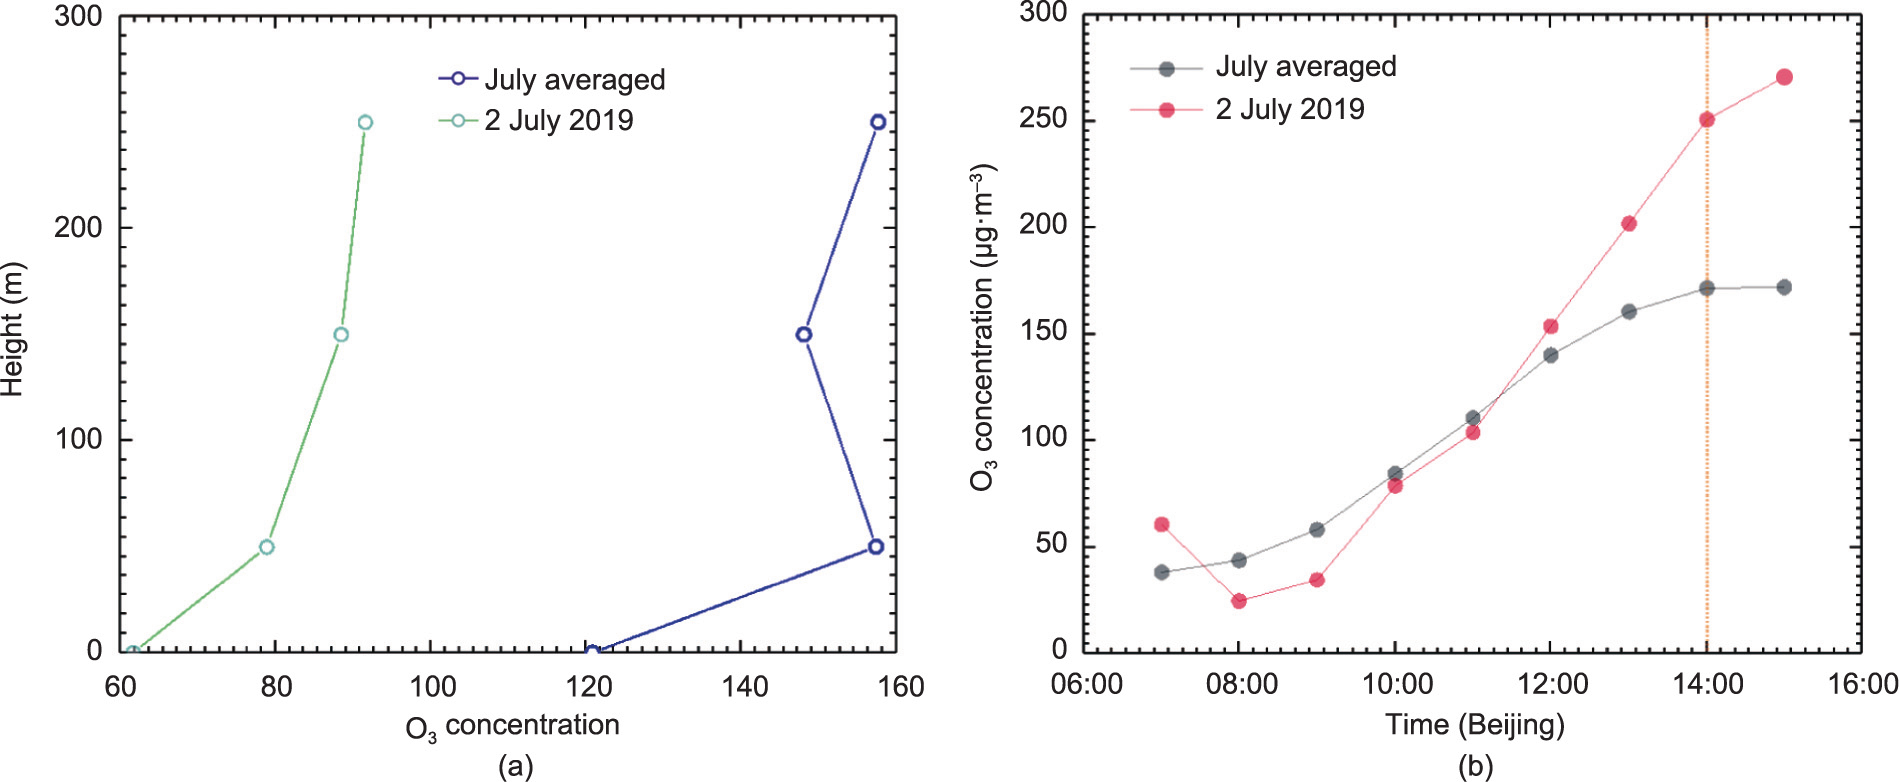
Fig. 10. (a) The monthly averaged O3 profile on July 2019 and the O3 profile at 14:00 on July 2, 2019. (b) The time series of monthly averaged surface O3 on July 2019 and the time series of surface O3 on 2 July 2019.
《4. Conclusions》
4. Conclusions
A ground-based hyperspectral stereoscopic remote sensing network based on MAX-DOAS was established by USTC, and vertical profiles of aerosol, O3, and their common precursors were monitored. Firstly, we explored the differences in the vertical structure of aerosols, NO2, and HCHO in four typical pollution regions (JJJ, YRD, PRD, and SB). The structure of aerosol vertical profile showed a box shape under 400 m in JJJ, due to the regional transport and the effect of BLH. Given that the regional transport contributed more than 50% to PM2.5 in the SUST station, the vertical profile exhibits a Gaussian shape in PRD. The vertical profiles in PRD and SB exhibit exponential shape, due to the contribution of local emissions and the limitation of regional diffusion conditions. The structure of NO2 vertical profiles in the above four regions were all exponential because of vehicle emissions. The yearly averaged vertical profile of HCHO shows a Gaussian shape attributing to the short-distance transport from the southwest direction in CAMS and the regional transport from northeast industrial emissions in SUST. The vertical structure of HCHO exhibited an exponential shape because of the local emissions and local photolysis of VOCs in SH_XH and the local industrial emission in CQ
Second, the southwest–northeast pathway of NCP was identified as a typical regional transport pathway of atmospheric composition. Five MAX-DOAS stations (SJZ, WD, NC, CAMS, and UCAS) were installed in this pathway. A typical southwest–northeast transport process in the NCP region occurred on 5 March 2020. Combining the TROPOMI NO2 VCDs and the daily averaged WRF wind field information for this day, we found that the 600– 1000 m layer was the main height of transmission. The AOD in these five stations decreased in the order of SJZ > WD > NC > CAMS > UCAS. The extinction air mass gradually upward 700 m from the surface in SJZ. Subsequently, the aerosol extinction belts were monitored in the 600–1000 m layer in both WD and NC, and there was a 1 h offset the time of its appearance between these two stations. The extinction air mass was pushed down to the surface in CAMS, and then upward to 500 m again and transported to the UCAS station. Moreover, the shortdistance regional transport processes of NO2 and HCHO in 700– 900 m layer were monitored between WD and NC and between NC and CAMS. The maximum NO2 air mass in WD and NC all occurred 1 h earlier than that of aerosol, and contributed to secondary aerosol formation during the transmission. The short distance regional transport of HCHO potentially affected the O3 concentration in Beijing.
Third, we selected CAMS as a typical site to learn O3–NOx–VOCs sensitivities in three different layers (0–100, 100–200, and 200– 300 m) from May to October, 2019. The proportions of VOCslimited and NOx-limited conditions of the chemical sensitivity of local O3 production gradually decreased from 0–100 m layer to 200–300 m layer, whereas the proportion of VOCs–NOx-limited condition showed the opposite trend. A case study describing a high concentration of O3 in the 100–200 m layer on July 2, 2019 revealed that the downward transport of O3 could contribute to the increase of ground surface O3 concentration. This suggest that the government needs to control the increase of O3 concentration in different altitude layers and different regions.
《Acknowledgments》
Acknowledgments
This research is supported by grants from the National Key Research and Development Program of China (2018YFC0213104), Project supported by the Presidential Foundation of the Hefei Institutes of Physical Science, Chinese Academy Sciences, China— ‘‘Spark” (YZJJ2021QN06), National Natural Science Foundation of China (41722501, 91544212, 51778596, 41575021, 41977184, and 41875043), National Key Research and Development Program of China (2017YFC0210002, 2016YFC0203302, and 2017YFC0212800), Anhui Science and Technology Major Project (18030801111), the Strategic Priority Research Program of the Chinese Academy of Sciences (XDA23020301), the National Key Project for Causes and Control of Heavy Air Pollution (DQGG0102 and DQGG0205), the National High-Resolution Earth Observation Project of China (05-Y30B01-9001-19/20-3), and Civil Aerospace Technology Advance Research Project (Y7K00100KJ). From 0–100 and 200–300 m layers, the production of O3 changed from predominantly VOCs-limited condition to mainly mixed VOCs– NOx-limited condition.
《Compliance with ethics guidelines》
Compliance with ethics guidelines
Cheng Liu, Chengzhi Xing, Qihou Hu, Qihua Li, Haoran Liu, Qianqian Hong, Wei Tan, Xiangguang Ji, Hua Lin, Chuan Lu, Jinan Lin, Hanyang Liu, Shaocong Wei, Jian Chen, Kunpeng Yang, Shuntian Wang, Ting Liu, and Yujia Chen declare that they have no conflict of interest or financial conflicts to disclose.


 京公网安备 11010502051620号


