
《1. Introduction》
1. Introduction
Intrahepatic cholangiocarcinoma (ICC) is the second most common primary liver cancer. It is defined as a cholangiocarcinoma that is located proximally to the second bile ducts with a steady increase in incidence [1]. ICC is derived from the epithelial cells of the intrahepatic bile ducts, and surgical resection is the only curative treatment [2]. As a highly malignant disease, only patients receiving a complete R0 surgical resection have a good chance of survival [3]. Previously, palliative therapy has mainly been applied to patients with unresectable ICC [4]. Several studies have reported that radiotherapy and adjuvant chemotherapy provided survival benefits in advanced or aggressive biliary tumors [3,5]. However, ICC patients’ responsiveness to chemotherapy differs due to complex tumor heterogeneity. Hence, it is a pressing concern to develop a noninvasive method to differentiate between patients with good response (R) and patients with non-response (NR).
Gemcitabine (GEM) is a nucleoside analog with an active antitumor effect on various solid tumors in humans, including breast cancer, ovarian, pancreatic, and non-small cell lung tumors [6]; it is commonly used in hepatic metastasis of ICC origin [7]. The first-line choice of chemotherapy for unresectable and metastatic ICC is the combination of GEM and cisplatin [8]. In addition to chemotoxicity, GEM has immunomodulatory functions [9,10]. Furthermore, it has been shown that the immune status of patients can affect their chemosensitivity [11–13]. Hence, the relationship between the immune status of ICC patients and their sensitivity to GEM should be elucidated.
In this research, we applied cytometry by time-of-flight (CyTOF) for high-dimensional, in-depth immunophenotyping in order to compare the immune profiles of the peripheral blood mononuclear cells (PBMCs) from patients before, during, and after chemotherapy. We discovered that a high level of CD4+ CXCR3+ T cells, which represent the activation status of T cells in the peripheral blood, indicated better response to chemotherapy in ICC patients. We also examined the level of CD4+ CXCR3+ T cells in ICC tumor tissues via multiplex immunofluorescence staining and found it to be positively correlated with its level in blood. Tissue microarrays (TMAs) helped us confirm that patients with a high level of CD4+ CXCR3+ T cells have better overall survival (OS).
《2. Materials and methods》
2. Materials and methods
《2.1. Patients and sample characteristics》
2.1. Patients and sample characteristics
Blood samples were collected from 20 ICC patients treated with GEM-combined chemotherapy at three different time points (pre/ on/post-chemo) from the Eastern Hepatobiliary Surgery Hospital (EHBH). The response of these ICC patients to treatment was classified according to the response evaluation criteria in solid tumors (RECIST) as partial response (PR), stable disease (SD), or progressive disease (PD). Both PR and SD patients were regarded as R patients, while PD patients were regarded as NR patients. Since several patients dropped out during treatment, a total of 49 blood samples were finally enrolled in this study. The clinical characteristics of all 20 patients are listed in Table 1. All samples were anonymously coded in accordance with local ethical guidelines. Our CyTOF antibody panel consisted of 35 surface immune markers that could detect classic immune phenotypes of PBMCs and discover novel immune clusters. PBMCs were isolated and prestained with metal-labeled antibodies before being analyzed using CyTOF. The high-dimensional raw data were processed with dimensional reduction before further analysis. The differentially distributed immune clusters in R patients versus NR patients at different collection time points were also identified.
《Table 1》
Table 1 Clinical characteristics and RECIST status of ICC patients.

TNM: tumor (T)–node (N)–metastasis (M); GEMOX: gemcitabine plus oxaliplatin; GP: gemcitabine plus cisplatin; GS: gemcitabine plus S-1; ECOG: Eastern Cooperative Oncology Group score standard; CA19-9: carbohydrate antigen 19-9; WBC: white blood cell; NA: not available.
《2.2. Isolation of PBMCs》
2.2. Isolation of PBMCs
To isolate the PBMCs, fresh blood sample (2 mL) was mixed with an equal volume of saline. The mixture was then carefully superimposed on the surface of 4 mL of Ficoll liquid and centrifuged at 450g for 25 min. The PBMCs were concentrated in the middle layer of the mixed liquid after being centrifuged.
《2.3. Mass CyTOF and data processing》
2.3. Mass CyTOF and data processing
Each PBMC sample was stained with heavy metal-conjugated antibodies after being isolated as described previously [14]. A panel of 35 antibodies encompassing a broad range of immune subsets was used in combination (Table S1 in Appendix A). The CyTOF antibody panel could both detect classic immune phenotypes of PBMCs and discover novel immune clusters. The preconjugated antibodies were purchased directly from the supplier. After being isolated, the PBMCs were stained with 10 mmol·L–1 cisplatin for two minutes and then incubated with metal-conjugated surface-membrane antibodies for 30 minutes at 37 °C. Next, cells were fixed with the fix and perm buffer. Finally, cell intercalation (fix and perm buffer plus iridium) was performed for cellular fixation and visualization; this procedure lasted overnight and was followed by analysis on a Helios mass cytometer (Fludigm, USA). EQTM Four Element Calibration Beads were used according to the manufacturer’s instructions to normalize the signal. For each sample, 250 000–300 000 cell events were collected. Files (.fcs) were uploaded into Cytobank, populations of interest were manually gated, and events of interest were exported as .fcs files. The highdimensional raw data were processed with dimensional reduction prior to further analysis. A random sampling from each file .fcs was performed using a Cytofkit program on R software. Visualizations based on t-distributed stochastic neighbor embedding (t-SNE) and clustering based on the FlowSOM/Renograph algorithms were then performed on these cells. The differentially distributed immune clusters in R patients versus NR patients at different collection time points were also identified.
《2.4. Multiplex immunofluorescence staining》
2.4. Multiplex immunofluorescence staining
Two TMAs containing the ICC tissues of 75 patients were stained with an Opal Multiplex Immunohistochemistry Detection Kit (Perkin-Elmer, USA) and images were acquired using a Vectra 3.0 Pathology Imaging System Microscope (Perkin-Elmer). Slides were deparaffinized and rehydrated, and the antigen was retrieved using Trilogy buffer (Cell Marque) by autoclaving for 15 min. Slides were treated with 3% H2O2 for 15 min, washed, and blocked using 4% bovine serum albumin (BSA)/phosphate buffered saline (PBS)/0.1% Triton X-100 (all from Sigma). The antibodies used were: anti-CD8, anti-CD4, and anti-CXCR3. The detection dyes used for each antibody were: opal570 dye (CD8), opal520 dye (CD4), and opal690 dye (CXCR3). 40 ,6-Diamidino-2-phenylindole (DAPI) was used as a nuclear counterstain. The digital images were analyzed with Halo Image Analysis software (Indica Labs) using the Highplex FL module, which permits the simultaneous analysis of up to eight immunofluorescence-labeled markers in any cellular compartment—nucleus, cytoplasm, and/or membrane. Cells negative for all markers were black, cells positive for individual markers were colored according to that marker color, and cells positive for three markers were calculated and marked in blue in the simulation image. The clinical characteristics of all 75 patients are listed in Appendix A Table S2. The antibodies used in this experiment and the corresponding dilution ratios are listed in Appendix A Table S3.
《2.5. Data and software availability》
2.5. Data and software availability
The accession number for the CyTOF data reported in this paper and related data has been uploaded onto the Mendeley Database: https://doi.org/10.17632/3b9yc9296n.2. The software used in this study are listed in Table S1.
《2.6. Ethics approval and consent to participate》
2.6. Ethics approval and consent to participate
All procedures followed were in accordance with the ethical standards of the responsible committee on human experimentation (institutional and national) and with the Declaration of Helsinki of 1975, as revised in 2008 (5). Informed consent was obtained from all patients for being included in the study.
《3. Results》
3. Results
《3.1. GEM-combined chemotherapy alters the immune profile of PBMCs》
3.1. GEM-combined chemotherapy alters the immune profile of PBMCs
In order to explore whether the immune microenvironment of peripheral blood can predict the response of ICC patients to GEM, we designed a CyTOF-based workflow. PBMCs were isolated and processed for analysis as described in Section 2. Based on an indepth single-cell-level analysis of the PBMCs, we intended to identify specific immune clusters in PBMCs that could predict chemosensitivity in ICC patients. Multiplex immunofluorescence staining was applied to differentiate between the PBMC-derived and intra-tumoral immune profiles (Fig. 1(a)). After the original files were processed, a random sampling of 5000 cells from the CD45+ cells in each sample was collected for further analysis. With the use of PhenoGraph, a classic clustering method, 35 immune clusters were defined. We observed a major change in most immune clusters in the PBMCs after the administration of the GEM-combined drugs, and these changes in clusters were quite different in different patients (Fig. 1(b)). Fig. 1(c) depicts the molecular expression of each cluster. According to these 35 clusters, classic immune lineages including B cells, CD16+ natural killer (NK) cells, CD16+ myeloid dendritic cells (mDCs), CD4+ CD45RA+ T cells, CD4+ CD45RO+ T cells, CD8+ CD45RA+ T cells, CD8+ CD45RO+ T cells, CD4/CD8 double-negative T (DNT) cells, CD4/CD8 double-positive T (DPT) cells, and monocytes could be further refined (Fig. 1(c)). After systematic analysis, the size of the DPT cells was determined to be affected by the GEM-combined therapy with statistical significance (Fig. 1(d)). In our study, DPT cells were significantly enriched after chemotherapy (Fig. 1(d)). The expression of multiple surface markers on PBMC-derived immune cells before, during, and after chemotherapy is shown in Fig. 1(e). As shown in the t-SNE plot (Fig. 1(f)), the GEM-combined treatment increased the expression level of CD7 while reducing CD161 expression.
《Fig. 1》
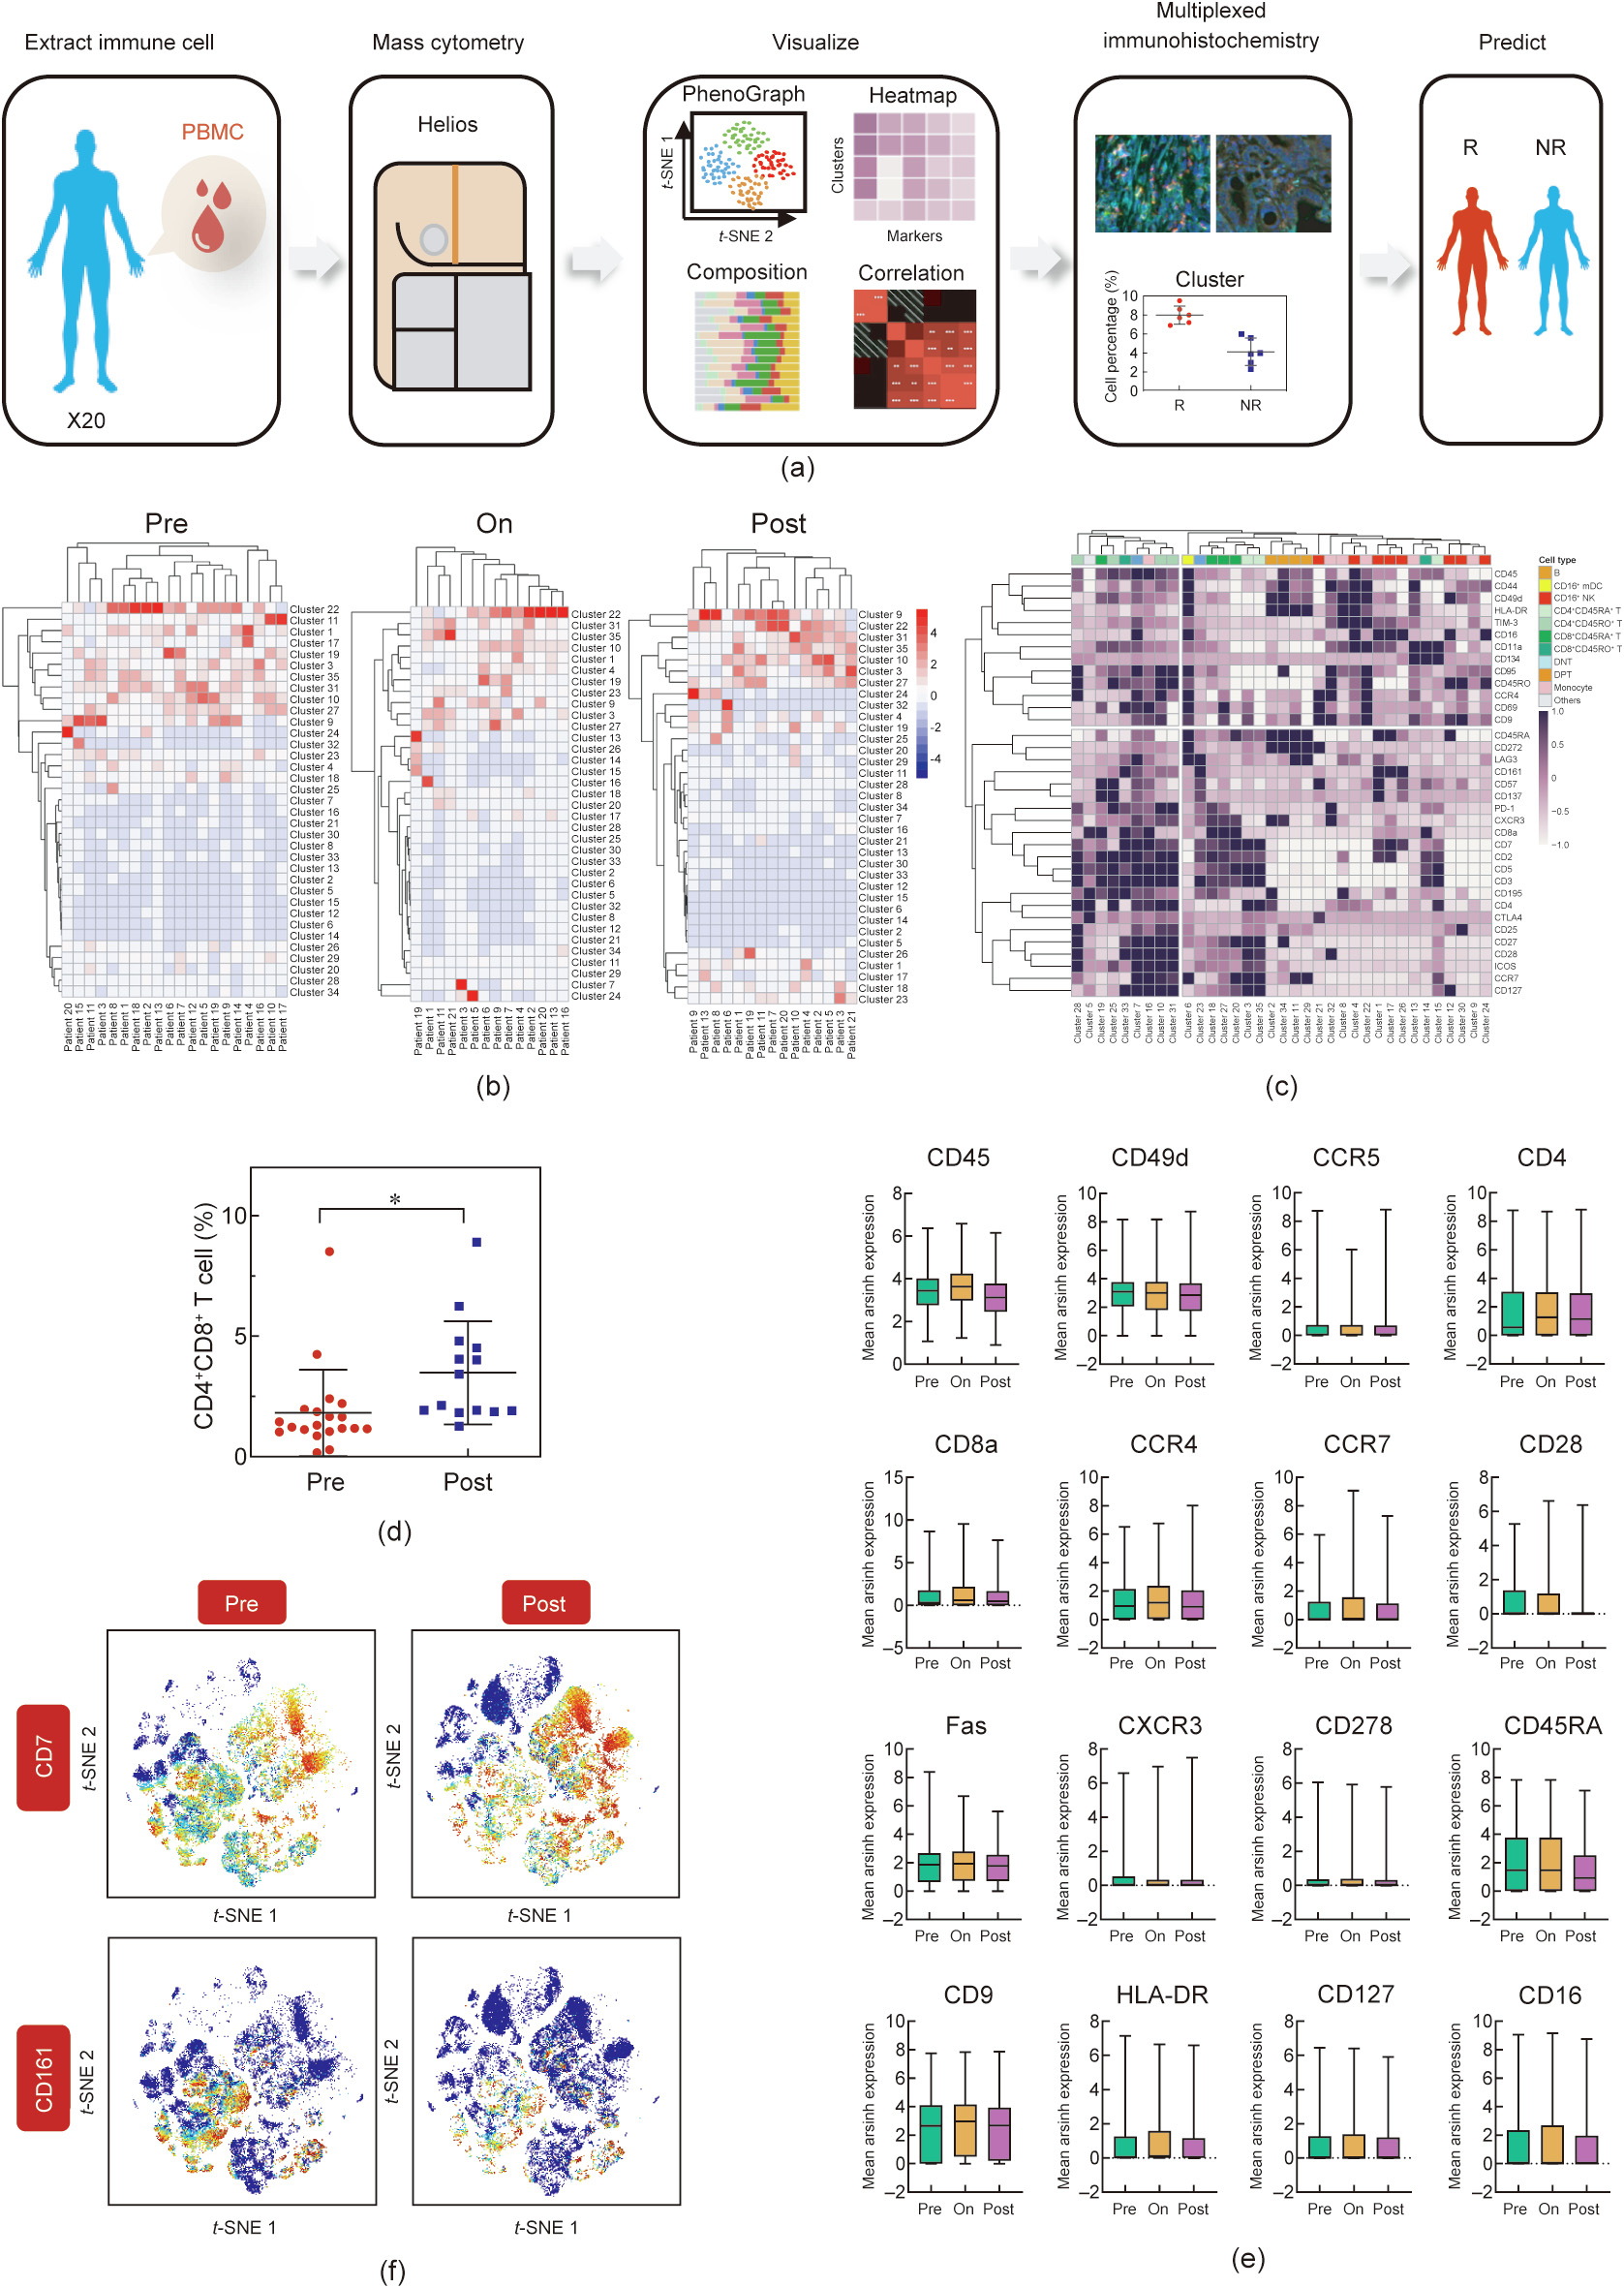
Fig. 1. GEM-combined chemotherapy alters the immune profile of PBMCs. (a) Graphical abstract of the whole workflow. PBMC samples were collected from ICC patients throughout chemotherapy. Extracted immune cells were processed with metal-labeled antibodies and put into CyTOF pipeline. Acquired data was visualized after dimension reduction. Cell clusters were identified by manual gating strategy and clustering algorithm. (b) Heatmaps showed the cell percentage of all 35 clusters in all patients at prechemo, on-chemo, and post-chemo time point. (c) Heatmap (all pre/on/post-chemo samples) showed the mean expression level of all 35 makers in all 35 immune clusters. (d) Cell percentage of DPT was plotted and compared between pre-chemo and post-chemo samples. P < 0.05. (e) Cell percentage of multiple markers (CD45, CD49d, CCR5, CD4, CD8a, CCR4, CCR7, CD28, Fas, CXCR3, CD278, CD45RA, CD9, HLA-DR, CD127, and CD16) in all patients were plotted and compared between pre-chemo, on-chemo, and post-chemo time point. (f) Exemplary t-SNE plots showed expression change of certain surface markers after chemotherapy.
《3.2. Distinct immune profiles of PBMCs were identified in R patients and NR patients before chemotherapy》
3.2. Distinct immune profiles of PBMCs were identified in R patients and NR patients before chemotherapy
To identify potential chemosensitivity prediction factors, in the next step, PBMCs from 20 pre-chemo ICC patients were analyzed using CyTOF, and a random sampling of 5000 CD45+ cells from each sample was collected for further analysis. Using FlowSOM, 30 immune clusters were defined (Fig. 2(a)). Two-dimensional t-SNE plots were used to display the distributions of all 30 identified immune clusters from the PBMCs. Based on the molecular expression, we further regrouped the 30 clusters into classic immune lineages (Fig. 2(a)). T cells, including CD4+ T, CD8+ T, DPT, and DNT, were dominant in the PBMCs, while monocytes, CD16+ NK cells, B cells, CD16+ mDCs, and other groups only occupied a small proportion, respectively. The representative expression patterns of signature genes are shown in Fig. 2(b). The molecular expression characteristics of the 30 immune clusters and different lineages of the PBMCs are shown using a heatmap (Figs. 2(c) and (d)). To further explore the differences in the immune composition of PBMCs in eight R patients and twelve NR patients, we investigated whether there was a significant difference in terms of classic immune lineages between R and NR patients. We plotted the dendrograms of the patients. No significant differences in classic immune lineages were found between the R group (patients 1–8) and NR group (patients 9–20) (Fig. 2(e)). Detailed immune compositions of the 20 patients are displayed in Fig. 2(f). Interestingly, only the CD4+ T cells and CD8+ T cells showed decreasing trends in the NR patients compared with the R patients, while the distribution of the other immune lineages remained relatively similar in the two groups (Fig. S1(a) in Appendix A). Some NR patients with a similar immune composition were grouped together, according to the dendrograms of the patients (Fig. 2(f)). The proportions of the different immune clusters of PBMCs in the R and NR groups are compared in Appendix A Fig. S1(b). Several clusters were observed to be significantly higher in R patients than in NR patients, including CD4+ CD45RO+ CXCR3+ T cells (cluster 3) and CD8+ CD45RO+ CXCR3+ T cells (clusters 6 and 10) (Fig. 2(g)). Collectively, the R and NR patients exhibited different immune landscapes only in terms of T cells. In addition, individuality was an unignorable factor. As shown in Fig. 2(h), the composition of the classic lineages varied greatly among the patients. Unlike the other patients, the percentage of classic immune lineages in patients 11 and 20 was rather small. In most patients, CD4+ T cells and CD8+ T cells accounted for the largest proportion, while the proportion of CD16+ NK cells in the PBMCs of patient 5 was the largest. These results indicated a highly heterogenous inter-patient immune environment in the PBMCs.
《Fig. 2》

Fig. 2. Distinct immune profiles of PBMCs were identified in R patients and NR patients before chemotherapy. (a) t-SNE plots (20 pre-treatment samples) showed that (i) 30 clusters were identified in total lymphocytes via phenograph clustering method and (ii) identified classic immune subsets. (b) t-SNE plots of normalized marker expression from all samples. (c) Heatmap showed the mean expression level of all 35 makers in all 30 immune clusters. (d) Heatmap showed the gating strategy for all classic immune subsets. (e) Heatmap showed the cell percentage of all classic immune subsets in all 20 patients. Scale method: row normalization. (f) Heatmap showed the cell percentage of all 30 clusters in all 20 patients. Scale method: row normalization. (g) Cell percentages of cluster 3/6/10 were plotted and compared between R and NR patients. P < 0.05. (h) Frequencies of classic immune subsets for each ICC sample.
《3.3. Certain T cell clusters in peripheral blood were associated with the response to chemotherapy》
3.3. Certain T cell clusters in peripheral blood were associated with the response to chemotherapy
We next focused on the differences in T cell composition between the R group and the NR group. 5000 T cells were randomly sampled from the patients’ T cell pools collected before, during, and after chemotherapy. We used t-SNE plots to present the distribution of 29 identified T cell clusters from peripheral blood (Fig. 3(a)). Significant differences in the distribution of peripheral blood T cell clusters were found between R patients and NR patients (Fig. 3(b)). Similar to the result in Fig. 1(b), most T cell clusters exhibited a change after chemotherapy in both R group and NR group (Fig. 3(c)). We observed that the CD4+ naive T (Tnaive) cells (clusters 5, 6, and 14) increased after chemotherapy, while the CD4+ central memory T (Tcm) cells (clusters 9, 22, and 26) decreased in both the R and NR patient groups. According to the patients’ dendrograms, the R and NR patients could be separated based on their different T cell immune compositions (Fig. 3(d)). With supervised clustering, it was notable that the combination of clusters 1, 16, and 22 more precisely separated the patients into different groups at the pre-chemo time point (Fig. 3(e)). However, the samples collected from the other two time points could not be well separated (Fig. 3(e)). Clusters 16 and 22 were both identified as CXCR3+ CD45RO+ T cells. Similar to previous findings, both cluster 16 and cluster 22 showed upregulation in R patients at the pre-chemo time point (Fig. 3(f)). However, cluster 22 (CD4+ CXCR3+ CD45RO+ T cells) increased relatively more significantly in R patients at the pre-chemo time point than in NR patients, while cluster 16 (CD8+ CXCR3+ CD45RO+ T cells) showed the opposite trend (Fig. 3(f)).
《Fig. 3》
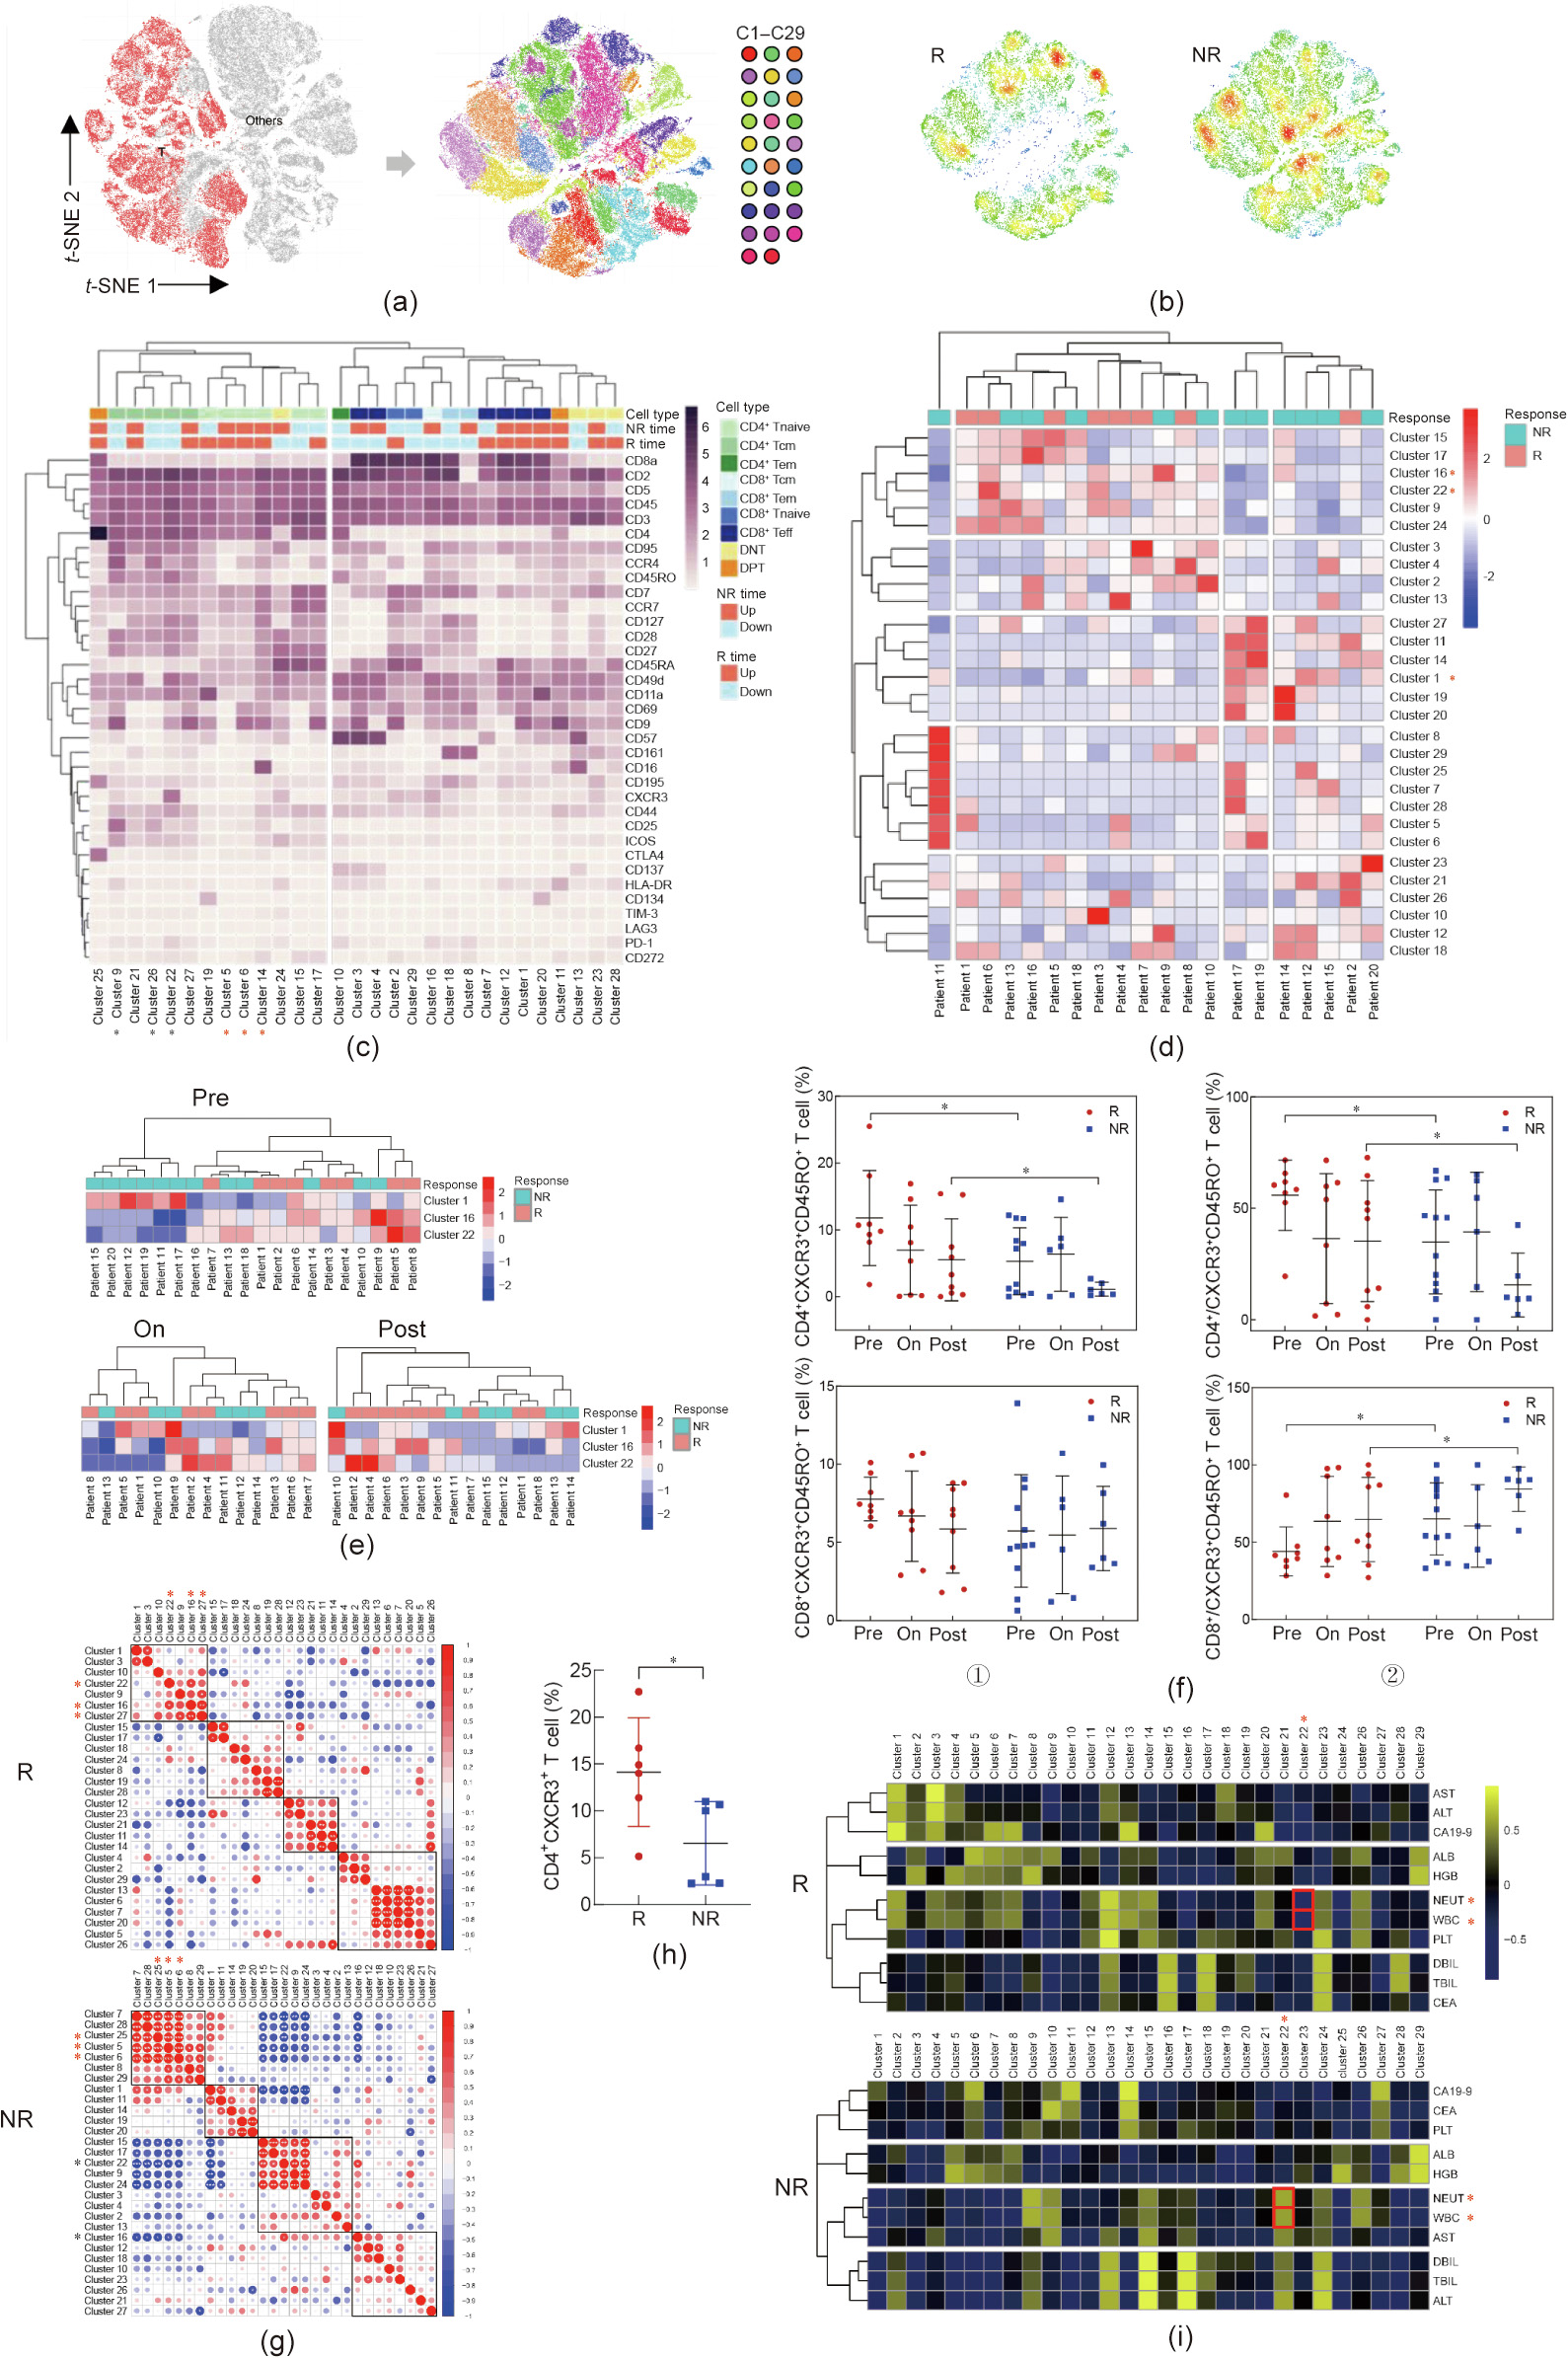
Fig. 3. Certain T cell clusters in peripheral blood were associated with the response to chemotherapy. (a) t-SNE plots (all pre/on/post-chemo samples) showed that 29 clusters were identified in total T cells via phenograph clustering method. (b) Cell density was shown on t-SNE plots of R/NR patients respectively. (c) Heatmap showed the mean expression level of all 35 makers in all 29 immune clusters. Tem: effector memory T cells; Teff: effector T cells. (d) Heatmap showed the cell percentage of all 29 T clusters in all 20 patients (pre-treatment). (e) Heatmap showed the cell percentage of cluster 1/16/22 in all patients at pre/on/post-chemo timepoint. (f) ① Cell percentages of CD4+ CXCR3+ CD45RO+ and CD8+ CXCR3+ CD45RO+ T cells were plotted and compared between R and NR patients at different timepoint; ② the ratio of CD4+ /CXCR3+ CD45RO+ and CD8+ /CXCR3+ CD45RO+ T cells were plotted and compared between R and NR patients at different timepoint. P < 0.05. (g) Cluster abundance correlation showed different pattern in R and NR patients. (h) Cell percentage of CD4+ CXCR3+ T cells of an independent cohort of 12 ICC patients (six cases with good response and six cases with nonresponse). (i) The correlation between cluster abundance and patients’ clinical features were shown in heatmap. AST: aspartate aminotransferase; ALT: alanine aminotransferase; ALB: albumin; HGB: hemoglobin; PLT: platelet; DBIL: direct bilirubin; TBIL: total bilirubin; CEA: carcinoembryonic antigen.
To further clarify the functionality of these clusters, we explored the coexistence and mutual exclusion between different clusters only in the pre-chemo samples. Cluster 27 (CD4+ CD9+ Tcm) was observed to be positively correlated with cluster 16 and cluster 22 in the R group (Fig. 3(g)), with a similar expression profile as cluster 22, except for CXCR3. The coexistence relationship among the clusters in the NR group was different from that in the R group. We found that cluster 25 (CTLA4+ DPT), cluster 5, and cluster 6 (CD45RA+ Tnaive) coexisted, while all these clusters were mutually exclusive with cluster 16 and cluster 22 (Fig. 3(g)). We also extracted other immune lineages including B cells, NK cells, monocytes, and DCs to analyze their compositions. The t-SNE plots and heatmaps of their clusters are shown in Appendix A Figs. S2(a) and (b). However, the patients could not be well grouped in terms of B cell, NK cell, monocyte, or DC clusters (Fig. S2(c) in Appendix A).
An independent cohort of 12 ICC patients (six R and six NR) who were subjected to GEM-based therapy was added (see Table S4 in Appendix A for the patients’ information) in order to further explore the effect of the peripheral blood immune environment on chemosensitivity. We analyzed the percentage of CD4+ CXCR3+ T cells in their PBMCs and validated the finding that patients with a high level of CD4+ CXCR3+ T cells among their PBMCs were more sensitive to GEM-based therapy and exhibited a better clinical outcome (Fig. 3(h)). To explore the clinical indications of CD4+ CXCR3+ T cells, we analyzed the correlation between the size of cluster 22 and multiple clinical indicators at the pre-chemo time point (Fig. 3(i)). Cluster 22 was found to be significantly negatively correlated with systemic inflammation indicators, such as white blood cell (WBC)/neutrophil (NEUT) in R patients, while cluster 22 of the NR patients showed a positive correlation trend with WBC/NEUT (P = 0.0929/0.0754), suggesting that the increase in cluster 22 denoted a restrained systemic inflammation in R patients (Fig. S2(d) in Appendix A). Collectively, our data showed distinct distributions of T cell clusters in the R and NR groups, especially at the pretreatment time point.
《3.4. Activation status of T cells in peripheral blood indicated better response to chemotherapy in ICC patients》
3.4. Activation status of T cells in peripheral blood indicated better response to chemotherapy in ICC patients
To further explore the differences in the T cell molecular expression profile between the R and NR groups, we detected the expression of all 35 markers in the R and NR groups and found that patients could be well separated into R and NR groups based on the expression level of different surface markers (Fig. 4(a)). Next, we performed binary multivariable logistic regression analysis based on the linkage of immune molecules. The receiver operating characteristic (ROC) curve of the model showed the high differentiation power of these 35 immune surface markers for the R group versus NR group (Fig. S3 in Appendix A). The contribution of each marker is shown in Appendix A Table S5. CXCR3, CD45RO, HLA-DR, CD49d, and CD11a were significantly higher in the R group than in the NR group (Fig. 4(b)). The expression of these immune molecules indicated an activation status of the T cells. We found that the combination of CXCR3 and CD45RO could efficiently predict the chemosensitivity of ICC patients (Fig. 4(c)). The co-expression pattern of the T cell surface markers in the R and NR groups are presented in Fig. 4(d). In the R group, the expression of HLA-DR was closely related to PD-1, suggesting a late immune activation state of the T cells. However, in the NR group, PD-1 co-expressed with CD272 (BTLA1), which implied that the state of the T cells was more suppressed than those of the R group.
《Fig. 4》

Fig. 4. Distinct immune surface marker profile in R patients before chemotherapy. (a) Heatmap showed the mean expression level of all 35 makers in all 20 patients (pretreatment). (b) The expression level of several surface makers (CXCR3, CD45RO, PD-1, HLA-DR, CD49d, and CD11a) was compared between R/NR patients. (c) Heatmap showed the mean expression of CD45RO and CXCR3 in all patients at pre/on/post-chemo timepoint. (d) The clustering tree of all 35 surface markers in R/NR patients before chemotherapy.
Clinical information for two patients from each of the two groups was acquired. Imaging data showed that the tumor site of patient 7 (R) shrank significantly after chemotherapy, while that of patient 19 (NR) progressed after chemotherapy (Fig. 5(a)). Patient 7 had a higher cell percentage of CD4+ CXCR3+ CD45RO+ T cells and a lower cell percentage of CD8+ CXCR3+ CD45RO+ T cells than patient 19, especially at the pre-chemo time point (Fig. 5(b)). In addition to CXCR3, we found that other immune molecules, including CD49d, CD11a, and CD45RO, were significantly higher in patient 7 than in patient 19 (Fig. 5(c)). Studies have identified CD11ahighCD8+ T cells as a population containing tumorreactive T cells, and a higher level of CD4+ CD45RO+ /CD4+ T cells was found to be correlated with better OS after chemotherapy [15,16]. We applied the FlowSOM algorithm to analyze our mass cytometry data and obtained 80 clusters. According to the phenotypic similarity between the 80 clusters, we divided them further into 20 metaclusters (Fig. 5(d), Fig. S4 in Appendix A). More metaclusters in patient 7 were CXCR3, CD11a, CD49d, and CD45RO positive compared with those in patient 19, which confirmed that the T cells in the R group patients were more activated and had better responsiveness to chemotherapy (Fig. 5(d), Fig. S4 in Appendix A). Notably, the expression of CXCR3 showed a sustained increase in patient 7 at all time points (Fig. S4 in Appendix A).
《Fig. 5》

Fig. 5. Expression level of immune markers of pre-chemo PBMCs and clinical prognosis of patients in typical cases. (a) Computed tomography (CT) image showed (i) the tumor of patient 7 (from R group) and (ii) the tumor of patient 19 (from NR group) before and after chemotherapy, respectively. (b) (i) The ratio of CD4+ /CXCR3+ CD45RO+ T cells and (ii) the ratio of CD8+ /CXCR3+ CD45RO+ T cells were plotted and compared between patient 7 and patient 19 before chemotherapy, respectively. P < 0.05. (c) Mean expression level of 32 surface markers were plotted and compared between patient 7 and patient 19. P < 0.05. (d) SPADE analysis of extracted lymphocytes from patients 7 and 19. Each circle represents a cell cluster. The expression level of surface markers is color-coded.
《3.5. The level of CXCR3+ T cells in the tumor environment reflects the PBMC condition and holds prognostic value》
3.5. The level of CXCR3+ T cells in the tumor environment reflects the PBMC condition and holds prognostic value
A total of five ICC patients’ biopsies (patients 1, 2, 5, 7, and 11) were acquired for a comparison of the immune profile between the paired tumor tissue and the PBMCs. To assess the number of CD4+ CXCR3+ T cells, we applied multiplex immunofluorescence staining (Fig. 6(a)). Interestingly, we found a positive correlation in terms of T cells between the peripheral blood and the paired tumor tissues. Patient 1 and patient 2, who were from R group had a high level of CD4+ CXCR3+ T cells in their peripheral blood, also had more infiltrated CD4+ CXCR3+ T cells in their ICC tissues, while the peripheral and intra-tumoral CD4+ CXCR3+ T cells of patients 5, 7, and 11, who were from the NR group, were both rare (Figs. 6(a) and (b)). To validate the consistency of the CD4+ CXCR3+ T cells in the PBMC and ICC tumor tissue, 13 paired blood and tumor tissue samples of an independent ICC patient cohort were acquired from the EHBH. The PBMCs/tumor infiltrating lymphocytes (TILs) were isolated from the blood/tumor samples, and the percentage of CD4+ CXCR3+ T cells was calculated. As a result, we confirmed a positive correlation in terms of CD4+ CXCR3+ T cells between the peripheral blood and paired tumor tissues (Fig. 6(c)). The clinical characteristics of these thirteen patients are listed in Appendix A Table S6. Next, we explored whether the level of CD4+ CXCR3+ T cells influenced the clinical prognosis of ICC patients. Kaplan–Meier survival analysis showed that CD4+ CXCR3+ T cell level was positively correlated with overall and relapse-free survival (Fig. 6(d)). Univariate analysis of multiple survival and recurrence-related clinicopathological variables showed that only the CD4+ CXCR3+ T cell level and tumor size were significantly correlated with OS (Table 2). Each parameter was then subjected to multivariate analysis, which indicated that CD4+ CXCR3+ T cell level was an independent and significant factor affecting the survival of ICC patients (Table 2).
《Fig. 6》
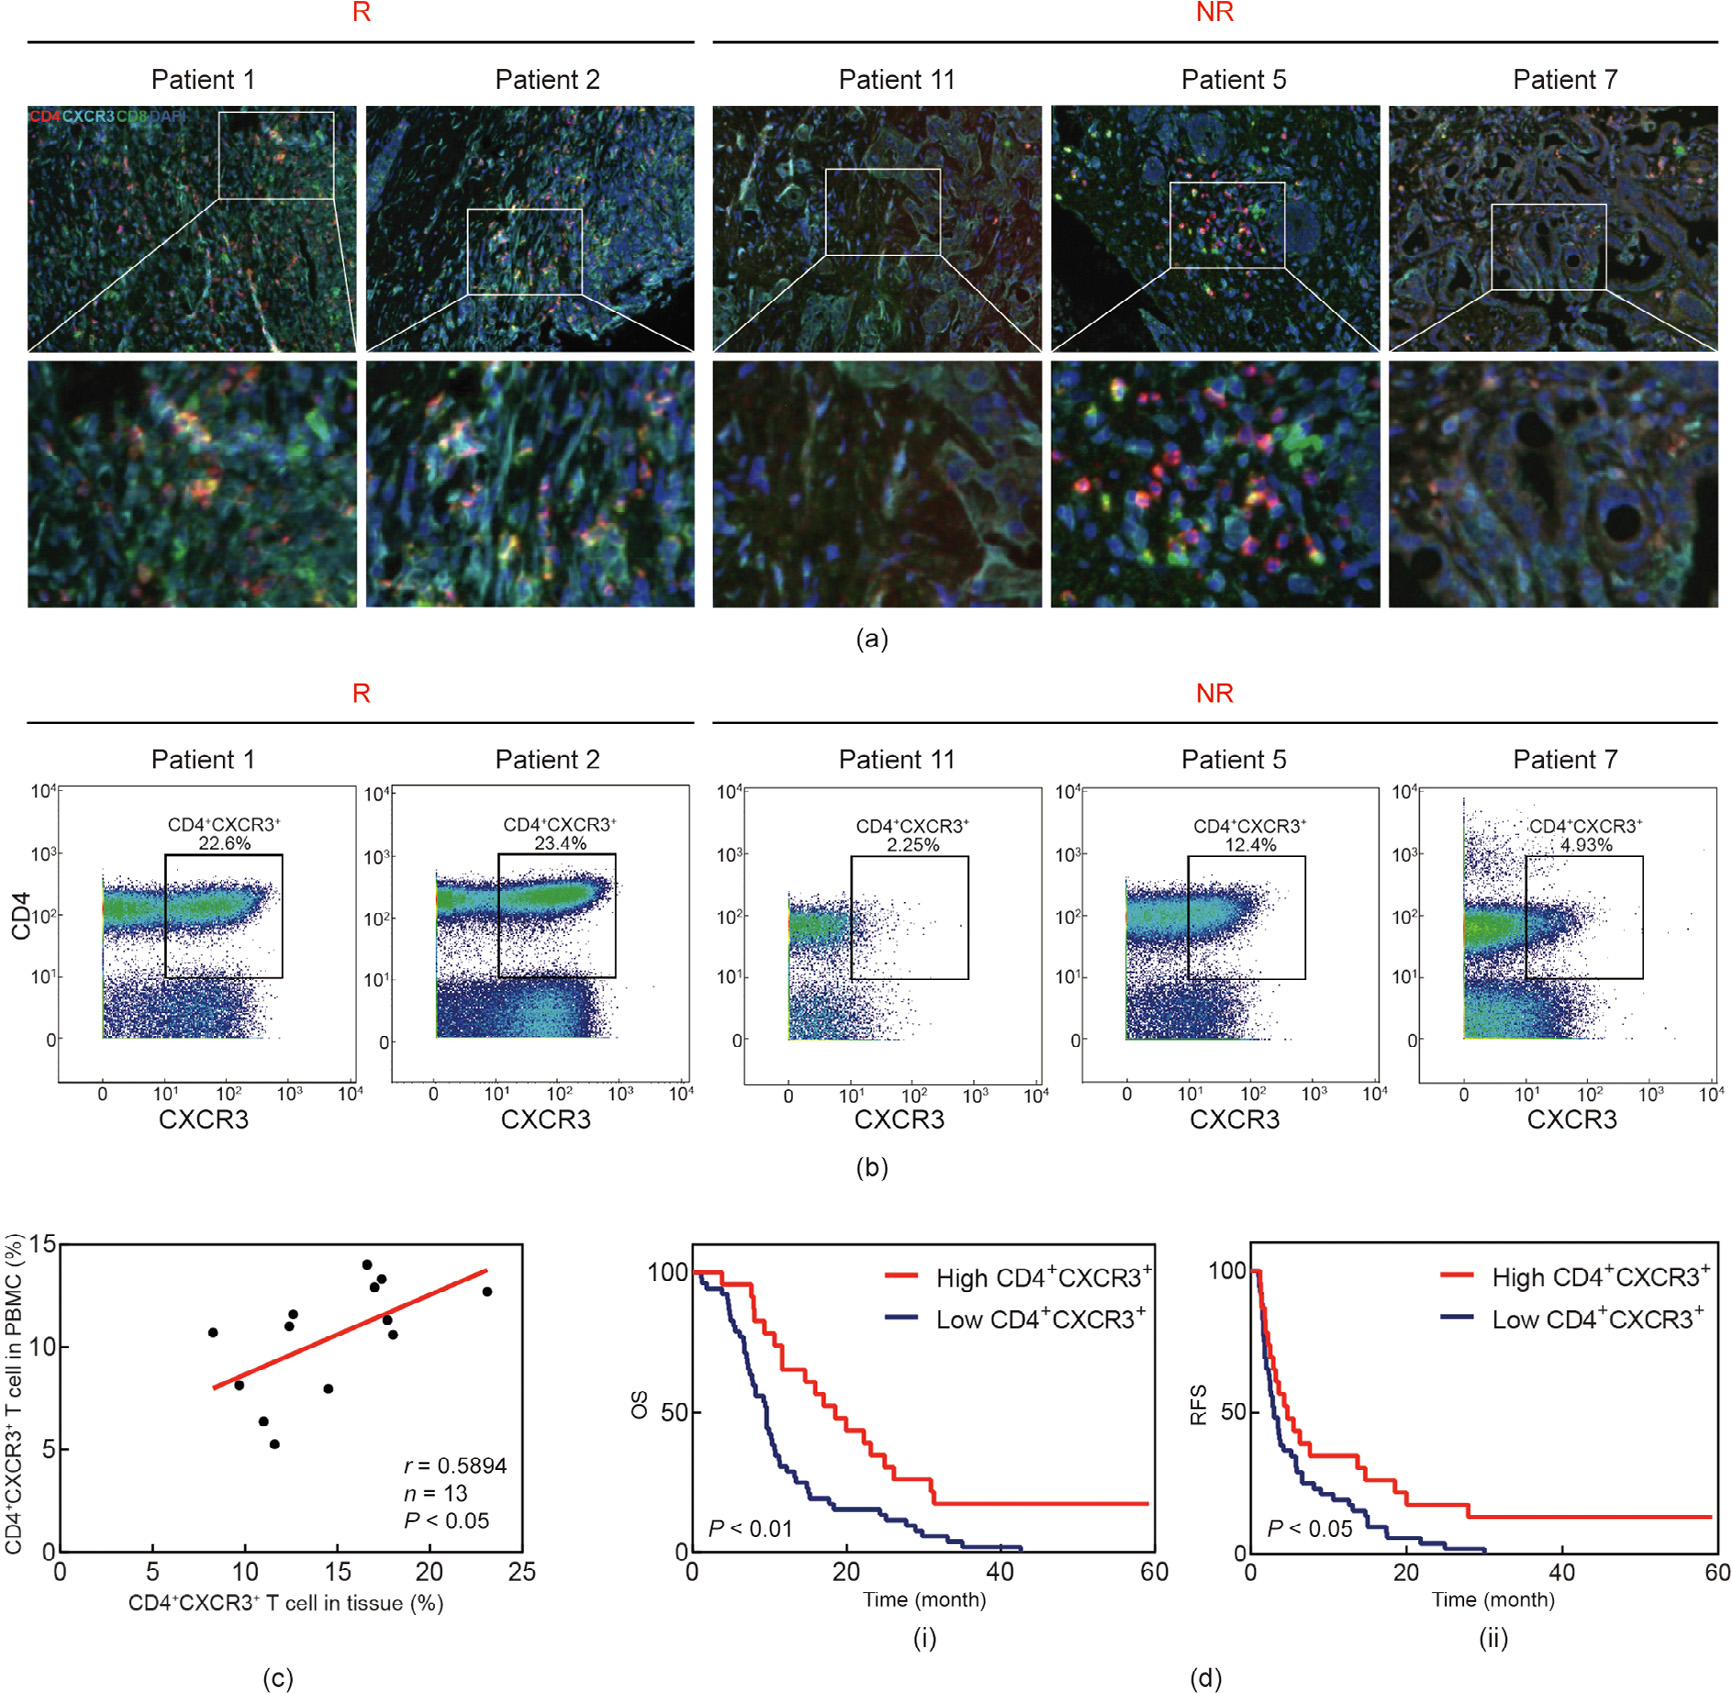
Fig. 6. The level of CXCR3+ T cell in tumor environment reflects PBMC condition and holds prognostic value. (a) Multiplex immunofluorescence staining of CD4+ T cells, CD8+ T cells, and CXCR3+ T cells in ICC tissue microarray. The localization of CD4+ CXCR3+ T cells were analyzed with Halo software using Highplex FL module. Scale bar: 100 μm. (b) Flow plots show cells gated as CD4+ CXCR3+ T cells. (c) Correlation in terms of CD4+ CXCR3+ T cells between peripheral blood and paired tumor tissues. P < 0.05, based on the Pearson correlation test. r: correlation coefficient; n: number of samples. (d) Kaplan–Meier analysis of the correlation between CD4+ CXCR3+ T cells level and OS/RFS. P < 0.05. RFS: recurrence-free survival.
《Table 2》
Table 2 Univariate and multivariate analysis of OS.
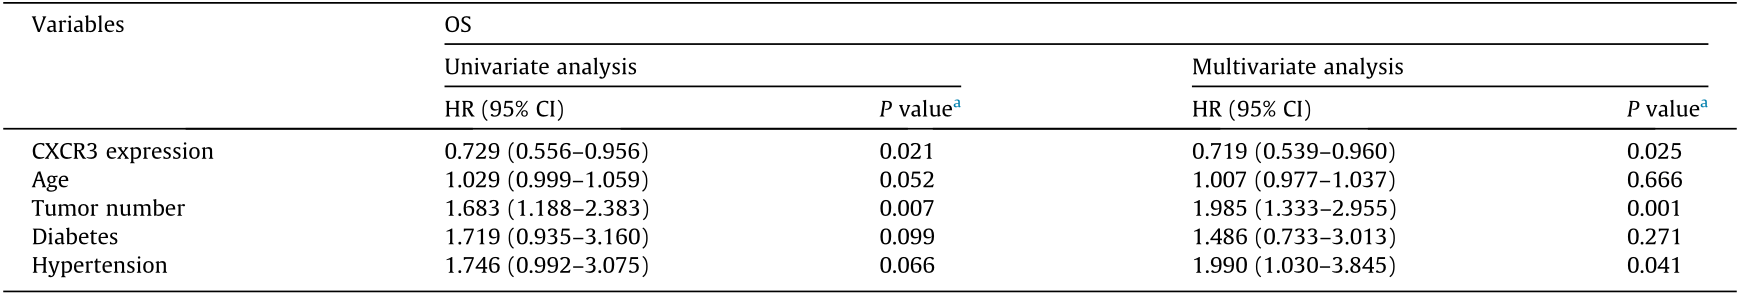
HR: hazard ratio; CI: confidence interval.
a P value indicated the significance of difference in OS under different survival and recurrence-related clinicopathological variables.
《4. Discussion》
4. Discussion
Previous studies have highlighted the role of the tumor microenvironment (TME) in cancer chemotherapy and radiotherapy [5,17–21]. The state of the local immune microenvironment and the systemic immune landscapes of cancer patients before treatment may have an impact on their responses to chemotherapy and radiotherapy. A recent study [5] has pointed out that the systemic immune landscape of pretreatment PBMCs can be used as a predictive biomarker for a sustained therapeutic response to yttrium-90 (Y90)-radioembolisation (RE) in hepatocellular carcinoma (HCC). GEM is a classic chemotherapeutic drug that has been shown to be effective against a variety of tumors, including ICC [6,22–26]. However, the treatment response to GEM-based chemotherapy varies among ICC patients due to individual and tumor heterogeneity [27]. Hence, it is of great importance to identify chemosensitivity predictive biomarkers for ICC patients and accelerate the individualization process of ICC chemotherapy, which would enable clinicians to not only choose therapeutic strategies more precisely, but also cut down on unnecessary medical costs. In this paper, we examined the PBMCs of 20 patients using CyTOF and found that there were significant differences in the systemic immune landscapes of R and NR patients. Patients with a higher level of CD4+ CXCR3+ T cells in their PBMCs were more sensitive to GEM-based chemotherapy. In addition, we found a strong correlation between the abundance of CD4+ CXCR3+ T cells in PBMCs and that in tumor tissues.
Despite the heterogeneity between patients, our research identified some general patterns. Studies have found that GEM, as a common chemotherapeutic drug, has an immunomodulatory function in humans [28,29]. We determined that GEM-based chemotherapy had an immunomodulatory impact on the patients’ systemic immune landscapes. The level of DPT cells and CD7+ CD161+ CD16+ NK cells was increased in the R patients versus the NR patients after chemotherapy, suggesting that effective chemotherapies may activate the patients’ immune system [30,31]. DPT cells have been reported in various pathological conditions, including viral infections, inflammatory diseases, and cancers [32,33]. Robust photodynamic therapy using 5-aminolevulinic acid (ALA)-incorporated nanocomplexes can cure metastatic melanoma by increasing DPT cells [31].
To establish the link between PBMC immune status and patients’ chemosensitivity, we moved on to explore the differences between the R and NR groups at pre-chemo timepoint. Interestingly, we found that the distribution of T cells in peripheral blood of the R patients and NR patients was significantly different, especially in cluster 22 (CD4+ CXCR3+ CD45RO+ T cells) and cluster 16 (CD8+ CXCR3+ CD45RO+ T cells), which were both identified as CXCR3+ CD45RO+ T cells. The interferon gamma  inducible chemokine receptor CXCR3 and its endogenous ligands are mainly involved in inflammation and wound healing [34,35]; they also play an important dual role in the TME. CXCR3 has been discovered on activated T-lymphocytes, and its ligands are reported to have anti-cancer activities [36,37]. The migration of CXCR3+ lymphocytes to the TME is proposed to participate in the anti-tumoral response [38]. The presence and cytotoxicity of CXCR3+ effector memory CD8+ T cells in carcinomas have been shown to increase after chemotherapy [39]. Chemotherapeutic drugs, such as paclitaxel, also reshape the CD4+ T cell distribution within the tumor toward a Th1 (CXCR3+ ) phenotype [40]. However, further study is still required on whether the CXCR3 expression level of T cells in PBMCs and tumor tissues is related to the effect of chemotherapy.
Further analysis of the correlation between immune clusters and clinical indicators indicated that the increase of CD4+ CXCR3+ T cells denoted a better liver condition in the R patients. Increased expression level of CXCR3, CD45RO, HLA-DR, CD49d, and CD11a in the R group suggested that the activation status of the T cells had a positive correlation with a strong response to chemotherapy. Furthermore, the combination of CXCR3 and CD45RO could efficiently predict the chemosensitivity of ICC patients. Our data also tested the number of CD4+ /CD8+ CXCR3+ T cells in ICC patients’ paired resected tumor tissue and PBMCs, providing evidence that the state of the intratumor immune microenvironment was consistent with the PBMCs and was more active in the R group. By performing multiplex immunofluorescence staining, we found that the level of CD4+ CXCR3+ T cells was positively correlated with overall and relapse-free survival.
Recently emerged CyTOF technology is a sensitive measurement method based on inductively coupled plasma mass spectrometry for the deep analysis of single-cell protein expression that is required for precision systems immunology [41]. CyTOF can simultaneously detect more than 40 markers per cell, which eliminates the limitation in terms of the detection parameter number of traditional flow cytometry, making the differentiation of cell types much easier [42]. Using traditional fluorescence-based flow cytometry to perform simultaneous detection of ribonucleic acids (RNAs) and proteins, antigen-specific T cells screening, and chromatin modification profiling is limited by the number of available parameters and complex spectral overlap compensation process [43]. CyTOF creates a breakthrough in dimensionality increment by simultaneously and reliably quantifying up to 45 parameters at present and offering even higher multiplex capability in future applications [42]. In our study, we took advantage of CyTOF to realize the in-depth analysis of PBMCs and to depict the systemic immune landscapes of ICC patients. However, this study still has limitations and constraints. The CyTOF technique is not as sensitive as flow cytometry, the antibody panels of CyTOF need careful design and validation, experienced labor is necessary, and both the instrument and the reagents are expensive [41,44]. These limitations mean that CyTOF cannot be widely applied at present. More improvements are needed to allow more hospitals to gain access to a CyTOF machine for use by clinicians across the globe. To verify the accuracy of our CyTOF results, we examined the molecular expression of PBMCs in the R group and NR group by means of flow cytometry. In addition, our study was restricted by the availability of tumor tissues from the same patients before and after chemotherapy because biopsies were not routinely performed on patients before chemotherapy, and not all the patients went through the whole course of chemotherapy. We mainly focused on T cells in the PBMCs since the peripheral blood of patients was easier to obtain than tumor tissue, and was more convenient for clinical application. However, these problems could be solved if we enrolled more ICC patients undergoing surgical resection combined with GEM chemotherapy in order to further study how CD4+ CXCR3+ T cells infiltrate into the tumor by performing experiments such as immunohistochemistry using sequential sections. There are other limitations on our current study as well. The patients were mainly recruited in one clinic center, and an independent validation cohort for our discovery is necessary, the lack of which could induce an over- or under-estimation of the differentiation power of peripheral CD4+ CXCR3+ T cell number or T cell marker expression for GEM sensitivity in ICC patients. To this end, we plan to conduct our subsequent study on a multi-center level, verify our current finding in a prospective ICC cohort, and analyze the possible biological functions of CD4+ CXCR3+ T cells in cholangiocarcinoma cells. Nevertheless, these obstacles do not compromise our conclusions, which were built from comprehensive, high-dimensional analyses of the T cells in PBMCs at various time points before and after GEM-based chemotherapy.
《5. Conclusion》
5. Conclusion
Taken together, our work not only confirms that chemotherapy drugs affect the immune profile of ICC patients, but also reveals that the immune function of ICC patients directly determines their chemosensitivity. Furthermore, we show that the immune landscape of the PBMCs in ICC patients can reflect the state of systemic immune function, and importantly we have identified potential biological markers to predict the response of chemotherapy. Analyzing the immune context of PBMCs is suggested to be a promising method for guiding treatment choices for ICC patients.
《Acknowledgments》
Acknowledgments
This work was supported by the National Research Program of China (2017YFA0505803 and 2017YFC0908100), the State Key Project for Infectious Diseases (2018ZX10732202-001), National Natural Science Foundation of China (81790633, 81672860, 61922047, 81422032, and 81902412), National Natural Science Foundation of Shanghai, China (17ZR143800), and National Science Foundation for Distinguished Young Scholars of China (81702298). We thank the support of the Shanghai Key Laboratory of Hepato-biliary Tumor Biology and Military Key Laboratory on Signal Transduction. This study is supported by the Innovation Program of Shanghai Municipal Education Commission.
《Authors’ contributions》
Authors’ contributions
Tong Wu, Ying-Cheng Yang, and Bo Zheng contributed equally and developed the concept and discussed experiments. Hong-Yang Wang, Lei Chen, and Zhen-Gang Yuan designed the experiments. Tong Wu conducted the treatment of PBMCs and tumor tissues, carried out all corresponding CyTOF experiments and result analysis, and wrote the original manuscript. YingCheng Yang conducted the collection of PBMCs and tumor tissues of ICC patients and provided the clinical data of all these ICC patients. Bo Zheng performed multiplex immunofluorescence staining experiments and data analysis. Xue-Bing Shi, Wei Li, and Wen-Cong Ma helped to collect ICC tumor samples. Shan Wang, Zhi-Xuan Li, and Yan-Jing Zhu contributed to the bioinformatic analyses. Jian-Min Wu, Kai-Ting Wang, Yan Zhao, and Rui Wu performed statistical analyses of survival in patients. Cheng-Jun Sui, Si-Yun Shen, and Xuan Wu processed patients’ samples and provided technical assistance. Hong-Yang Wang, Zhen-Gang Yuan, and Lei Chen supervised all research phases and revised the manuscript.
《Compliance with ethics guidelines》
Compliance with ethics guidelines
Tong Wu, Ying-Cheng Yang, Bo Zheng, Xue-Bing Shi, Wei Li, Wen-Cong Ma, Shan Wang, Zhi-Xuan Li, Yan-Jing Zhu, Jian-Min Wu, Kai-Ting Wang, Yan Zhao, Rui Wu, Cheng-Jun Sui, Si-Yun Shen, Xuan Wu, Lei Chen, Zhen-Gang Yuan, and Hong-Yang Wang declare that they have no conflict of interest or financial conflicts to disclose.
《Appendix A. Supplementary data》
Appendix A. Supplementary data
Supplementary data to this article can be found online at https://doi.org/10.1016/j.eng.2021.01.014.


 京公网安备 11010502051620号


