
《1. Introduction》
1. Introduction
The scope of neuroscience [1] includes the scientific study of the organization of the nervous system and its function in generating behavior. From a macroscopic perspective, neural systems comprise neurons and circuits that are distributed in a number of discrete anatomical locations in the brain and subserve one of three general functions: sensory, motor, and association. At the nanoscopic scale, the organization of synapse-associated proteins is critical for the stability and function of neuronal processes, such as neuronal transmission. For example, during signal transmission at chemical synapses, the elevation of the presynaptic Ca2+ concentration caused by the arrival of the action potential (AP) (associated with synaptotagmin) leads to neurotransmitter release after the soluble N-ethylmaleimide sensitive factor attachment protein receptor (SNARE) complex has brought the two membranes together [2,3]. An elaborate protein-based cytomatrix plays an important role during the release process. Clathrin is also involved in the endocytic budding of vesicles from the plasma membrane [4].
In addition to protein mobility, protein distribution plays diverse functional roles in neuronal signaling. For example, the information conveyed by synapses in the form of the excitatory postsynaptic current (EPSC) or inhibitory postsynaptic current (IPSC) is integrated and ‘‘read out” at the origin of the axon. Furthermore, the EPSC model reflects the initial size of the readily releasable pool and its replenishment rate from a reserve pool, the probability of synaptic vesicle (SV) release, and synaptic facilitation [5]. An axon has a distinct cytoskeleton containing proteins such as actin and spectrin, along with associated proteins that affect its functional integrity. The membrane-associated periodic skeleton (MPS) potentially influences the generation and propagation of APs and other signaling pathways in axons.
Fluorescence microscopy is the most prevalent imaging technique in the field of biology due to its advantages with respect to molecule-specific labeling using fluorescence tagging and its realtime imaging ability. Owing to the diffraction limit of light, it is impossible to resolve protein mobility and subcellular structures such as synapses at the nanoscale level using conventional light microscopy. In recent years, several forms of fluorescence nanoscopy have emerged that enable imaging at 2–100 times the resolution of conventional fluorescence microscopy [6–16]. Fluorescence nanoscopy offers a powerful new imaging tool with a resolution similar to that of electron microscopy; at the same time, it has certain advantages suited to investigating subcellular structures and biological processes, including live-cell, multicolor, real-time, and three-dimensional (3D) molecular imaging, as well as tracking capabilities [17]. Combined with other cutting-edge techniques, fluorescence nanoscopy provides a route to better understand the function of neurons, neuronal circuits, and, ultimately, neural systems.
In this review, we summarize several fluorescence nanoscopy techniques: structured illumination microscopy (SIM), stimulated emission depletion (STED) microscopy, stochastic optical reconstruction microscopy (STORM)/photoactivatable localization microscopy (PALM), and minimal photon fluxes (MINFLUX) nanoscopy, which incorporates both STED microscopy and STORM. Then, we discuss advanced applications of these techniques from the perspective of molecular and cellular neuroscience. Finally, we conclude by considering the prospects of fluorescence nanoscopy in neuroscience.
《2. Fluorescence and the diffraction limit》
2. Fluorescence and the diffraction limit
《2.1. The principle of fluorescence》
2.1. The principle of fluorescence
A fluorophore is a fluorescent chemical compound that can absorb photons in the ‘‘ground state,” leading to fluorescence emission and vibration relaxation in the ‘‘excited state.” The transition from ground state to excited state occurs very rapidly (over femtoseconds). One of the most useful approaches for understanding the emission and absorption processes is the Jablonski diagram (Fig. 1). The singlet states are caused by the cancellation of the magnetic moments of electrons that have opposite spins within a single state. The triplet states are relatively long-lived. S0 denotes the ground state, with S1 and S2 representing excited singlet states. S2 is a higher energy state than S1, whereas S0 is a lower energy state than S1.
《Fig. 1》
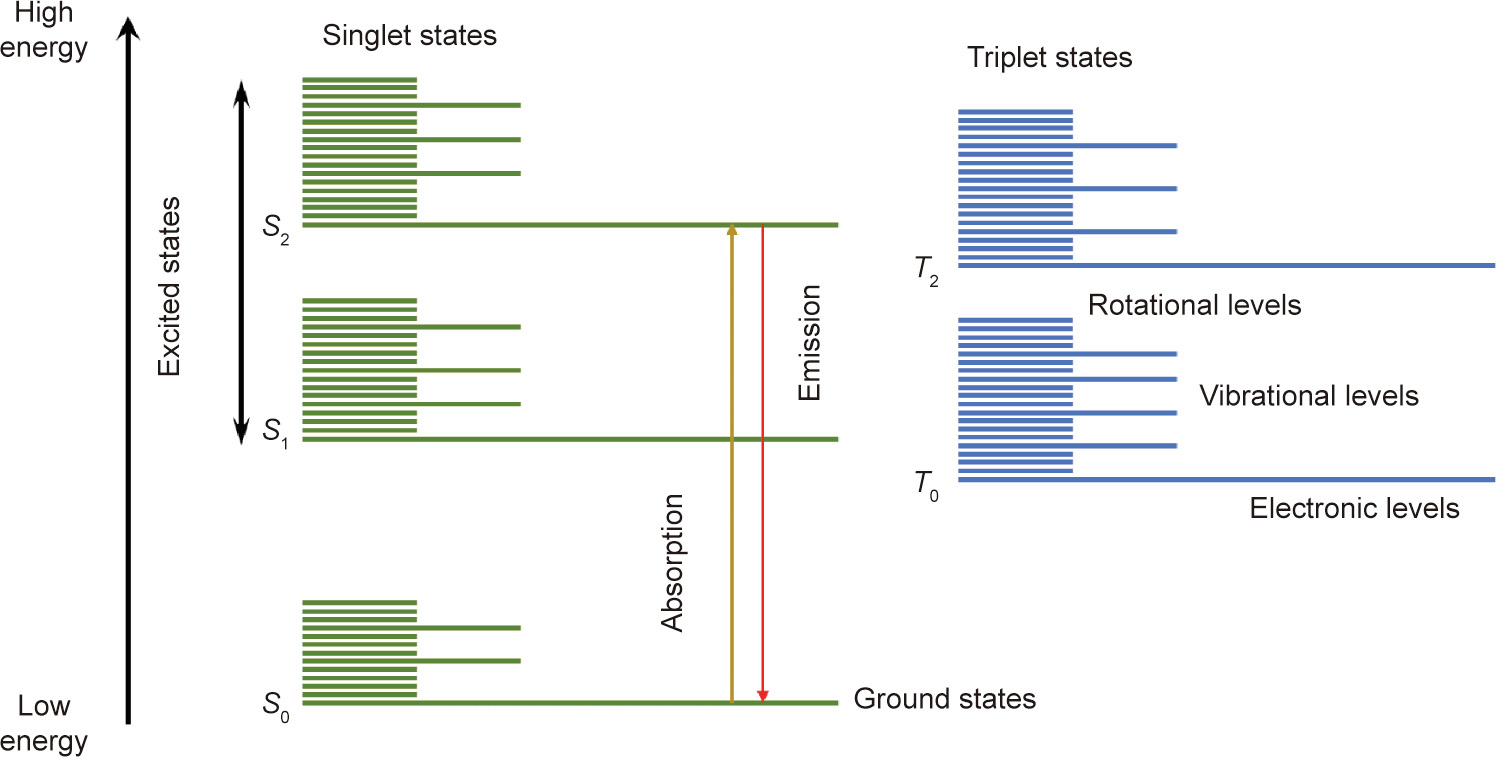
Fig. 1. Jablonski diagram illustrating the energy states within a fluorescence molecule. S0 is the ground state; S1 and S2 are the excited singlet states; T0 and T2 are the triplet states.
Because of the Stokes shift of fluorescence, that is, the redshifted wavelength of the emitted light relative to the absorbed light, the contrast between the signal-to-background ratio in fluorescence microscopy has been improved dramatically [18]. Furthermore, the basic principle of fluorescence microscopy— namely, illuminating the stained sample with the excitation wavelength and detecting its fluorescence signal at a longer emission wavelength—is easy to understand.
《2.2. Impact of the diffraction limit》
2.2. Impact of the diffraction limit
A light microscope can be regarded as a lens system that can be utilized to visualize fine structures in a specimen. As light is a wave that can be diffracted, the 3D point spread function (PSF) produced by a point object has a finite size. Based on constructive interference in space, the full width at half maximum (FWHM) of the PSF is  ≈
≈  /(n × sin2α ) along the optical axis. Here, , α, and n denote the wavelength of light, the aperture angle of the objective, and the refractive index of the immersion medium, respectively;
  is FWHM of the PSF in the lateral directions;
  is FWHM of the PSF in the axial directions. As shown in Fig. 2, when imaging with visible light ( = 632.8 nm) and an oil immersion objective with a numerical aperture (NA) of 1.40 (NA = n × sinα ), the lateral size of the PSF is approximately 226 nm and the axial size of the PSF is approximately 487 nm. The limited diffraction of light results in unresolvable molecular structures, such that the nanoscale fundamental mechanisms in cells remain invisible.
《Fig. 2》
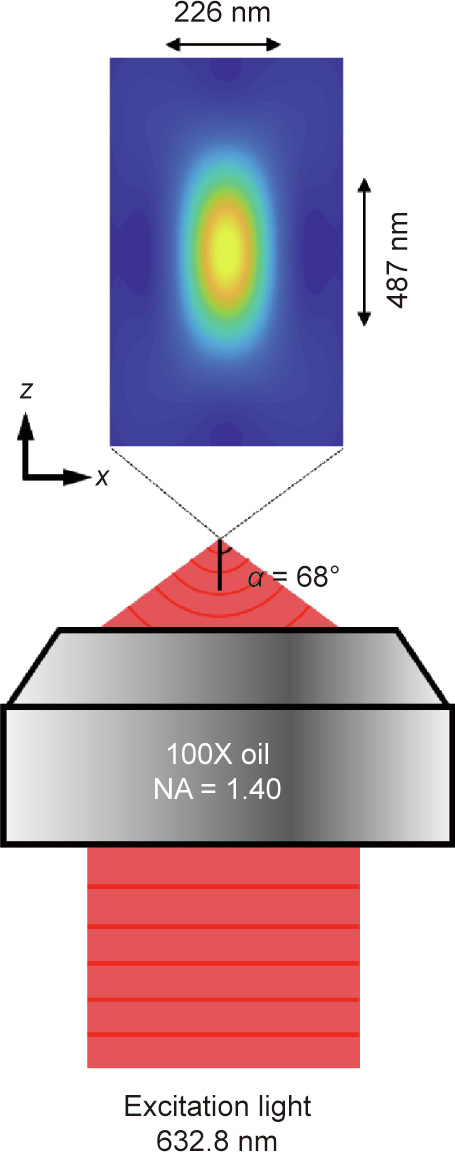
Fig. 2. PSF of an oil immersion objective with NA = 1.40. The excitation wavelength is 632.8 nm. NA: numerical aperture.
《3. Fluorescence nanoscopy techniques》
3. Fluorescence nanoscopy techniques
Since the mid-20th century, several concepts, including confocal fluorescence microscopy [19] and multi-photon microscopy [20], have been introduced to reduce the out-of-focus fluorescence background and the capability of optical sectioning. In principle, confocal fluorescence microscopy improves the spatial resolution by a factor of  compared with conventional fluorescence microscopy. In practice, they are the same because of the finite detector size. Confocal one- and two-photon fluorescence microscopy techniques provide almost identical resolution. By expanding the illumination or detection wavefront, the 4Pi microscope can achieve lateral resolutions between 80 and 150 nm in fixed cells [21]. Based on the Moiré effect, SIM shifts the high-frequency features to low frequencies, which can be detected by the microscope. SIM offers 100–120 nm lateral resolution and about 300 nm axial resolution. However, the resolution remains limited by the diffraction of light.
Regarding fluorophore photophysics and photochemistry, the techniques that have achieved the most remarkable breakthroughs are STED microscopy and STORM/PALM, both of which have broken the diffraction barrier by reading out the molecular fluorescence features of the diffraction zone sequentially. To be specific, reading out markers refers to the signal providing a ‘‘bright state” while keeping other markers in the ‘‘dark state” [22]. Recently, combining the strengths of both techniques, MINFLUX nanoscopy has offered a more powerful and versatile imaging tool for biological studies, achieving resolutions of 1–3 nm in fixed and living cells [16]. Fig. 3 shows the imaging principles of SIM, STED microscopy, STORM/PALM, and MINFLUX nanoscopy. Similar to STORM/PALM, MINFLUX nanoscopy relies on imaging single (or at least identifiable) molecules at a time. In other words, as opposed to MINFLUX nanoscopy and STORM/PALM, STED microscopy principally reads out fluorescence ensembles, relying on reversible transitions between the dark and bright states.
《Fig. 3》
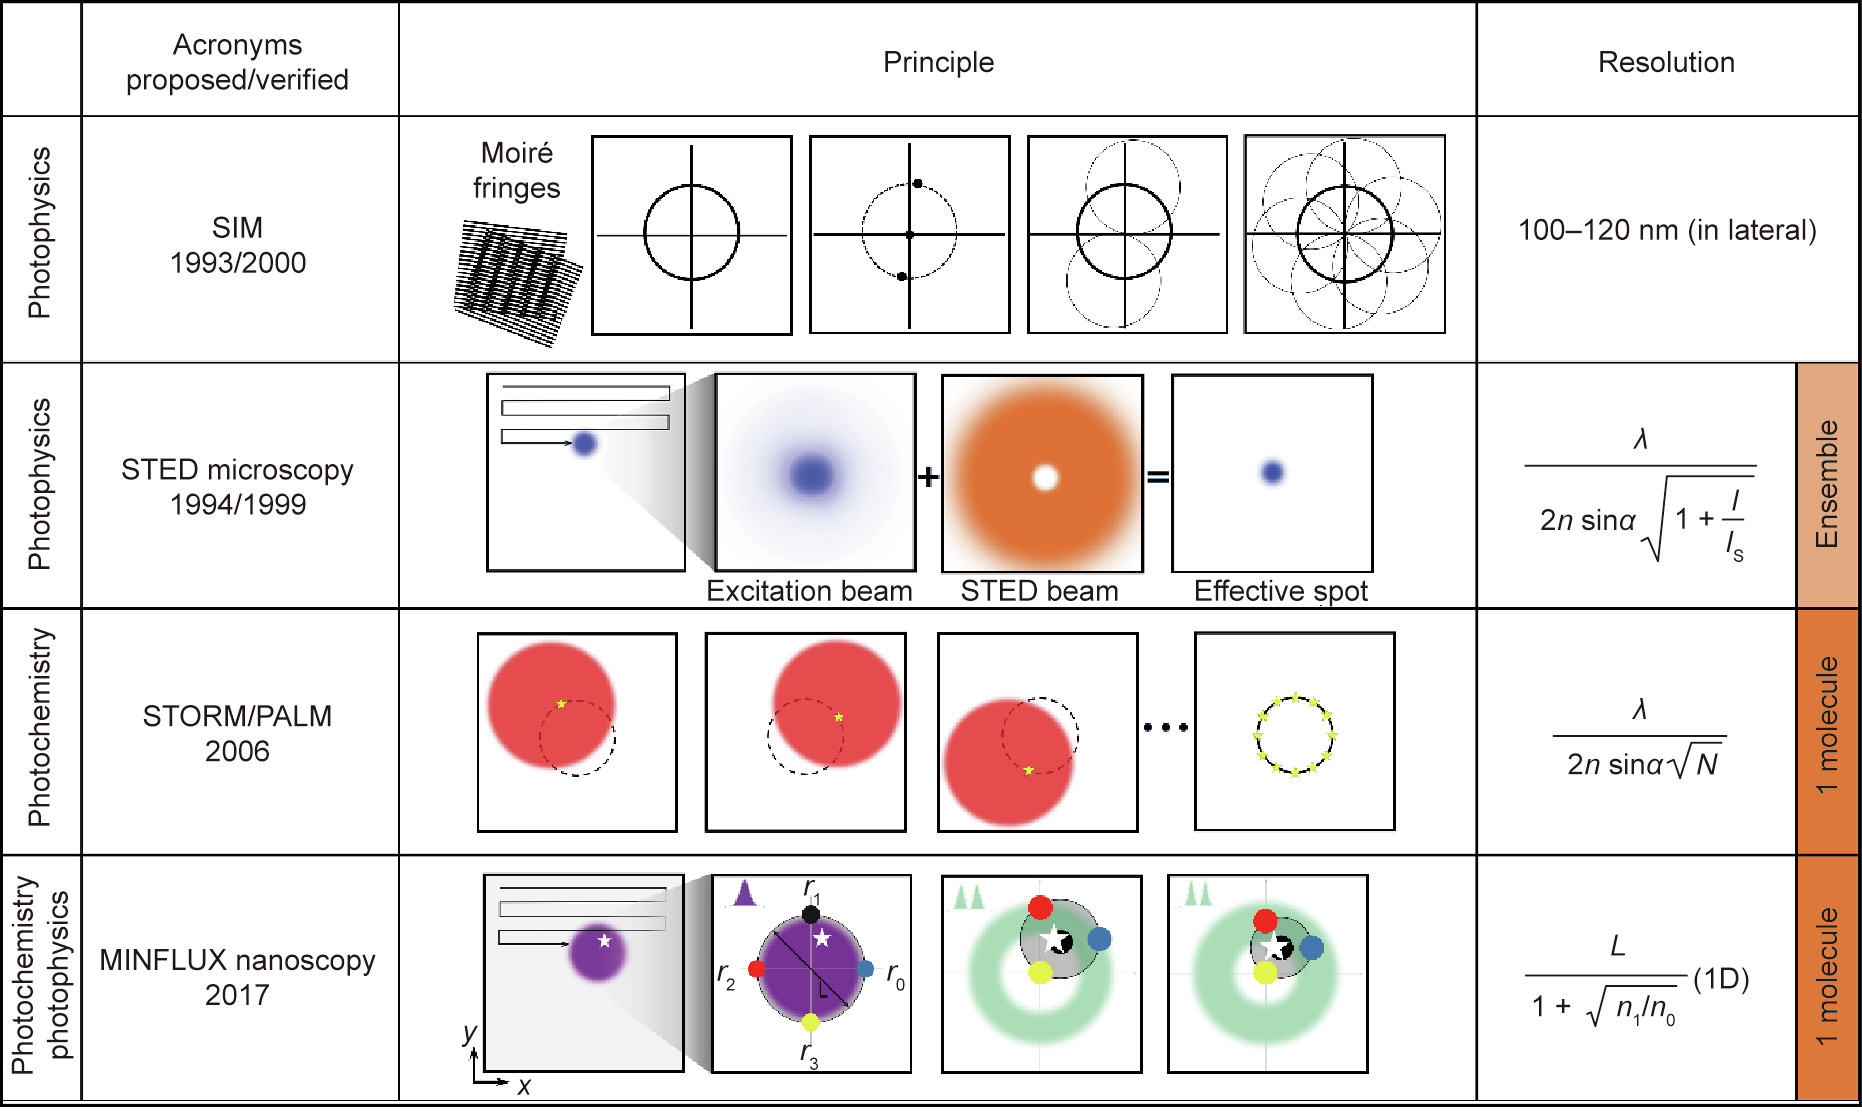
Fig. 3. Working principle and resolution of SIM, STED microscopy, STORM/PALM, and MINFLUX nanoscopy. Using a sinusoidal illumination pattern, SIM can recover information that is twice the size of the normal observation region in the Fourier domain. In other words, SIM obtains twice the normal resolution in the spatial domain (100– 120 nm). A typical single-point scanning STED microscope quenches the excitation beam (blue) using a doughnut-shaped STED beam (orange). PALM and STORM read out individual molecules stochastically. N  1 photons permits the centroid calculation for individual molecules within the diffraction spot. The purple blob represents a diffraction spot that is given the range of the target (the white star). Using an adjustable doughnut-shaped beam, the targeted coordinate pattern comprises four designated coordinates (shown as black, red, yellow, and blue circles). I: the peak intensity of the ‘‘STED beam;” IS: the saturation intensity of the fluorophore; N: the number of photons at the fluorophore position; L: doughnut pattern size; n0 and n1 are the fluorescence photons counted for doughnut position r0 and r1, respectively; 1D: one-dimension; r0, r1, r2, and r3 are doughnut positions, respectively.
《3.1. Structured illumination microscopy》
3.1. Structured illumination microscopy
Using a pattern illumination field, SIM [6] combines optical manipulations and computational algorithms to obtain optical sections and facilitate 3D imaging. In the spatial domain, the observed data D in a linear-invariant optical system can be expressed as a convolution of the emitting object E and the PSF H: D(r) = E(r)  H(r), where r is localization position. By contrast, the convolution can be expressed in the Fourier domain as a pointwise product,
  where O is the optical transfer function (OTF) and k is the spatial frequency. The OTF defines the spatial frequency or observable region that can be detected by the microscope. As shown in Fig. 3 the resolution of a reconstructed image of the emitting object can be improved in both the lateral and axial directions using a sum of periodic illumination patterns with different phases and orientations [7,8].
《3.2. STED microscopy》
3.2. STED microscopy
In the 1990s, the concept of STED microscopy was proposed for propagating light and regular lenses in the far field [9,10]. Using time-sequential patterned illumination, it is the most direct way to determine the coordinates of bright markers. This technique can be regarded as a reversible saturable optically linear fluorescence transition (RESOLFT). In addition to STED microscopy, RESOLFT refers to ground-state depletion microscopy [10]. As shown in Fig. 3, based on the confocal microscopy configuration, fluorescence markers are excited by a focused excitation beam. Within the spontaneous decay of fluorophores, the overlap of the excitation and STED microscopy beams yields sub-diffraction spots. The practical resolution of STED microscopy is 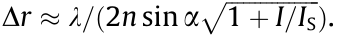 Here, I is the peak intensity of the ‘‘STED beam” and IS is the saturation intensity of the fluorophore. In order to improve the resolution, the intensity of a redshifted doughnut-shaped STED beam produced by a spiral spatial phase modulator or vortex phase plate must satisfy I > IS. In other words, the resolution of STED microscopy is determined solely by the STED beam. By increasing the intensity of the STED beam, the diameter of effective spots is restricted to a lateral resolution of 20 nm. Nonetheless, suitable dyes and adaptive illumination must be adopted in order to avoid photobleaching.
《3.3. STORM/PALM》
3.3. STORM/PALM
In contrast to the chosen coordination in STED microscopy, in STORM [11], PALM [12,13], and points accumulation for imaging in nanoscale topography (PAINT), single fluorescent molecules are read out from random coordinates (Fig. 3). Using wide-field illumination, a single molecule is switched on or activated. The next activated molecule is a distance of  from the former activated molecule. The repeated excitation of molecules forms a magnified diffraction spot on the camera. The image is then assembled molecule by molecule via a dark–bright–dark state mechanism for both switching and non-switching fluorophores. The detected photons enable the localization of the centroid position of the spot and determine the lateral position of the molecules. The optical resolution of STORM/PALM is approximately
 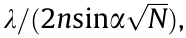 where N is the number of photons at the fluorophore position. It should be mentioned that high-quality STORM images require fluorophores with a high photon yield per switching event, low on–off duty cycle, high survival fraction, and several switching cycles. Among these properties, a low on–off duty cycle leads to the maximum fluorophore density, which equates to achieving the maximum imaging resolution permitted by the Nyquist criterion. However, the activation light does not change the number of detected photons per switching event.
《3.4. MINFLUX nanoscopy》
3.4. MINFLUX nanoscopy
In 2017, a localization concept called MINFLUX nanoscopy was proposed by by Stefan Hell’s laboratory [14–16]. This technique combines patterned illumination with single-molecule features (as in STORM/PALM) to obtain the coordinates of the target molecules (as in STED microscopy). MINFLUX nanoscopy has advanced 3D multicolor molecular imaging and tracking into the hitherto unrealized regime of single-digit nanometer precision and approximately 100 μs time resolution in a scalable field of view (FOV). As shown in Fig. 3, MINFLUX nanoscopy employs a movable excitation beam with an intensity minimum at its center. This minimum serves as a reference coordinate, with the number of emitted photons decreasing as it approaches the fluorophore. Therefore, unlike STED microscopy and STORM/PALM, MINFLUX nanoscopy does not require a large number of photons.
The MINFLUX nanoscopy setup consists of an activation beam that activates fluorophores within the approximately 400 nm activation region and an excitation beam that localizes or tracks the molecules. For each localization, the beam is first focused regularly; then, a modulated two-dimensional (2D) or 3D doughnut pattern, with a gradually shrinking diameter (L), is positioned to localize or track molecules through their maximum-likelihood estimation in either the focal plane (x, y) or the sample volume (x, y, z). In one dimension, the minimum standard deviation of the localization, that is, the Cramer–Rao bound (CRB) within the region L, is 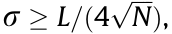 where σ is the localization position;
  is the number of detected photons at different locations (r1 and r0) in the doughnut pattern. Within the activation area, a localization precision of
  nm in one dimension can be expected with only N = 600 photons. Therefore, the iteration precision of MINFLUX nanoscopy surpasses the quantum CRB (QCRB) of the lateral precision for camera-based localization.
Aside from fluorescence nanoscopy, which directly overcomes the diffraction limit of light, expansion microscopy (ExM) can achieve nanoscale 3D imaging, even when using conventional diffraction-limited microscopes, through the physical magnification of tissue and organ specimens [23]. Over the past few years, various ExM protocols have been proposed for the high-resolution imaging of proteins [24] and ribonucleic acids (RNAs) [25], or for application in human clinical specimens [26]. In order to achieve isotropic specimen expansion, biomolecules and/or labels are first mechanically coupled to the polymer mesh. The specimen is then homogenized and expanded. The resolution of ExM can reach the subcellular level with two rounds of expansion using CUBIC-X, which is based on an aqueous chemical solution [27].
《4. Imaging capabilities of fluorescence nanoscopy》
4. Imaging capabilities of fluorescence nanoscopy
In the last few decades, fluorescence nanoscopy has become more suitable for the imaging of subcellular dynamics and structures in three dimensions, multiple colors, and living systems with nanometer-scale resolution. Consider commercial STED as an example: The STED INFINITY (Abberior Instruments, Germany) line can reach a lateral resolution of < (20 nm ×20 nm) and < (70 nm ×70 nm ×70 nm) in two and three dimensions, respectively. Coupled with a 100X objective lens, the FOV is 80 μm ×80 μm. Using Quadscanner (Abberior Instruments), the line frequency can be as high as 2.6 kHz and data collection can reach 4.2 frames per second for 512 pixel× 512 pixel. An imaging depth of up to 100 mm can be achieved inside a complex sample such as Drosophila larvae using adaptive optics. In order to reduce photobleaching and phototoxicity, the STED with Dymin imaging mode simultaneously minimizes the light dose and enhances the signal by an order of magnitude.
The tradeoff between spatial and temporal resolutions is essential in high-resolution imaging techniques, especially in fluorescence nanoscopy. STED can image a relatively small FOV with millisecond temporal resolution [28]. Equipped with fast-switching dyes [29] and fast complementary metal-oxide semiconductor (CMOS) cameras [30], STORM microscope can achieve sub-second time resolution at about 20–30 nm spatial resolution for large FOVs in live-cell imaging. Moreover, photobleaching and/or phototoxicity can be decreased drastically in STED microscope and STORM/PALM. With its low phototoxicity, patterned activation nonlinear SIM (PA NL-SIM) demonstrated livecell imaging with approximately 60 nm spatial resolution and sub-second time resolution over large FOVs with tens of time points [31]. In MINFLUX nanoscopy, ultraprecise 2 nm spatial resolution and 100 kHz temporal resolution can be achieved with its minimal photon budget (i.e., low photobleaching/phototoxicity for fixed and living cells) and scalable FOV [16].
《5. Applications of fluorescence nanoscopy in neuroscience》
5. Applications of fluorescence nanoscopy in neuroscience
Although fluorescence nanoscopy delivers very fine structural information (e.g., a subcellular compartment of densely packed proteins) in the active zone (AZ), the specific physiological properties of different molecular architectures remain a major challenge [32]. Fluorescence nanoscopy is applied primarily to investigate structure (e.g., MPS and function of proteins), especially in the synaptic button (e.g., presynaptic AZ and the postsynaptic density (PSD)). Because of the properties of tissue and light, dynamic, livecell and in vivo deep tissue imaging remain challenging [17]. As STED microscopy offers live cell-tracking features, synaptic fusion during neuron transmission has been revealed dynamically.
《5.1. Spatial organization of proteins in synapses》
5.1. Spatial organization of proteins in synapses
The protein-based cytomatrix at the AZ (CAZ) is crucial for facilitating the SV release process. The Rab subfamily Rab3-interacting molecule (RIM)-binding protein (RBP) is the primer effector of the AZ scaffold. Hence, the RBP family is essential for the coupling of SVs, Ca2+ channels, and the SV fusion machinery in Drosophila. Two-color STED microscopy has demonstrated that the RBPbased cytomatrix has a direct function in controlling the number of readily releasable SVs. As shown in Fig. 4(a) [33], the Drosophila RBP (DRBP) surrounds the central Ca2+ channel field. The DRBP is critical for the integrity of the AZ scaffold and for neurotransmitter release [33]. Moreover, according to direct STORM, the CAZ includes units that contain 137 Bruchpilot (Brp) proteins. The organization of these units relates to various AZ states that correlate to different neurotransmission release probabilities [34].
《Fig. 4》

Fig. 4. Nanoscopic imaging of synaptic protein structures. (a) Left: 3D STED images of the presynaptic AZ containing DRBP, Brp, and the voltage-gated Ca2+ channel cacophony (Cac) at neuromuscular junction synapses in Drosophila. Right: model of an AZ in oblique view. DRBP: Drosophila RBP; Brp: Bruchpilot; GFP: green fluorescent protein; CacGFP: GFP labelled Ca2+ channels; GluRIID: glutamate receptors subunit. (b) 3D STORM images of synapses. (c) MINFLUX nanoscopy imaging of PSD-95 with 3D resolution of 2–3 nm. (i) Sketch of postsynaptic PSD-95. (ii) PSD-95 appearing as clusters distributed on a curved surface. (iii) Individual fluorophores with an isotropic 3D localization precision of 2.0–2.7 nm. PSD-95: postsynaptic density protein 95. (a) Reproduced from Ref. [33] with permission of The American Association for the Advancement of Science, © 2011; (b) reproduced o Ref. [42] with permission of Elsevier, © 2010; (c) reproduced from Ref. [16] with permission of Springer Nature, © 2020.
During neural transmission, SVs fuse within the AZ membrane in response to Ca2+ influxes. In the core fusion complex, there are SNARE proteins, vesicle components, and AZ-specific proteins, all of which help SVs and membranes to dock and fuse. STED microscopy has been implemented to visualize the SNARE protein syntaxin [35], the unclear protein SC35 [36], and the nicotinic acetylcholine receptor [37].
Scaffolding proteins such as postsynaptic density protein 95 (PSD-95) [38], guanylate-kinase-associated protein [39], condensed Shank3 [40], and Homer [41] are major components of PSDs. STORM and PALM imaging have both mapped the spatial organization of proteins in the pre- and post-synaptic terminals, including the orientation of presynaptic scaffolding proteins, the laminar organization of PSDs, and the lateral distributions of neurotransmitter receptors [42–44]. Fig. 4(b) [42] shows the axial and radial 3D STORM images of presynaptic Bassoon (red) and postsynaptic Homer1 (green). It should be noted that PSD-95 plays a crucial role in anchoring and rearranging glutamate receptors in the postsynaptic membrane [38–41,45]. For example, using STED microscopy in combination with endogenous protein labeling, PSD-95 frequently appears in extended distributions rather than as isolated nanoclusters [46]. Recently, MINFLUX nanoscopy has suggested that PSD-95 is distributed along a slightly curved surface with a side length of 100–400 nm, as shown in Fig. 4(c) [16]
《5.2. Cytoskeleton structures of axons》
5.2. Cytoskeleton structures of axons
MPSs in axons were first discovered using STORM [47]. It was observed that short actin filaments capped by actin-capping proteins are organized into repeating ring-like structures as axon bundles. The adjacent actin rings are connected by spectrin tetramers, forming a long-range quasi-one-dimensional periodic structure. This structure is formed underneath the axonal membrane with a periodicity of approximately 180–190 nm. However, researchers using MINFLUX nanoscopy recently found that, at a spatial resolution < 2 nm, the MPS resembles a periodic spiral structure in the axon. In addition, using STED microscopy and STORM, the MPS in dendrites was observed [48,49]. However, the formation propensity and development rate of the MPS in dendrites appears to be lower than those in axons. Moreover, a 2D polygonal lattice structure formed by MPS components was observed in the soma, the dendrites, and the node of Ranvier [48–53]. In other words, the structure of the MPS in neurons requires further elucidation in order to decipher its function in facilitating or assisting the generation and propagation of APs, which remains unclear thus far.
《5.3. Temporal dynamics of vesicle fusion》
5.3. Temporal dynamics of vesicle fusion
It is known that the CAZ provides a functional platform for releasing SVs during neural transmission and communication. However, the principle of vesicle mobility was elusive prior to the invention of STED microscopy, which enabled the movements of SVs in hippocampal neurons to be tracked. The synaptotagmin was labeled with antibodies conjugated to Atto 647N (ATTO-TEC GmbH, Germany), and a final image with a spatial resolution of 62 nm was captured displaying an area of 1.8 μm ×2.5 μm at 28 frames per second [54]. This shows that vesicles continuously bind and then diffuse away from the cellular organelles in a manner similar to the ‘‘stick and diffuse” model. Furthermore, isoSTED microscopy has been used to track vesicles during two cycles of endocytosis and exocytosis, indicating that the same vesicles are used for release in both spontaneous and stimulated neurotransmitter release [55]. However, the underlying mechanism of vesicle trafficking remains unknown. STED microscopy has also resolved synaptotagmin I from individual SVs that form isolated clusters upon vesicle fusion. By labeling synaptotagmin with sheep antimouse Atto 532 dye, STED microscopy realized a higher resolving power for imaging the SVs and their densely packed molecular cargo. Moreover, during fusion, synaptotagmin remains clustered inside the vesicles; that is, it does not diffuse to the plasma membrane after exocytosis [56].
《5.4. 3D nanoscale neuronal imaging》
5.4. 3D nanoscale neuronal imaging
Fluorescence nanoscopy has already paved the way for neural circuit imaging with nanoscale spatial resolution. Using STORM, neuronal structure mapping of retinal ganglion cells has been projected in three dimensions, providing synaptic connectivity at the neural circuit scale [57]. In Fig. 5(a) [57], a retinal ganglion cell (blue), postsynaptic scaffolding protein gephyrin (green), and presynaptic proteins (magenta) were imaged using STORM [57]. Using STED microscopy, the dendritic and axonal structures of enhanced yellow fluorescent protein (eYFP)-labeled neurons from the molecular layer of the somatosensory cortex of a mouse were observed in vivo [58]; the projected volumes of the fine neural structures and the temporal dynamics of spine morphology were revealed with a spatial resolution of 67 nm (Fig. 5(b) [58]). In addition, by combining Bessel beam SIM (BB-SIM) and the tissue-clearing method, the localization and abundance of single messenger RNAs (mRNAs) (single-molecule fluorescence in situ hybridization (smFISH)) can be identified in whole-mount adult Drosophila brains [59].
《Fig. 5》
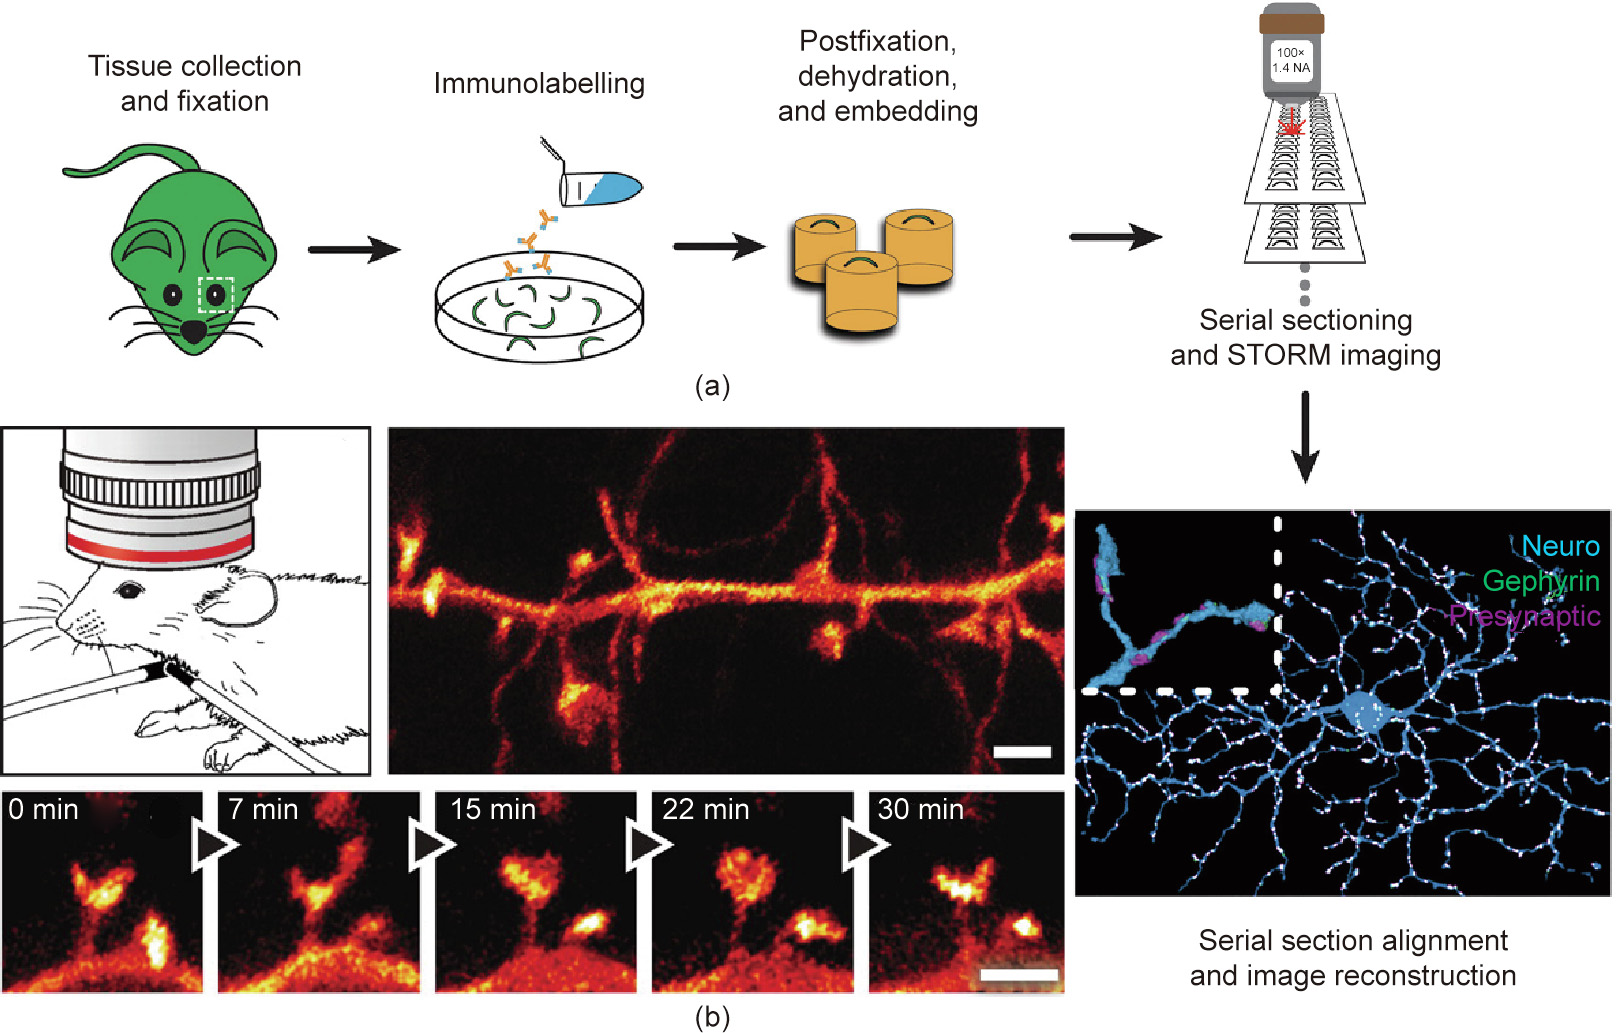
Fig. 5. Nanoscopic imaging of a neuron ex vivo and in vivo. (a) Sample preparation and ex vivo STORM imaging of a retinal ganglion cell. The inset of the final image (lower right) shows the magnified view of a dendrite section. (b) In vivo STED imaging of the somatosensory cortex of a mouse. (a) Reproduced from Ref. [57] with permission of Elsevier, © 2015; (b) reproduced from Ref. [58] with permission of The American Association for the Advancement of Science, © 2012.
《6. Future research directions》
6. Future research directions
《6.1. MINFLUX nanoscopy》
6.1. MINFLUX nanoscopy
Sometimes referred to as the ‘‘post-Nobel” fluorescence nanoscopic technique, MINFLUX nanoscopy has already opened a new avenue of research in understanding the protein structure and function of neurons, in both fixed and living cells [16]. A potential application of MINFLUX nanoscopy is to determine synaptic parameters and visualize synaptic plasticity. Determining synaptic parameters requires quantification modeling during vesicle fusion or neurotransmitter release with nanometer spatial resolution and microsecond temporal resolution. Long-term changes that last for hours or longer provide a physiological substrate for learning and memory, whereas short-term changes that occur in time periods of milliseconds to minutes. MINFLUX nanoscopy provides ultrahigh spatiotemporal resolution and long-term live-cell tracking and imaging abilities that enable precise synaptic parameter modeling and synaptic plasticity visualization with decreased phototoxicity. Furthermore, combined with high-resolution imaging through the physical sample expansion approach (ExM), a multiple-fold increase in the spatial resolution of fluorescence nanoscopy, especially of MINFLUX nanoscopy, can potentially be achieved.
《6.2. Fluorescent bioconjugates》
6.2. Fluorescent bioconjugates
The performance of fluorescence nanoscopy is closely related to the optical characteristics of fluorescent probes [60]. For example, a nanoscopic technique with high spatiotemporal resolution called ‘‘quick single molecule-guided Bayesian localization microscopy (quick-SIMBA)” has been developed using a new photoconvertible fluorescent protein (FP), pcStar, and has been used to discover a specific ‘‘parallel three-pillar” structure of the neuronal-glial cell junction in Drosophila embryos [61]. In addition to endogenic fluorescent probes, that is, FPs, new exogenous probes are being developed to increase image brightness, improve spatial resolution, and enhance the specificity of labeling in fluorescence nanoscopy, including small molecule organic dyes [62], quantum dots [63], aggregation-induced emission nanoparticles [64], polymer dots [65], and up-conversion nanoparticles (UCNPs) [66]. The development of new fluorescent probe bioconjugates with smaller sizes and improved efficiencies has the potential to lead to further advances in the imaging resolution of fluorescence nanoscopy. Furthermore, using the stochastic binding of dye-labeled deoxyribonucleic acid (DNA) probes, DNA-PAINT achieved similar image resolution on DNAorigami nanostructures [67,68]. It is worth mentioning that exchangeable fluorophores have been successfully adopted for use with STED, as STED-PAINT [69].
《6.3. Genomic imaging》
6.3. Genomic imaging
The normal function of a neuron is based on the collective action of many types of molecules. However, the spectral overlap between fluorophores limits the number of molecular species that can be measured simultaneously. Recently developed genomicscale imaging techniques based on multiplexed fluorescence in situ hybridization (FISH) greatly increase the number of molecular species that can be imaged simultaneously with a certain error tolerance. For example, a specially designed multiple-bit binary word can be encoded into the fluorescent probe during the labeling of RNA molecules, which can be probed according to the codebook. Single-cell transcriptome imaging methods have realized the imaging and multiplexing of more than 1000 genes in a single cell via in situ sequencing [70,71] and FISH [72–74]. The combination of these techniques with fluorescence nanoscopy could potentially provide new insights into the structures and functions of neurons at the molecular level.
《6.4. Optical tools and other related imaging techniques》
6.4. Optical tools and other related imaging techniques
6.4.1. Optogenetics
Fluorescence nanoscopy is an important tool for studying the dynamic processes inside and between neurons, which involve the fast and precise control of specific cells in the brain while leaving others unaltered. The precision of electrodes is not high enough, and drugs act much too slowly. Optogenetics is a technology that combines genetic and optical methods to activate or inhibit well-defined events in specific cells of living tissue [75]. However, the penetration depth of visible light is limited by strong scattering by endogenous chromophores [75]. Near-infrared (NIR) light has a deeper penetration depth in biological tissue, but its wavelengths lie outside the optogenetic window. UCNPs can convert low-energy incident NIR photons into high-energy visible emission, and the spectrum can be tuned to accommodate different light-activated channels [76]. Combining fluorescence nanoscopy with UCNP-mediated optogenetics offers exciting possibilities for invasive study of the controlled neuronal activity deep inside the brain.
6.4.2. Direct laser writing of neuron-like structures
Can we print the mind? This is a fascinating question. However, the complexity of the brain is beyond the ability of conventional fabrication techniques. Combined with direct laser writing, fluorescence nanoscopy could boost the development of bionic photonic chips that mimic brain functions more closely. Two-photon direct laser writing has produced 3D biomimetic neuron structures of various topologies with sub-micrometer features [77], and twobeam laser writing can fabricate structures with features as small as 9 nm [78].
6.4.3. Related imaging techniques
The measurement of APs is of significant importance in neuroscience. At present, electrophysiology using patch-clamping is the gold standard for the measurement of individual APs. However, although it has an excellent temporal resolution and a good signalto-noise ratio, the spatial resolution is limited to approximately 10 μm. The photoluminescence of nitrogen-vacancy (NV) centers varies with the magnetic field generated by the propagation of APs in a process called optically detected magnetic resonance (ODMR). This enables high-resolution magnetic field sensing in biological systems under ambient conditions [79,80]. For example, detection of the AP in single neurons and intact organisms has been demonstrated using ODMR [81]. By combining fluorescence nanoscopy with ODMR, APs with the strength changes of synapses could be visualized and measured at nanoscale spatial resolution.
The imaging depth in brain tissue is limited principally by strong light absorption and scattering in the visible range, making it difficult to resolve images from deeper layers in the brain, even in small animals. A direct way to tackle this problem is to access the targeted deep region by inserting a gradient-index (GRIN) lens [82] or fiberscopes [83], or by using a microprism [84]. For example, a vertical cross-section of the tissue can be imaged using a microprism [84]. GRIN lenses have been used to image deep brain tissue, including the hippocampus, hypothalamus, thalamus, and fine structures such as dendritic spines in the CA1 hippocampus [85]. The spatial resolution of these techniques is limited; therefore, incorporating fluorescence nanoscopy could help in realizing all-scale deep-brain imaging.
To improve the penetration depth by reducing light absorption, multi-photon microscopy (MPM) uses excitations of longer wavelengths. The imaging depth of three-photon fluorescence has been shown to be 5–6 effective attenuation lengths below the surface of mouse brain tissue, which is around 130 μm for 755 nm excitation [86]. Furthermore, imaging depths ranging from 1.2–1.6 mm beneath the mouse brain surface have been achieved using twophoton fluorescence with 1280 nm excitations [87,88]. Coherent Raman scattering (CRS), such as stimulated Raman scattering (SRS) and coherent anti-Stokes Raman scattering, is another MPM technique for deep-tissue imaging. SRS has been used to detect and image membrane potential distributions at both the subcellular and multi-neuron scales [89,90] and to image the neurotransmitter acetylcholine at neuromuscular junctions [91]. Although the spatial resolution of CRS is limited by light diffraction, methods based on tip-enhanced CRS [92,93], the suppression or saturation of CRS [94–96], and high-order nonlinear processes [97] have been developed to navigate this problem. Future CRS developments may realize imaging at the nanometer scale and provide information complementary to that of fluorescence nanoscopy.
In addition to light absorption, light scattering is another issue that limits imaging depth, as it introduces aberration into the imaging process. Adaptive optics (AO) uses active devices, such as deformable mirrors and liquid crystal spatial light modulators (SLMs), to compensate for wavefront distortion, which can be measured directly [98] or indirectly [99]. AO has been applied in singlemolecule localization microscopy (e.g., PALM and STORM) [100,101], SIM [102], and STED microscopy [103], resulting in significant improvements in localization accuracy, image sharpness, and brightness. It is anticipated that new research on AO will continue to contribute to advances in fluorescence nanoscopy, including MINFLUX nanoscopy.
The combination of machine learning (ML) and fluorescence nanoscopy offers another research direction. Recently, ML has been applied in optical imaging through scattering media [104], which may be useful for deep-brain imaging. ML has also been used to speed up data processing in STORM [105] and to improve the spatial resolution of imaging [106]. Furthermore, ML can be combined with optically digitalized holography (ODH) to enable the ondemand tailoring of excitation field vectors [107], which could enhance the flexibility of fluorescence nanoscopy. With the development of photonic memristors, in which optical properties change in accordance with the transmitted light [108], it is possible to fabricate dynamic ODH for all-optical neuromorphic computing [109–111] and high-speed nanoscopic imaging.
《7. Conclusions》
7. Conclusions
Having developed at a rapid pace over the last few decades, fluorescence nanoscopy research is expected to spur further advancements in fluorescence probes and labeling methods to achieve ultrahigh resolution imaging, while reducing the required photon budget and the phototoxicity of samples. Unlike conventional microscopy, fluorescence nanoscopy provides a promising means of achieving genomic-scale imaging, which will yield a comprehensive picture of the molecular basis of cellular behaviors and functions. Combined with other optical methods, precise modeling, and the manipulation of neural activity in the deep brain, fluorescence nanoscopy will continue to revolutionize neuroscience. MINFLUX nanoscopy will enable in vivo imaging and the tracking of neural activity to further quantify synaptic parameters with nanometer spatial resolution and microsecond temporal resolution. ML-based fluorescence nanoscopy has the potential to deliver unprecedented application developments in neuroscience. Due to their immense promise, all forms of fluorescence nanoscopy will continue to elucidate the secrets of the brain and contribute to breakthrough developments in artificial intelligence.
《Acknowledgments》
Acknowledgments
Min Gu acknowledges funding support from the Zhangjiang National Innovation Demonstration Zone (ZJ2019-ZD-005). Jian Lin acknowledges funding support from the National Natural Science Foundation of China (11874267). Yangyundou Wang is supported by a fellowship of the China Postdoctoral Science Foundation (2020M671169).
《Compliance with ethics guidelines》
Compliance with ethics guidelines
Yangyundou Wang, Jian Lin, Qiming Zhang, Xi Chen, Haitao Luan, and Min Gu declare that they have no conflict of interest or financial conflicts to disclose.


 京公网安备 11010502051620号


