
《1. Introduction》
1. Introduction
In recent decades, climate change caused by increased greenhouse gas (GHG) emissions has become increasingly prominent, and countries worldwide are cooperating to address this global challenge [1]. The Paris Agreement called for parties to limit the global average temperature increase to well below 2 °C above preindustrial levels and to strive to limit it to 1.5 °C. In addition, countries have committed to achieving a global peak of GHG emissions as soon as possible and to balancing anthropogenic GHG emissions from sources with removals by sinks in the second half of the 21st century [2]. Currently, more than 130 countries have issued or announced their net-zero or carbon neutrality targets. In September 2020, China announced that its carbon emissions would peak by 2030 and that China would become carbon neutral by 2060. Energy-related emissions contribute to the majority of the overall carbon emissions. Energy system transition pathway directly determines the decarbonization trajectory of society. China is the world’s largest carbon emitter and energy consumer, and its energy transition pathway to carbon neutrality has attracted global attention [3].
Carbon neutrality involves many aspects of the energy system, and extensive studies are available on how specific sectors can support carbon neutrality targets. The power sector, which is currently the largest carbon dioxide (CO2) emitter, has new prospects for decarbonization due to the rapidly declining cost of renewable energy [4]. Thermal power operations are bound to be affected by the popularization of renewable energy, and some discussion of coal–biomass co-firing retrofits and orderly retirement has occurred as a result [5–7]. Due to the indispensability of negative emissions, bioenergy with carbon capture and storage (BECCS) technology is gaining attention as one type of negative emission technology. Many studies are focusing on the technical development, resource potential, and environmental impact of BECCS [8– 12]. In addition to the energy supply, decarbonization in the demand sectors is derived from changes in both energy carriers and energy end-use patterns. Aside from industrial upgrading, decarbonization strategies have been proposed for the cement and steel industries [13,14]. With technology and policy incentives, the industry sector could achieve net-zero GHG emissions by 2070 and net-zero CO2 emissions even sooner [15]. For the residential and commercial sectors, net-zero emission and net-zero energy building designs have already been developed; however, the strong promotion of renewable energy and next-generation biomass is another important approach to decarbonizing the building sector [16,17]. Carbon neutrality is challenging to achieve in the transport sector due to the difficulty of reducing emissions in the aviation, maritime, and heavy-duty freight areas [18,19]. However, for road passenger transport, a provincial strategy for achieving net-zero emissions by 2050 has been proposed [20]. Overall, although sector-level studies are more refined, they may overestimate the difficulty of abatement by neglecting collaboration between different sectors.
For a more comprehensive assessment of the impact of the energy transition process, some studies have expanded the boundaries of research to the full range of the energy system [19,21]. Other studies have been conducted that integrate national policies and technological developments, establish top-down emission-reduction targets, and project CO2 emissions under different policy measures [22]. Researchers have assessed the co-benefits of reducing carbon emissions in terms of air quality, energy security, and water savings [23–26]. However, all these studies have followed the previous scenario design of the 2 or 1.5 °C temperature increase control target and have not been oriented toward carbon neutrality goals.
Recently, a handful of carbon-neutral-oriented energy transition studies have emerged. One study used the Model for Energy Supply Systems and Their General Environmental Impact (MESSAGE) to evaluate China’s energy transition pathway to peak emissions and carbon neutrality with a detailed technical description [27]. Other researchers have used a multi-model comparison approach to identify possible decarbonization pathways [28,29]. Nevertheless, these studies do not sufficiently consider the effect of time uncertainty on the pathway. As China’s CO2 emissions are currently at a high level, reaching an early emission peak and then starting to decline will greatly help China in taking the initiative in international cooperation on climate change at a later stage. On the other hand, advancing the carbon neutrality time point, which implies more drastic emission reductions, will also lead to significant changes in the situation.
The time to peak emissions, the time to carbon neutrality, and decarbonization pathways are critical for both transition technology choices and climate change mitigation. Recent studies assessing carbon neutrality targets in different countries note that uncertainties in low-carbon technologies, the potential of BECCS, and public awareness may have significant impacts on the time required to achieve carbon neutrality [21]. Even with the same net-zero time, different pathways cause different temperature increases due to different levels of cumulative emissions [30]. For China, the uncertainty of its emission peak time also profoundly affects the process of its energy system transformation [28].
To bridge the knowledge gap, we use the Integrated MARKAL-EFOM System model of China (China TIMES), an energy–environment–economy model that includes all sectors of the energy system, to assess the impact of the uncertainty regarding the emission peak time and carbon neutrality time. The technology options for decarbonizing the energy system, the costs of the transition, and the synergistic effects on air pollutant reduction under different scenarios for achieving carbon neutrality are elaborated and compared. The aim is to highlight the impact of different emission peak times and carbon neutrality times on China’s energy transition and to identify possible paths to the energy transition in China, while providing insight and a reference for policymakers to develop near- and long-term mitigation strategies to achieve carbon neutrality. We also hope that this study will inspire other countries involved in addressing global climate change.
《2. Methods》
2. Methods
《2.1. The China TIMES model》
2.1. The China TIMES model
The China TIMES model, which is a bottom-up energy system optimization model with a time horizon extending from 2015 to 2050 and a step size of five years, has been applied extensively in research on energy transition and climate change mitigation in China over the past 10 years [31]. The model portrays detailed energy processes, including extraction, conversion, transmission, distribution, and end use. A large variety of technologies and fuels are described in the model for the power, industry, agriculture, building, and transport sectors (Fig. 1). More specifically, it models thermal power for over 40 different technology types and cooling methods, and it considers a wide variety of new energy sources such as wind, solar, hydro, nuclear, ocean, geothermal, and biomass based on the latest cost and resource potential. Thus, the China TIMES model can provide technology-rich policy insights into the expansion of renewable energy capacity and issues pertaining to the decommissioning of thermal power [32,33]. The model includes the entire industry sector; it provides a detailed portrayal of several energy-consuming industries, such as steel [34–36], cement [37], chemical, paper, and nonferrous metals, based on their technological processes, and assesses the contributions of industrial transformation, fuel conversion, energy savings, and emission reductions. Energy consumption and carbon emissions during the operation of buildings are modeled for heating, cooling, cooking and hot water, lighting, and electrical equipment, while taking into account the heterogeneity of energy-use patterns in commercial, urban, and rural areas [38]. The transport sector is modeled independently for freight (heavy-duty trucks, mediumduty trucks, light-duty trucks, vans, air, water, trains, and pipeline) and passenger (urban, rural, and intercity transportation, considering heavy-duty buses, light-duty buses, private cars, trains, airplanes, motorcycles, and subways) transport; furthermore, multiple power sources such as fossil fuels, biofuels, electricity, and hydrogen are considered, yielding very detailed results for the transportation energy transition [39]. Using the projections for gross domestic product (GDP), population, the urbanization rate, and the industrial structure, which constitute socioeconomic drivers, by the International Monetary Fund (IMF) and the World Bank, we estimate the energy service demand for over 40 subsectors by means of the discrete choices method, material flow approach, growth curve model, and Delphi method. The base year of the China TIMES model is 2015, and the data for 2015 and 2020 are calibrated with official statistics. The model uses the CO2 emission factors recommended by the Intergovernmental Panel on Climate Change (IPCC) to measure direct emissions by sector [40]. We update the costs of renewables, energy storage, and carbon capture and storage (CCS) technologies based on the latest available statistics and recalibrate the model to reflect the status and trends of technology development. China’s Nationally Determined Contribution (NDC) targets, as well as its energy- and climate-related policies released before 2020, are considered in this study. The impact of the coronavirus disease 2019 (COVID-19) pandemic on the economy and energy system is likewise considered. The synergistic effect of CO2 abatement on local air pollutant reduction, including SO2, NOx, particulate matter with an aerodynamic diameter no greater than 10 μm (PM10) and 2.5 μm (PM2.5), can also be simulated by this model [41].
《Fig. 1》

Fig. 1. Structure of the China TIMES model. DRI: direct reduced iron; CCS: carbon capture and storage; GDP: gross domestic product.
The energy service demand of each subsector in the China TIMES model is moderated by price elasticities to reflect changes in production modes and consumption patterns under the carbon neutrality target. Considering the potential risk of carbon lock-in, the China TIMES model allows for the early retirement of coal-fired electricity and heat generation units and some carbonintensive industries to meet ambitious emission reduction targets. When these existing technologies are no longer cost-effective, they will be retired before they reach the end of their technological life to make way for other advanced technologies.
《2.2. Scenario design and assumptions》
2.2. Scenario design and assumptions
China’s updated long-term climate target is to achieve peak carbon emissions by 2030 and carbon neutrality by 2060. To explore the implications of differences in the timing of peak emissions and the achievement of net-zero emissions, we designed the following four mitigation scenarios (Table 1).
《Table 1》
Table 1 Scenario design summary.

GtCO2: gigatones of carbon dioxide.
Two groups of scenarios—starting with P25 and P30—represent China reaching peak carbon emissions near 2025 and near 2030, respectively. China’s NDC target requires a carbon emission peak in approximately 2030 and strives for an earlier peak; in addition, the NDC target aims to reduce the CO2 emissions intensity by over 65% in 2030, compared with the 2005 value. In this study, we assume that China reduces its emissions following the existing NDC target before reaching an emission peak in 2025 (P25) or 2030 (P30). After the peak is reached, the energy system will be on a transition pathway to carbon neutrality.
For the other dimension, the scenario names ending in H and L represent our estimates of the emission-reduction efforts needed in 2050 to achieve carbon neutrality in 2060 and 2055, respectively. China has indicated that its carbon neutrality goal covers GHG emissions from all sectors of the economy. The China TIMES model mainly pays attention to energy-related CO2 emissions. The literature on carbon sinks and non-CO2 GHG emissions has shown that China’s forest carbon sinks will be approximately 0.6 gigatones of carbon dioxide (GtCO2) by 2050 and will then slowly decrease, while non-CO2 GHG emissions will be approximately 1.2 GtCO2 equivalent (GtCO2e) and will be difficult to reduce further [19]. Carbon sinks cannot fully offset non-CO2 GHG emissions, and there is still a huge need to deploy carbon dioxide removal (CDR) technologies. However, considering that the remaining CO2 and non-CO2 GHGs are difficult to remove, it is important for CO2 emissions to be net-zero or near-zero by 2050 to ensure net-zero GHG emissions by 2060. For net-zero GHG emissions in 2060 (scenario names ending with H) and 2055 (scenario names ending with L), we set the carbon emissions in 2050 to 1 GtCO2 and 0.5 GtCO2, respectively. By relying on CDR technologies to offset remaining GHG emissions, this study’s setting of CO2 emissions in 2050 has a high probability of meeting China’s carbon neutrality target, and the different CO2 emissions in 2050 show the heterogeneity of the pathways at different carbon neutrality times, assuming the gradual deployment of CDR technologies.
In addition, a set of sensitivity analyses based on a 5% increase or decrease in cumulative emissions for each scenario, with the peak emissions and emissions in 2050 fixed, is performed to further illustrate the significant impact of uncertainty on the timing of China’s carbon emission peak and carbon neutrality.
《3. Results and discussion》
3. Results and discussion
《3.1. Carbon emission reduction pathway》
3.1. Carbon emission reduction pathway
To achieve carbon neutrality, the energy system is expected to experience rapid emission reduction with total discounted energy system cost minimized/welfare maximized assumed for the whole modeling horizon. As shown in Fig. 2, China’s CO2 emissions are currently at a high level and will peak between 2025 and 2030, at a peak level of 10.3–10.4 GtCO2. In 2030, the CO2 emission intensity will decrease by 67% (P30) and 75% (P25), in comparison with the 2005 value, thereby meeting the national NDC commitment. China’s average annual rate of carbon intensity decline from 2005 to 2020 is approximately 4.4%; to achieve carbon neutrality, this rate will need to nearly double to approximately 8.2% over the next 15 years, and then double again to approximately 16% over the 2035–2050 period. In other words, the long-term emission reduction target for 2050 can be passed on to the near term and the medium term. Taking the P25 scenario as an example, we observe that the annual carbon intensity reduction rate under the P25-L scenario is approximately 1% higher than that under the P25-H scenario until 2035. Comparing the P25 and P30 scenarios, we note that, although the peak levels and emissions in 2050 are similar in these two scenarios, the cumulative emissions vary considerably, with P25 reducing emissions by 20 GtCO2 more than P30. Prompt action buys more time for a carbon-neutral transition; otherwise, the costs may be higher, and more challenges may arise. An earlier emission peak time can make mitigation less dramatic: If the emission peak year is 2030, an average annual emissions reduction of 10% will be necessary during the 2030–2040 period. This extremely high reduction rate raises enormous doubts regarding its feasibility. Even if it is achievable, it would require a great deal of effort and would have a greater impact on the economy and society.
《Fig. 2》

Fig. 2. (a) Carbon emission-reduction pathways; (b) cumulative CO2 emissions from 2011 to 2050; (c) sectoral CO2 emissions.
Power sector decarbonization is the core of China’s energy transition. A steep emission decline is expected in the near term. The power sector currently has the largest emissions of all sectors and is expected to peak between 2025 and 2030 at a peak level below 4.5 GtCO2. Once the rapid energy transition begins, the power sector will start to decarbonize over 10 years and will begin to produce negative emissions in 2040. After 2040, with the clean transition of the power sector complete, further emission reductions will rely on negative emission technologies and deep decarbonization on the demand side. By 2050, under the P30-L scenario, there will be almost 1 GtCO2 of negative emissions, and the other scenarios will be below 0.8 GtCO2 due to the slightly higher carbon budget in 2050 (P30-H and P25-H) or earlier emission-reduction measures (P25-H and P25-L).
Emission reductions in the demand sectors lag behind those in the power sector, with the emissions in 2050 having a greater impact on the pathway than the timing of the carbon emission peak. Industry emissions are currently projected to peak at less than 4 GtCO2 and will fall steadily by at least 80% to 0.7 GtCO2 in 2050. Both the transport sector and the building sector peak in approximately 2030, below 1 GtCO2 for the building sector versus 1.4 GtCO2 for the transport sector, and early mitigation actions can reduce these peak levels. In 2050, emissions from the building sector will decline to 0.1–0.2 GtCO2, while those from the transport sector will decline less to 0.7–0.8 GtCO2. Under scenarios that require more emission reductions in 2050 (P25-L and P30-L), the demand sectors—most notably, the transport sector—need contribute more effort.
《3.2. China’s energy transition》
3.2. China’s energy transition
China’s carbon-neutral-oriented energy transition covers three main elements: the promotion of renewable energy in the energy supply sector; energy efficiency improvement and fuel switching in the energy demand sectors; and the extensive use of negative emission technologies.
3.2.1. Clean energy supply
Decarbonization of the energy supply sector is a top priority for China’s energy transition. As shown in Fig. 3, taking the P30 scenarios as an example, we note that China’s primary energy consumption is currently still increasing and is expected to peak in 2030 at 153 EJ, followed by a rapid decline for approximately one decade before leveling off. Early planning (P25) significantly reduces coal consumption by 2030, resulting in an earlier and lower peak. In 2050, both the P25-H and P25-L scenarios reflect a decline in coal consumption of more than 81% relative to the peak, while the P30-L and P30-H scenarios, which have shorter decarbonization times, decline even more—that is, by more than 83%. In terms of energy intensity, the rate of decline in energy intensity averages 3.8% per year until 2020, which is the main reason for the decline in carbon intensity. The rate of decline in energy intensity will then peak near 2035 at nearly 8%, due to the rapid cleanup of the energy supply, and will fall back to approximately 3.7% in 2050.
《Fig. 3》
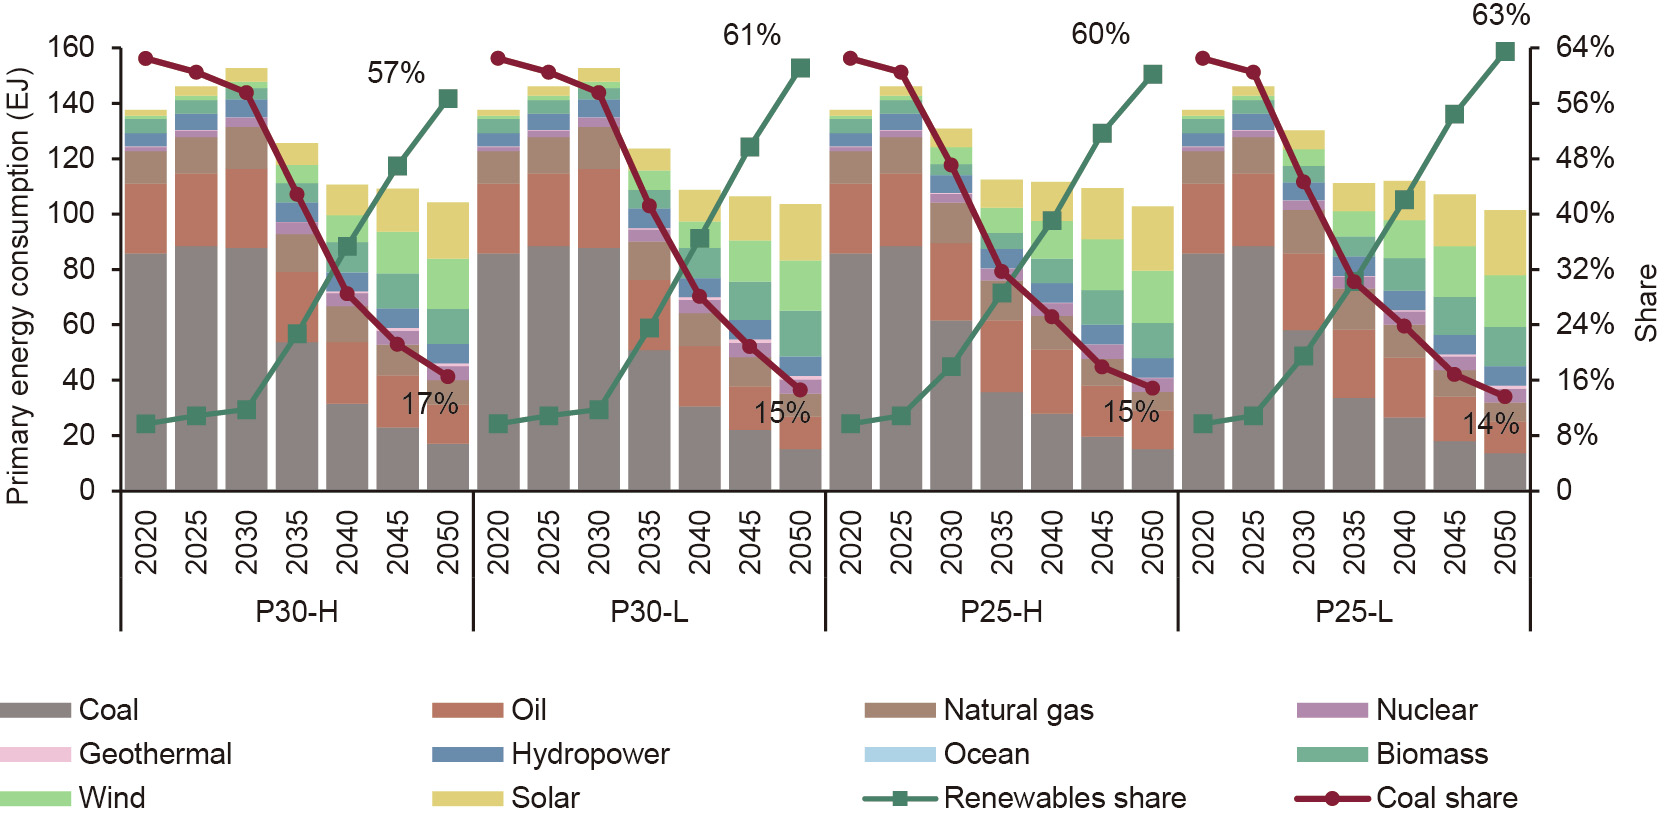
Fig. 3. Primary energy consumption and the share of coal and renewables. Calorific value calculation is applied for the energy statistics in this study.
For the energy mix, the most distinctive feature is the popularization of renewable energy and the phasing out of coal. At present, the share of coal consumption has passed its peak and has begun a slow decline. The start of a rapid decline in coal consumption after 2025 contributes to the peak in primary energy consumption and CO2 emissions. Under the P30 and P25 scenarios, the share of coal consumption decreases to 30% and 25% in 2040, respectively, and to approximately 15% in 2050 for both. From the emission peak year to 2040, the annual reduction in coal consumption is 7.5% under the P25 scenarios and 10% under the P30 scenarios. Tighter restrictions on coal consumption in the near term could significantly reduce the difficulty of decarbonization beyond 2030. Scenarios with tighter carbon budgets in 2050 (P30-L and P25-L) have abatement pressures that are transmitted to the near term and the medium term, leading to even more dramatic reductions in coal consumption.
In comparison, renewable energy currently accounts for 10% of primary energy consumption and is growing slowly, mainly to meet the increasing energy demand. In the future, renewable energy will be the most promising source to fill the gap created by the decline in coal consumption and thus to replace fossil fuels. Between 2035 and 2040, renewable energy will be the dominant energy source in China. In 2050, approximately 60% of China’s primary energy consumption will consist of renewable energy. Similarly, under scenarios with lower carbon emissions in 2050 (P25-L and P30-L) or an earlier start of mitigation (P25-H and P25-L), the proportion of renewables is higher.
The power sector is critical for energy decarbonization, and its future development can be divided into two phases. The first phase is characterized by the change in the power structure, while the second is characterized by the growth in electricity output (Fig. 4).
《Fig. 4》
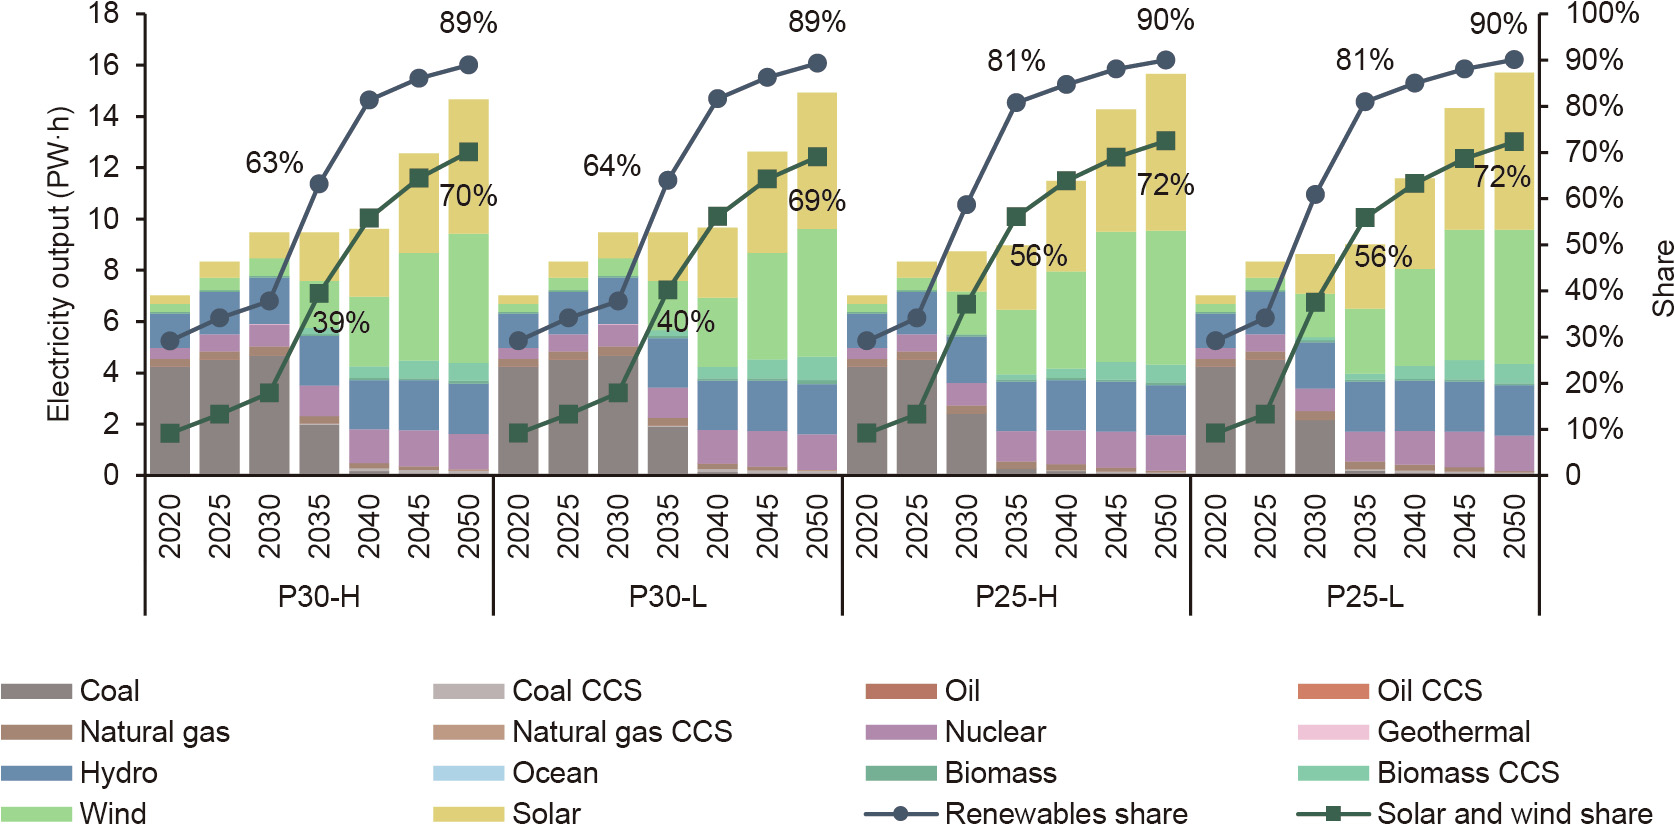
Fig. 4. Electricity output by plant type and the share of renewables and variable renewables (solar and wind).
The electricity mix mainly stems from the phasing out of coalfired power plants and the increase in wind and solar power. It can be expected that coal-fired plants have a 10-year window during which they will be retired, flexibly retrofitted, or converted to biomass–coal co-combustion plants or even BECCS plants. Arguably, the timing of the carbon emission peak depends greatly on the speed of the exit of coal-fired power plants. A comparison of the P25 and P30 scenarios demonstrates the urgency of an orderly retirement of coal-fired power units and the cessation of new coal-fired power plants as soon as reasonably possible. By the time coal-fired power is withdrawn, the proportion of renewables and variable renewables (i.e., wind and solar) in electricity output will reach 81% and 56%, respectively. The total capacity of wind and solar will reach 3.1 TW for P25 in 2035 and 3.4 TW for P30 in 2040. Nuclear power will become an essential part of the power system, with a high penetration of renewable energy in the future, and its capacity will grow more than threefold in the next 20 years.
The subsequent rapid growth in electricity generation will originate from the demand side of electricity substitution. The electricity output in 2050 will climb rapidly to 15–16 PW·h, doubling that in 2020. Wind and solar will still be the mainstays of development during this period, but BECCS units will have been integrated to contribute some electricity. In 2050, the capacity of wind and solar power will increase to 6.3 TW (P30) and 7.1 TW (P25). While a stricter 2050 emission constraint could incentivize an increase in renewable energy installations, the timing of the action is the most significant factor influencing the timeline for power sector decarbonization. Notably, with nearly 200 GW of nuclear units capable of meeting baseload demand in 2050, large-scale grid storage will become a major source of power system reliability. The demand for energy storage in the power system will gradually increase after 2035, with energy storage shifting approximately 10% of the electricity demand in 2035 and the annual energy storage use reaching 2.2 PW·h in 2050.
3.2.2. Clean energy consumption
The three pillars of energy saving and decarbonization in the demand sectors are industrial restructuring, energy efficiency improvement, and fuel switching. The share of secondary industry in the national economy decreases year by year and will be approximately 9% lower in 2050 than it is at present, while that of tertiary industry will increase by approximately 10%. As shown in Fig. 5, China’s total final energy consumption will peak at 125 EJ in 2030 under the P30 scenarios; under the P25 scenarios, it will peak at 119 EJ in 2025 and then slowly decline. Both sets of scenarios show values of approximately 90 EJ in 2050. The electrification rates will continue to increase over the next three decades from now, increasing from the current 23% to 30% by 2035, and then accelerating to nearly 60% by 2050. Technological improvements and the electrification of end-use energy technologies will boost rapid improvements in energy efficiency. In Fig. 6, the size and technological changes in some energy service demands between 2020 and 2050 are shown graphically.
《Fig. 5》

Fig. 5. Final energy consumption by sector and the electrification rate.
《Fig. 6》

Fig. 6. Size and technological changes in some energy service demands between 2020 and 2050. Black dots indicate the percentage increase (decrease) in demand for energy services in 2050 compared with 2020.
Industry, which has been the largest user of energy in the demand sectors, bears the brunt of the energy transition. Its final energy consumption will peak in 2025 and decline rapidly, while still accounting for 50% of China’s final energy consumption in 2050. This reduction in energy consumption will mainly be due to improved energy efficiency. By 2035, the energy consumption per unit of industrial value added will be reduced by half in comparison with the current level; by 2050, it will be further reduced by half in comparison with the 2035 value. The penetration of electricity in the industry sector will gradually increase over time, reaching 56% by 2050 under the P25 scenarios; under the P30 scenarios, it will be 5% lower than under the P25 scenarios. The cement and steel industries are of interest in this context because of their energy and emission intensities. Their production will decline by more than 60% and 70% in 2050, respectively, compared with their current levels. CCS and hydrogen-direct reduced iron (H2-DRI) technologies will help to decarbonize the steel industry, and the cement industry will also achieve an 80% CO2 reduction through CCS. When comparing the different scenarios, we note that there is relatively little use of these high-cost carbon reduction technologies under the early peak and higher 2050 emission scenarios, and there is also a smaller reduction in industrial output.
The total building area in China is approximately 64 billion square meters in 2019 and will continue to increase by 20% by 2050, which will lead to an increase in energy demand. However, due to the decrease in energy consumption per unit area (approximately 15%), the overall growth in energy consumption in the building sector will be modest. The building sector’s final energy consumption will peak at 27–29 EJ in 2030 and will then slightly decline to approximately 26 EJ by 2050. Peaking early can reduce the peak levels, and the 2050 emission target will affect the emissions of the building sector beyond 2040. Regarding electrification, the building sector is the most significant of all demand sectors. At present, the building sector consumes substantial amounts of fossil fuels—especially natural gas, which is under-resourced in China— to provide energy services for heating, cooking, and hot water. In the future, many energy demands will be met by electricity, and the share of fossil fuels will drop to less than 20% by 2050.
China’s transport sector is still undergoing rapid expansion, with a current private car ownership value of 174 cars per 1000 people but an expected value of approximately 400 cars per 1000 people by 2050 [19]. The stock of trucks will also increase by more than 20%. Moreover, the rapid growth in aviation demand will cause more serious challenges in the transport sector, and it is expected that aviation demand will increase by 150% in 2050 compared with the current value. The final energy consumption of the transport sector will not peak until 2030, and the energy consumption in 2050 will be similar to the current energy consumption. The eventual decline in energy consumption in the face of significant growth in usage will primarily stem from the fact that electric and hydrogen fuel cell vehicles are far more efficient than current internal combustion engine vehicles. More than 70% of light-duty vehicles and 90% of buses will be electrically powered by 2050, with most of the remaining internal combustion engine vehicles from the previous stock being scrapped before carbon neutrality is achieved. There are some barriers to the high penetration of electricity in heavy-duty trucks, and the decarbonization of freight transport will mainly rely on hydrogen. However, given the prohibitive cost of hydrogen production, hydrogen energy will rapidly replace fossil fuels only when there is strong pressure to decarbonize. For example, under the P30-L and P25-L scenarios, the share of hydrogen will reach more than 50% in 2050 compared with approximately 33% under the other two scenarios.
3.2.3. The necessity of bioenergy and CCS technology
It is well known that bioenergy is a sustainable, zero-carbon, clean energy source, and that CCS technology can capture the CO2 produced by the power, industry, and upstream sectors and store it for a long time. Both bioenergy and CCS technology are difficult to develop due to their high acquisition costs and low public awareness. As negative emission technologies are essential for achieving carbon neutrality, BECCS—a combination of zerocarbon bioenergy and CCS technology—is a promising negative emission solution. To achieve carbon neutrality, BECCS is expected to flourish after 2035, when low-cost decarbonization options will have been largely exhausted, to offset the remaining difficult-toaddress emissions.
As shown in Fig. 7, mass construction of BECCS technologies will start in 2035, and will generate 233–292 Mt of negative emissions. Negative emissions are projected to double to 426–574 Mt in 2040 and to reach approximately 800 Mt in 2050. The P30-L and P25-L scenarios involve more stringent carbon budgets, and BECCS is predicted to be further developed to capture 1031 and 873 MtCO2, respectively, in 2050. Meanwhile, biomass usage will continue to decline until the large-scale development of BECCS, primarily due to a decrease in the direct combustion of traditional biomass in rural areas. Among all biomass sources, agricultural and forestry residues, animal manure, and municipal waste will be utilized first. After 2040, marginal land will need to be used to grow energy crops to provide sufficient biomass resources. In 2050, 70% of biomass will be used for BECCS; in contrast, direct biomass combustion in the residential sector will almost completely disappear.
《Fig. 7》

Fig. 7. (a) CO2 captured by several types of CCS technology and (b) biomass usage.
Except for BECCS, after 2035, some of the existing coal-fired electricity and heat generation plants will start to carry out retrofitting of CCS units, which can reduce carbon lock-in, avoid transition risks, and reduce stranding assets. Under the P30 scenarios, a considerable number of coal-fired power plants are likely to come into operation in the next decade, and the amount of CO2 captured from them will be approximately 400 Mt in 2050, which is 100 Mt more than the value in the P25 scenarios. The CCS applied in the industry sector will be used to address carbon emissions from steel, cement, and ammonia production, capturing 299–405 MtCO2 in 2050.
《3.3. Energy transition costs and benefits》
3.3. Energy transition costs and benefits
3.3.1. Marginal abatement cost and welfare loss
The carbon neutrality target places unprecedented transition pressure on national development. The marginal abatement cost (MAC)—that is, the shadow price of CO2 in the optimization model—can synthesize the transition cost and the impacts on society as a whole (Fig. 8). In 2030, the P25 and P30 scenarios differ significantly due to different mitigation schedules. The smooth rise in the MAC under all scenarios after 2030 reflects the increasing pressure to reduce emissions as the abatement rate rises. Emissions in 2050 will have a global impact on the MAC over the entire period, with the MAC under the P30-L and P25-L scenarios being higher than that under the P30-H and P25-H scenarios. An earlier peak will help reduce the MAC by 31% (P30) and 40% (P25), suggesting long-term benefits from implementing actions sooner.
《Fig. 8》
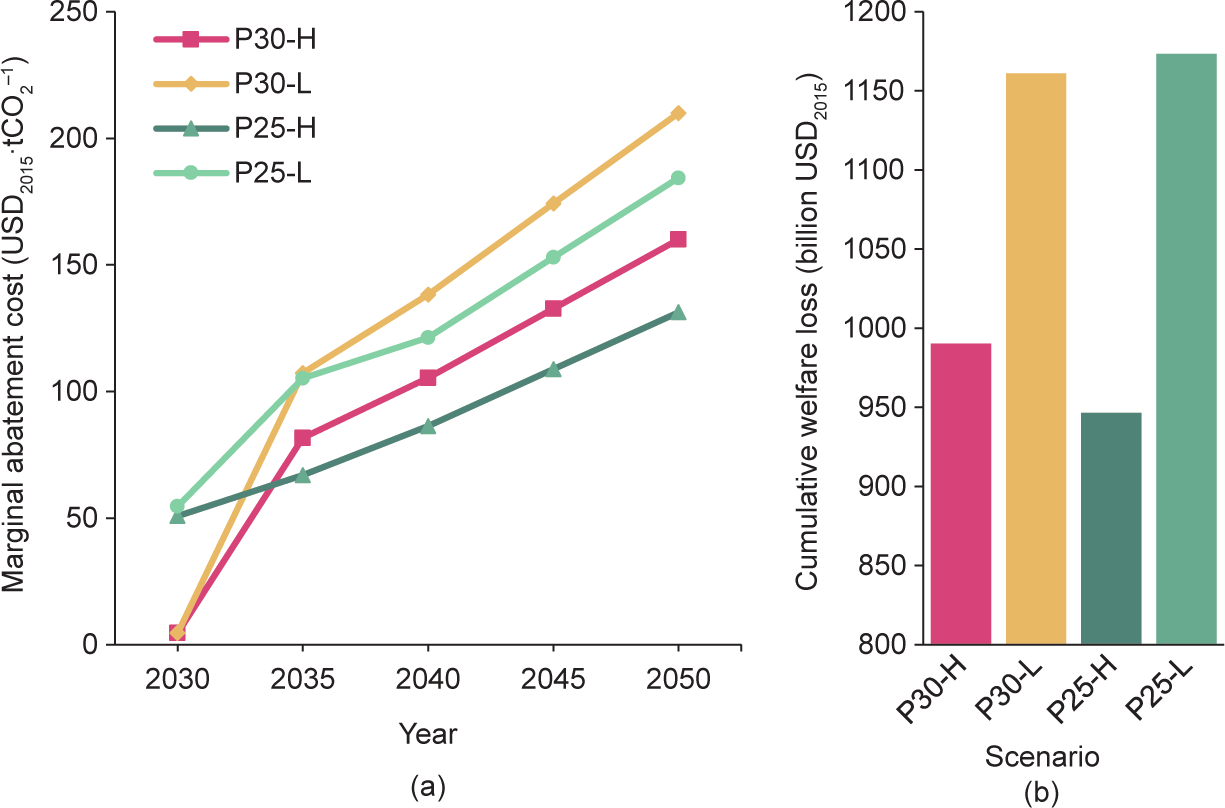
Fig. 8. (a) The marginal abatement cost between 2030 and 2050 and (b) the cumulative welfare loss from 2020 to 2050. USD2015 denotes that data are in constant 2015 US dollars and dollar figures are converted from domestic currency using 2015 official exchange rates.
Under the P30 scenarios, meeting the NDC target in 2030 will require little effort (5 USD per tonnes CO2 (tCO2) but will be far from achieving carbon neutrality. The MAC will increase to over 100 USD·tCO2–1 in 2040 under P30-H and in 2035 under P30-L. Under the P30-L scenario, the MAC will further increase to more than 200 USD·tCO2–1 in 2050. In contrast, the P25 scenario will already be on a rapid reduction pathway in 2030, with a MAC of approximately 50 USD·tCO2–1 . Similar to P30-L, P25-L will reach a MAC of 100 USD·tCO2–1 in 2035, but the subsequent growth will be slower, with a MAC of 184 USD·tCO2–1 in 2050. P25-H has the lowest transition pressure, with the MAC not exceeding 100 USD·tCO2–1 until 2045 and reaching 131 USD·tCO2–1 in 2050.
Welfare loss is another metric used to measure the transition cost. Unlike the MAC, which focuses on the difficulty of reducing emissions, welfare losses measure the impact on consumers and producers caused by mitigation. Fig. 8(b) shows that, over the 2020– 2050 period, the welfare loss under the carbon-neutral scenario is 947 billion–1173 billion USD relative to the baseline scenario of meeting the NDC target. Scenarios with lower emissions in 2050 (P25-L and P30-L) will have a welfare loss that is 17%–24% higher than that under the other scenarios, while the emission peak time will have a relatively small impact on the energy service demand.
3.3.2. Energy supply investment
China’s clean energy investments provide a solid foundation for a low-carbon transition. To achieve China’s carbon neutrality goal, it is necessary to significantly scale up low-carbon investments and continuously improve the green investment mix. As shown in Fig. 9, approximately 6 trillion USD of power investment is needed between now and 2050 to support the low-carbon transition of the power system, with renewables accounting for approximately 90%. In general, different carbon neutrality times have an insignificant impact on total investment in the power sector, while different carbon emission peak times have a significant impact. The next decade is an important window for energy transition and upgrading. The P25 scenario involves an average annual investment of over 170 billion USD, while the average annual investment under the P30 scenario is less than 120 billion USD, with the most significant gaps being in wind and solar power. The P25 scenario (over 1.2 trillion USD) would require twice as much wind and solar investment as the P30 scenario. In the absence of strong action before 2030, thermal power that is not retrofitted with CCS may also continue to be rapidly deployed over the next decade, raising the risk of high carbon lock-in and stranded assets. After 2030, more than 200 billion USD in power investments will be needed every year, with almost no more investments in thermal power without CCS.
《Fig. 9》
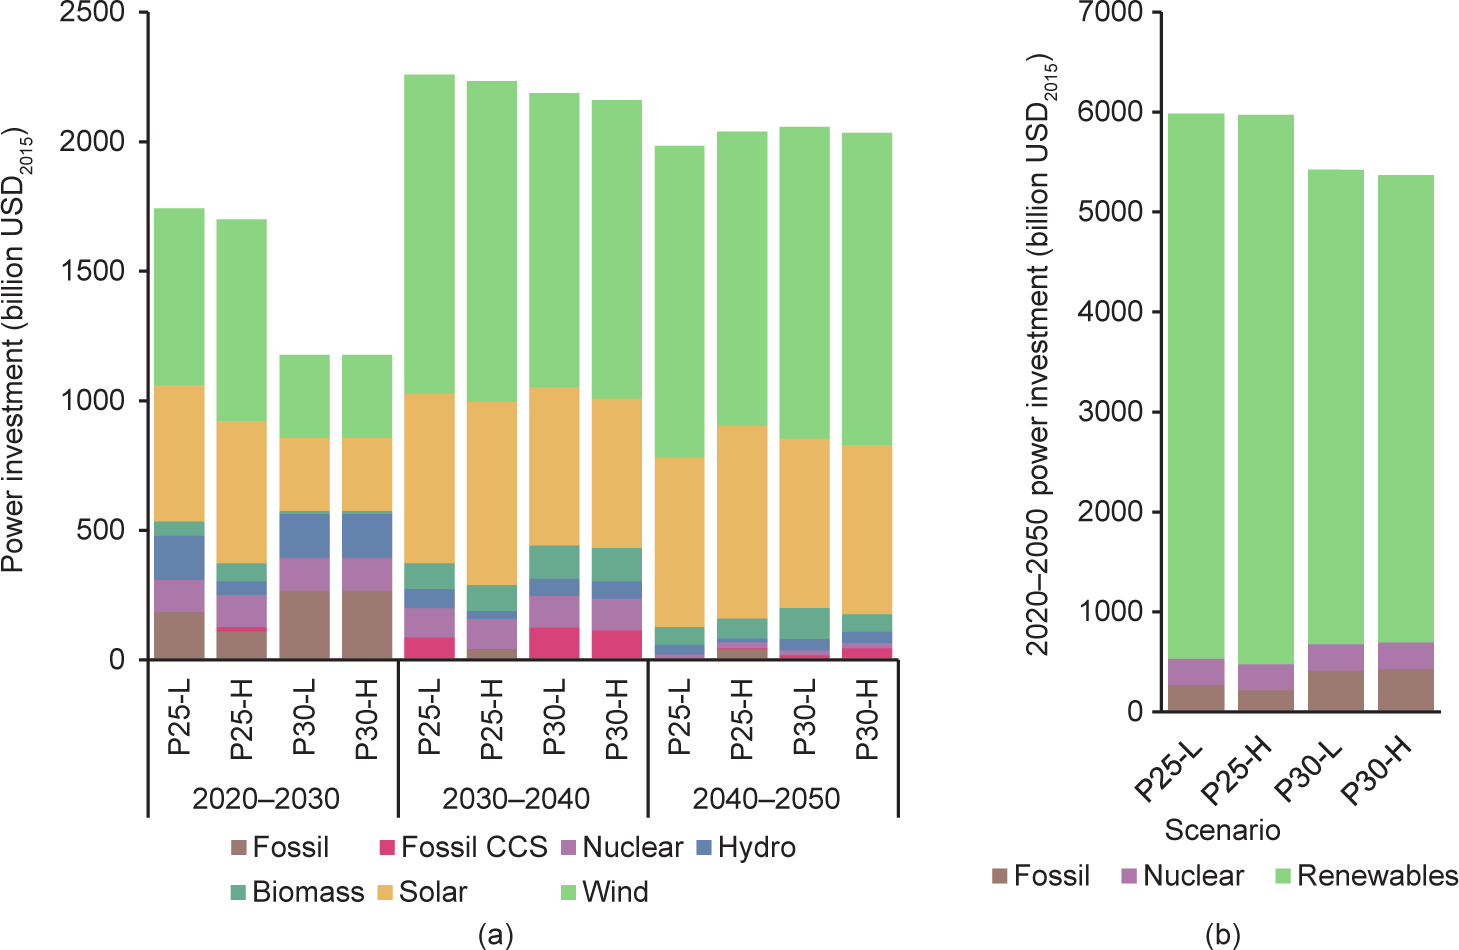
Fig. 9. (a) Power investment by technology type and (b) total power investment between 2020 and 2050.
In terms of power type, wind and solar power always account for the bulk of future power investment, and their share expands year by year. Nuclear power investment will remain at an average annual investment scale of more than 10 billion USD until 2040, while hydropower investment will be very thin from 2030 onward due to resource endowment constraints. Investment in BECCS will increase after 2030, more so in scenarios under which emissions will be lower in 2050 or peak in 2030. To absorb renewable energy, electrochemical energy storage, pumped hydro energy storage, and compressed-air energy storage will be rapidly developed. Based on the modeling results, by 2050, the power system will need nearly 800 billion USD of energy storage investment, and nearly 30% of that amount will need to be realized in the next 10 years from now.
3.3.3. Synergistic effects
While the energy transition requires significant infrastructure investment and presents practical obstacles, it also brings many benefits to China’s sustainable development both inside and outside of the energy system. The internal benefits are clear, with energy security being the most obvious. Due to the massive replacement of fossil energy by renewable energy sources, the future demand for both oil and natural gas in China will rapidly decline, thus increasing the country’s energy independence. It is estimated that China will be able to achieve self-sufficiency in natural gas by 2050, and that the oil self-sufficiency rate will increase to over 60%. In addition, energy accessibility will be greatly improved by large-scale renewable energy construction, especially distributed solar power. Although we will experience an increase in the cost of power generation in the next two decades, the cost of power generation in 2050 will be close to or even lower than current levels due to the rapid decline in the cost of renewables.
Outside of the energy system, the significant co-benefit of the transition is the improvement in air quality. Under the assumption that current local air pollutant reduction efforts remain unchanged, significant reductions in air pollutants such as SO2, NOx, PM10, and PM2.5 will be achieved through CO2 reduction actions alone (Fig. 10). In 2020, the majority of SO2 came from the industry and power sectors. SO2 emissions will decrease from 7 Mt in 2020 to approximately 1 Mt (P30) and 0.8 Mt (P25) in 2050. The industry sector will be key in reducing SO2; decarbonization in the power sector will also have a significant impact until 2035, while fuel substitution in the demand sectors will have a nonnegligible role after 2035. In 2050, the industry and transport sectors will become the two largest emitters.
《Fig. 10》
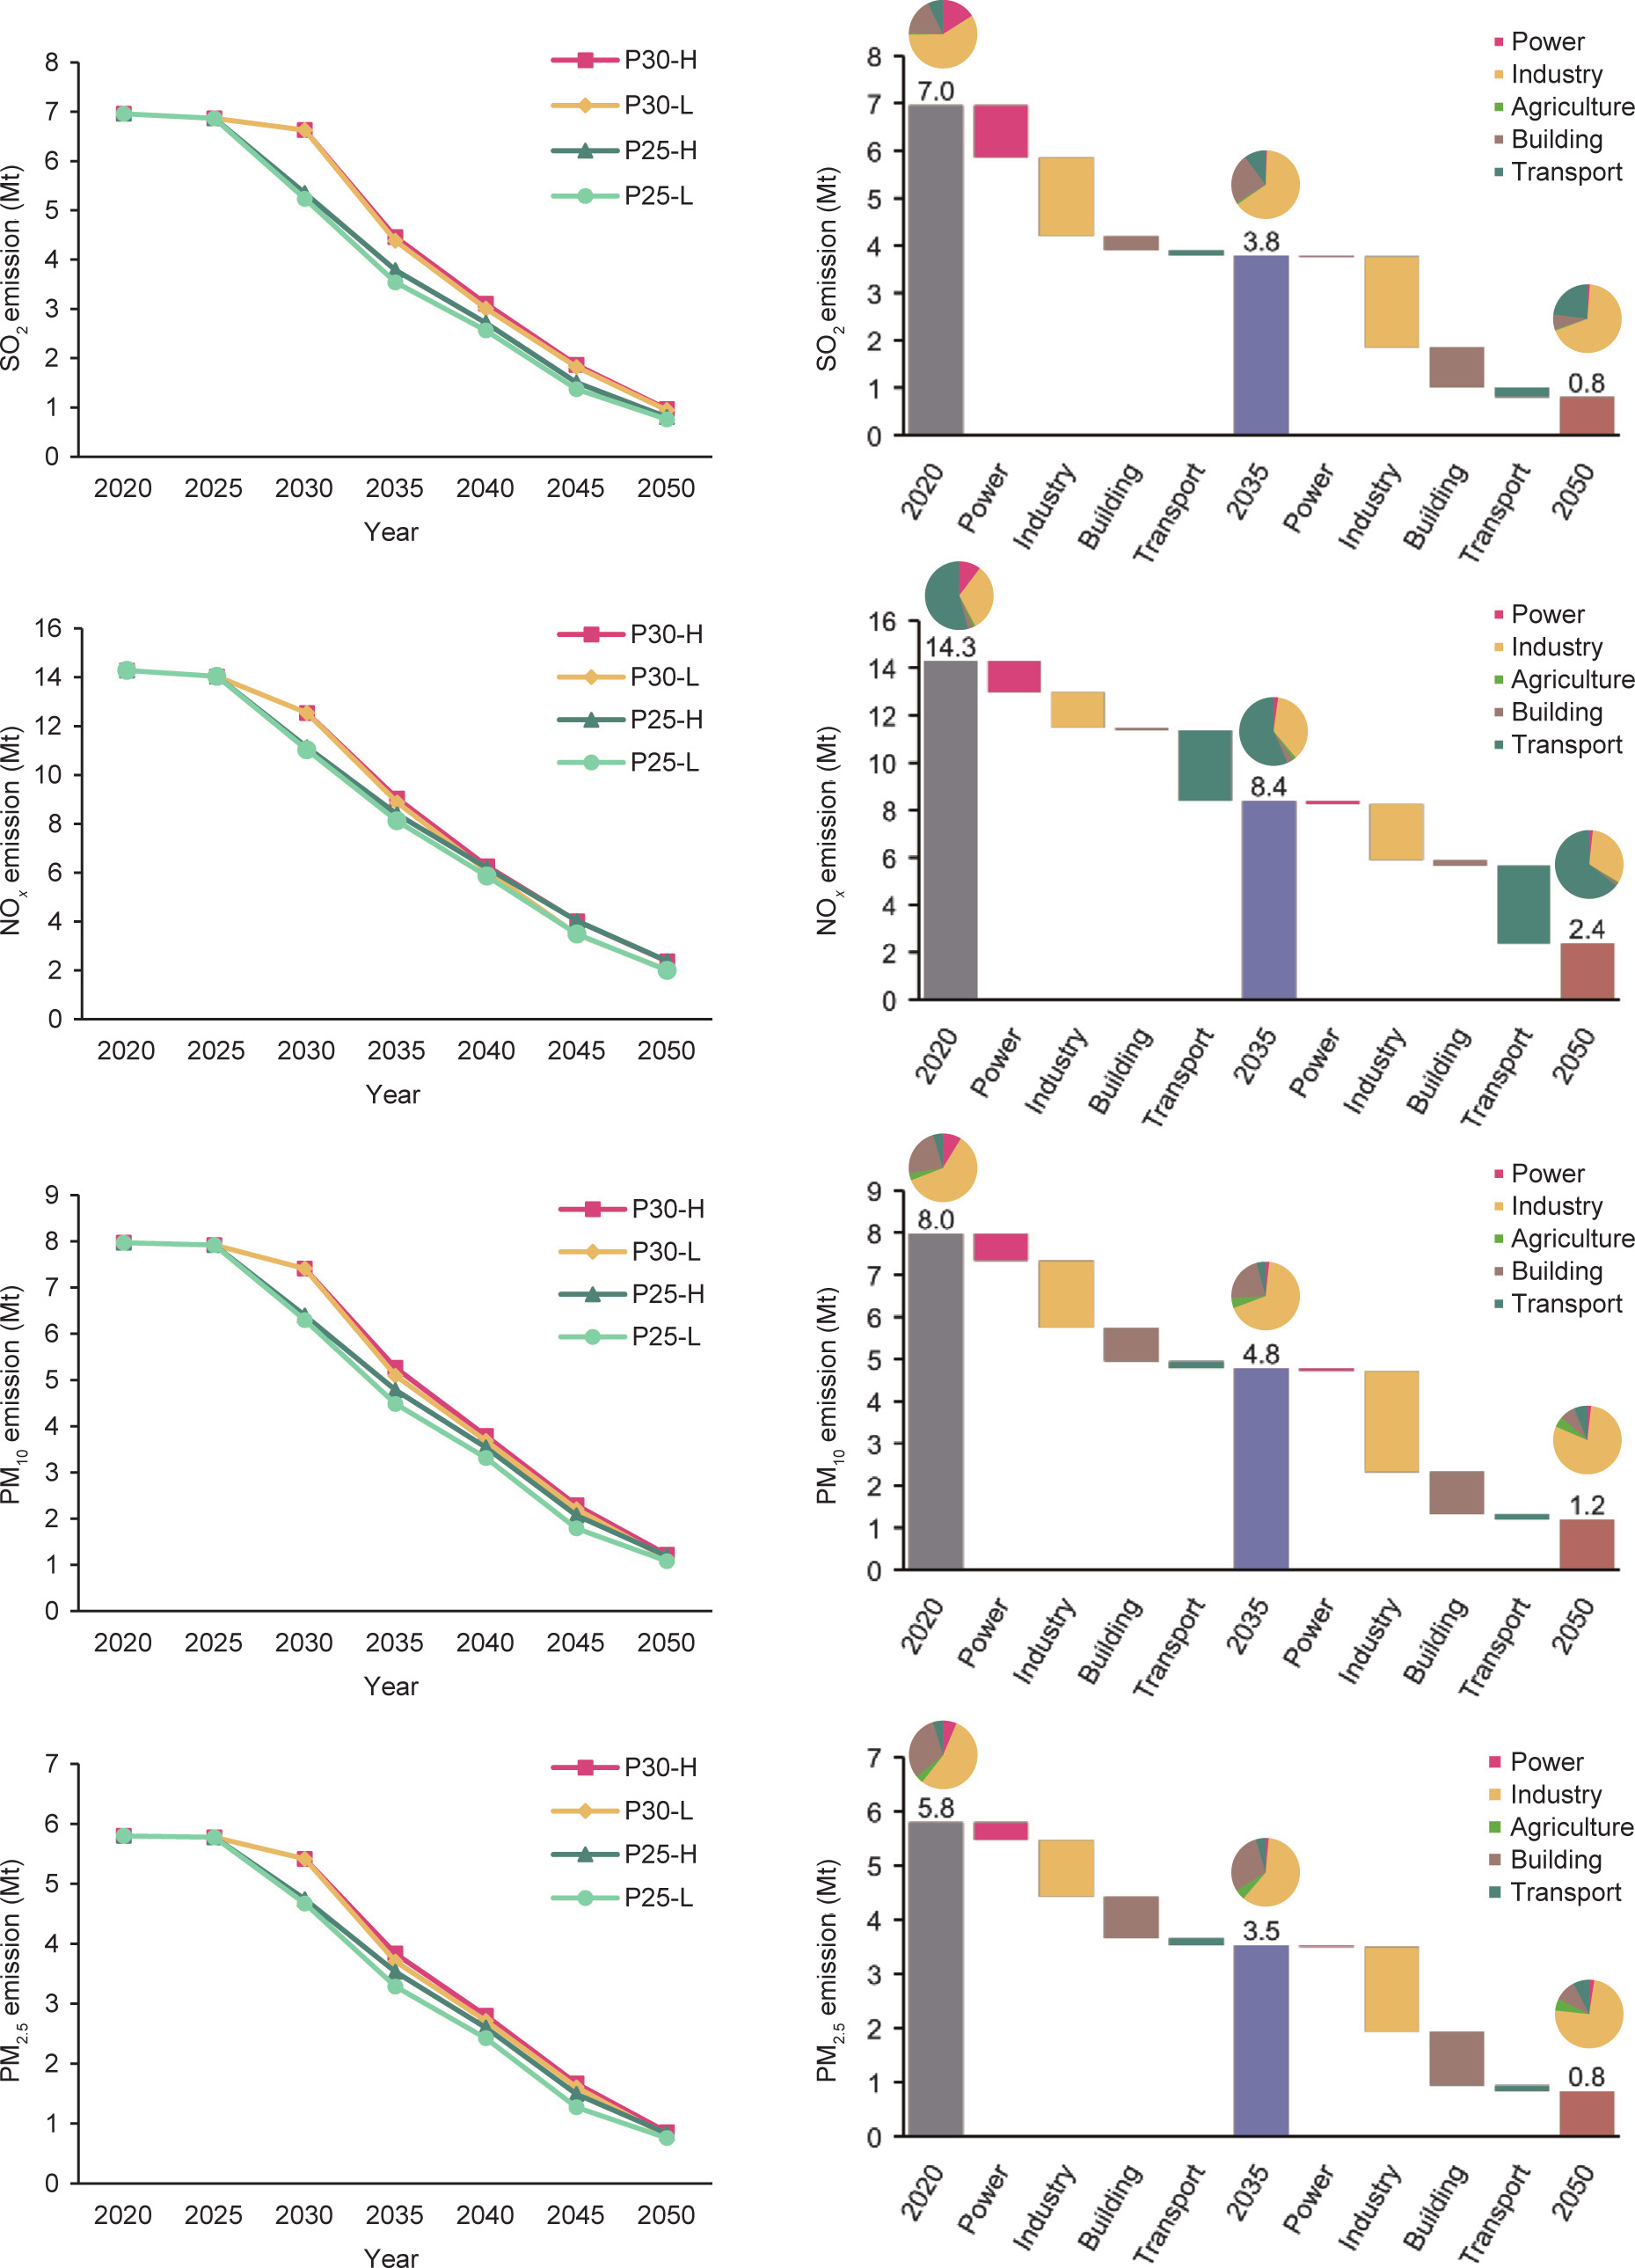
Fig. 10. Synergistic effect of CO2 emission reduction on local air pollutant reduction (left) and the decomposition of sectoral emission reductions to local air pollutant reductions for the 2020–2035 and 2035–2050 periods under the P25-H scenario (right).
In 2020, more than half of all NOx came from the transport sector, while another third came from the industry sector. Accompanied by the phasing out of fuel oil and electrification, NOx emissions will decline by approximately 40% in 2035 and 85% in 2050 compared with the 2020 value. Because transport and industry account for such a large share of emissions, almost all emission reductions in the 30 years from 2020 to 2050 will come from these two sectors. In 2050, the share of transport emissions will increase to approximately two-thirds, while a slight increase followed by a decrease will occur in industry emissions.
PM10 and PM2.5 share similar emission-reduction pathways and sectoral compositions. In 2020, more than 60% of particulate emissions came from industry, with most of the remainder coming from the building sector. Between 2020 and 2050, PM10 and PM2.5 emissions will decrease by approximately 86%, while the share of industry emissions will simultaneously increase to more than threefourths. Emission reductions in the industry sector have played a key role in this pattern, but changes in the building sector should not be ignored.
Emissions of the four local air pollutants mentioned above during the 2025–2035 period will vary considerably under different peak time scenarios. The P25 scenarios will reduce SO2, NOx, PM10, and PM2.5 emissions by 21%, 12%, 15%, and 14%, respectively, in 2030 compared with the P30 scenario. Therefore, although the emissions under different scenarios will converge in 2050, acting early will yield more near-term benefits.
《3.4. Sensitivity analysis》
3.4. Sensitivity analysis
Cumulative carbon emissions, the carbon emission peak time, and the carbon neutrality time are three critical parameters that influence the emission-reduction pathway. The robustness of the results given above is further evaluated by the large uptake of cumulative emissions with constant values under each scenario of peak emissions and emissions in 2050 (Fig. 11). Under all base and sensitive scenarios with actions beginning in 2025, coal consumption in 2035 will be lower than under actions beginning in 2030, suggesting that an early peak could help to facilitate the phasing out of coal. Although changes in cumulative emissions produce large fluctuations in coal consumption, it is observed that, under all scenarios, more stringent 2050 emission targets will result in smaller coal consumption in 2035.
《Fig. 11》
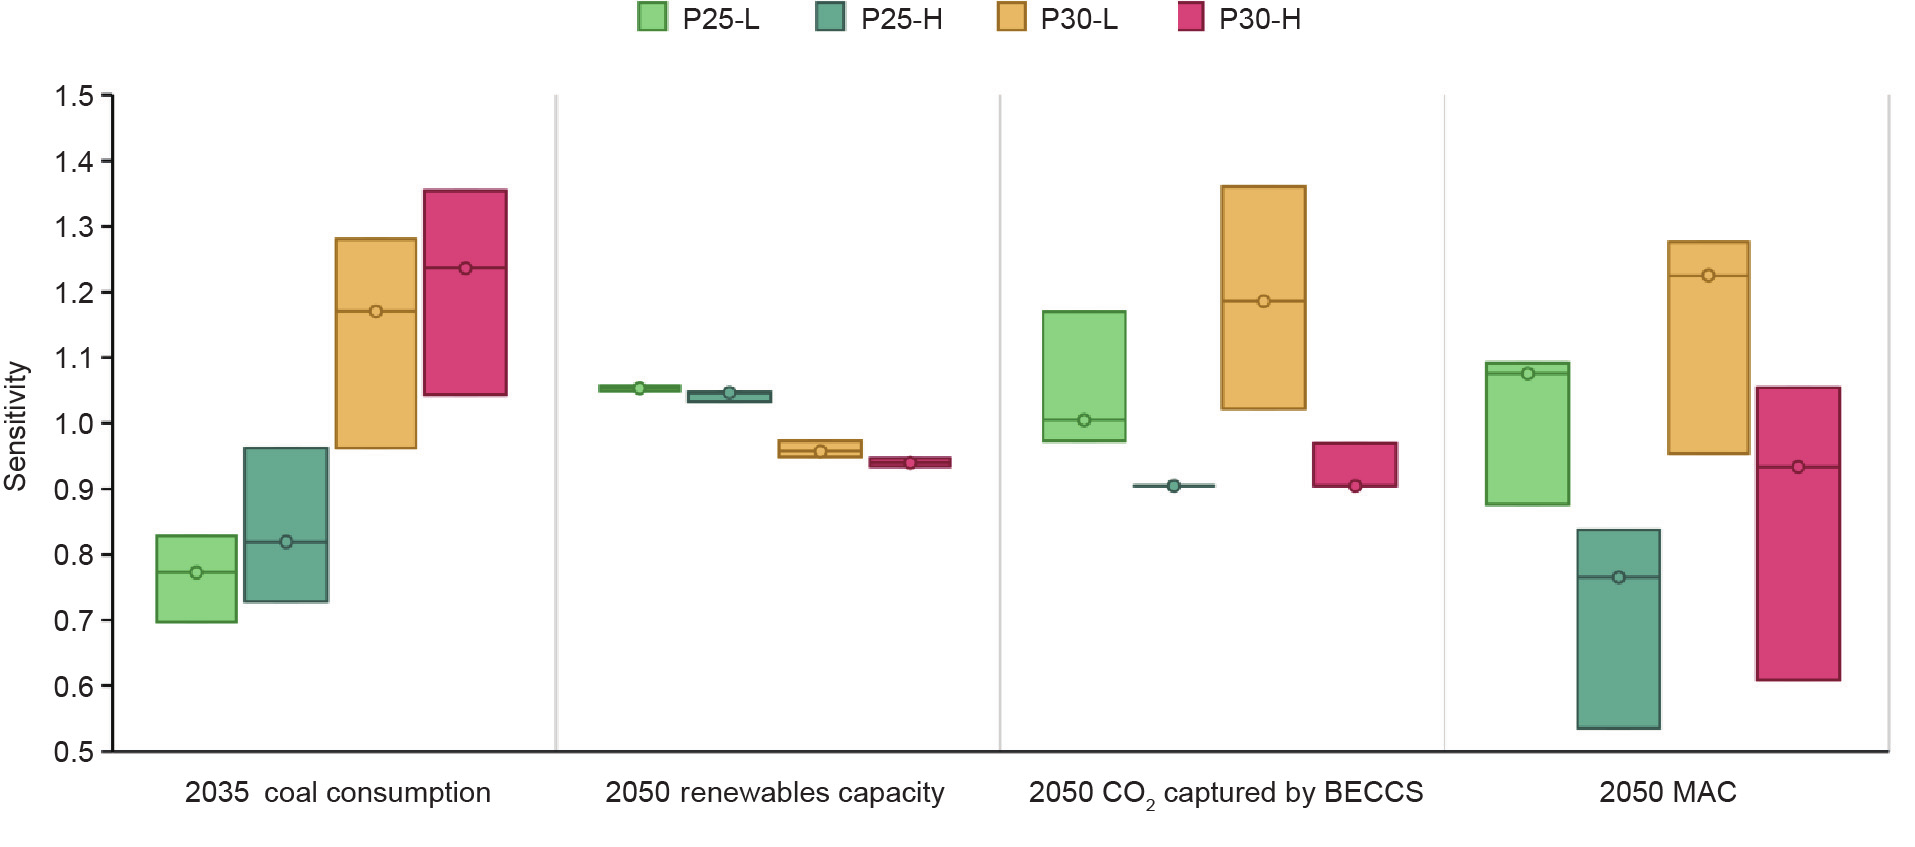
Fig. 11. Sensitivity analysis of coal consumption in 2035, renewable energy capacity in 2050, CO2 captured by BECCS in 2050, and MAC in 2050. Each scenario varies cumulative emissions by a 5% increase or decrease with respect to a fixed peak emission level and the 2050 emission level. The results are normalized based on the average of the values under the base scenario for each variable. The hollow points in the box plot are the values of the base scenario.
A high degree of consistency will be achieved between different scenarios of installed renewable electricity capacity in 2050, with the total installed capacity fluctuating within a range of 2.5%. Among the observations that can be made, it can be seen that renewable electricity will be more fully developed, with a 10% increase in total capacity if the emission peak is reached earlier. Decarbonization of the power system will be largely complete by 2050, with no more than 3.5% of renewable energy capacity increases to be noted due to more stringent long-term emissionreduction targets.
Although the deployment of BECCS technologies is strongly influenced by cumulative emissions, early peaking will reduce the impact of variability in cumulative emissions and limit the reliance on CDR technologies. Since all emissions will already be low in 2050, all scenarios show a great demand for BECCS, with the P25-L and P30-L scenarios having a higher deployment rate. Similar to CDR technologies, the MAC is strongly influenced by changes in cumulative emissions. Both a later emission peak and stricter 2050 emissions targets will increase the MAC, creating greater transition pressure. An early peak can help in taking the initiative to achieve long-term reduction targets.
《4. Conclusions and policy implications》
4. Conclusions and policy implications
This paper examined China’s decarbonization pathways and energy transition toward carbon neutrality. With respect to China’s existing NDC and carbon neutrality targets, we set up four scenarios in which the carbon emission peak and carbon neutrality are achieved both early and on time, in order to find an appropriate pathway to carbon neutrality. China’s CO2 emissions and primary energy consumption will peak between 2025 and 2030, followed by a rapid decline. Power sector decarbonization will play a crucial role in the near term. The carbon neutrality target will encourage the decarbonization of the power sector by 2040, followed by significant negative emissions to offset CO2 emissions from the demand sectors. Coal will be rapidly phased out and replaced by large-scale wind, solar, and biomass energy before 2040. In 2050, the capacity of solar and wind power will be 6.3–7.1 TW, and their electricity output will meet two-thirds of the total electricity demand. Emissions from the industry sector have been decreasing, but those from the building and transport sectors will increase until 2030. The demand sectors will achieve higher levels of electrification (near 60%), with hydrogen being expanded in the industry and transport sectors. Deep decarbonization of the energy system will lead to a rapid decrease in local air pollutant emissions, with significant synergistic effects on human health. Under different settings of the carbon emission peak time and carbon neutrality time, we observed that timing uncertainty has implications for investment, cost, feasibility, and technological requirements.
Upon comparing multiple scenarios, we found that an earlier peak gives China more time to arrange for the orderly phasing out of coal-fired power and the steady deployment of renewable energy. While there may be greater transition pressure in the near term, this is the most cost-effective option in the long term. In the meantime, small cumulative emissions by 2050 will cut the need for many negative emissions in the second half of this century. Local air pollutant reductions by 2050 will be similar among the four scenarios, but peaking earlier will lead to significantly improved air quality in the next 15 years. Lower 2050 emissions will increase the overall pressure to reduce emissions, which will lead to a larger expansion of renewable energy and negative emission technologies. The demand sectors will also respond to stringent emission limits by reducing the energy service demand (increased welfare losses), using high-cost technologies (largescale use of hydrogen energy), and so forth.
As a result, we offer the following policy insights based on our findings:
(1) It is important for China to take prompt action toward an early peak of CO2 emissions at a low level.
(2) It is important for China to promote renewable energy to replace fossil energy in the power sector and to pay attention to the development of energy storage facilities, as the high penetration of renewables poses challenges for the power system in terms of matching supply and demand.
(3) It is important for China to rationalize the decommissioning of existing coal-fired power plants, establish pilot CCS industries, improve the industrial chain of biomass development, and prepare for the large-scale development of BECCS at a later stage.
(4) It is important for China to advocate for sustainable energy demand and accelerate the penetration of electricity and hydrogen in the demand sectors. Efficiency improvement, fuel switching, and demand reduction are crucial.
Overall, our research identifies the direction of China’s future energy transition to carbon neutrality. The decarbonization pathways, mitigation strategies, and potential challenges for each sector are highlighted. At the same time, our research clearly shows that the actions being taken in China are critical for the successful implementation of a low-carbon transition, and that all sectors have the opportunity and potential to accelerate the transition. In the future, more consideration of the tradeoffs and co-benefits of the energy transition will be able to make the assessment more instructive and informative for policymakers.
《Acknowledgments》
Acknowledgments
This research was supported by the National Natural Science Foundation of China (71690243 and 51861135102), the Ministry of Science and Technology of the People’s Republic of China (2018YFC1509006) and the World Bank Group (7202065).
《Compliance with ethics guidelines》
Compliance with ethics guidelines
Shu Zhang and Wenying Chen declare that they have no conflicts of interest or financial conflicts to disclose.


 京公网安备 11010502051620号


