
《1. Introduction》
1. Introduction
Multiphoton (mP) microscopes have been widely used for investigating live cells, thick tissues, and organs. The use of nearinfrared pulsed lasers results in large imaging depths, less photobleaching, and phototoxicity [1–5]. However, these microscopes cannot be used for the ultrastructural imaging of live samples owing to their limited spatial resolution. The rapid development of high-intensity lasers, high-sensitivity detectors, fluorescent probes, and related optoelectronic devices has resulted in remarkable achievements in super-resolution far-field optical microscopy. Current super-resolution approaches for surpassing the diffraction limit include photoactivated localisation microscopy (PALM) [6,7], stochastic optical reconstruction microscopy (STORM) [8–10], stimulated emission depletion (STED) [11,12] microscopy, and structured illumination microscopy (SIM) [13,14].
In PALM and STORM, a fluorescent super-resolution image is reconstructed from the accurate localisation of individual fluorescent molecules, which emit light sparsely in a controlled manner: Within a diffraction-limited local area on each image plane, the recorded fluorescent light is emitted from a single molecule only, and the positions of individual molecules can be determined with nanometer or sub-nanometer precision. To obtain such a superresolution image, thousands of raw images must be acquired from both PALM and STORM. Although these two methods afford a minimum resolution of approximately 10 nm [15,16], real-time imaging of fast live-cell processes or long-term monitoring of cell processes with super-resolution remains challenging.
In STED microscopy, the diffraction limit is surpassed by deexciting fluorescent molecules in the excitation state using a redshifted donut-shaped light (i.e., STED light). The diffractionlimited focal spot of the excitation is overlapped with the STED beam. Super-resolution is achieved because the fluorescent signal was emitted from only the STED beam’s hollow central area, which is smaller than the diffraction-limited focal spot of the excitation beam [11,12]. Although STED microscopy enables cellular imaging with 20–30 nm resolution and can be used for thick samples [17– 20], it typically requires a high-intensity STED laser whose magnitude is four to six orders higher than that afforded by STORM or PALM; as such, live cells may be damaged. The tradeoff between spatial resolution and phototoxicity must be balanced in live-cell experiments.
SIM, another super-resolution imaging technology, does not require particular fluorophores, such as the ‘‘on–off” fluorophores in STORM or specific fluorophores in STED. In SIM, the Moiré effect is used to enhance the microscopic resolution [13]. In SIM, unobservable high-spatial-frequency information is typically transferred to the microscope’s observable passband by illuminating the sample with a structured pattern. By captured images under different phase shifts and orientations of the illumination pattern projected into the sample and then performing the appropriate deconvolution, the resolution of the image can be improved by a factor of two in linear SIM, as compared with wide-field microscopy. Higher resolutions can be achieved in saturated structured-illumination microscopy (SSIM) via fluorescencesaturated excitation, which results in significant photobleaching and photodamage to cells [21,22]. Recently, fluorescent photoswitchable protein-based SSIM microscopy has enabled cellular imaging with a resolution of approximately 40 nm [23,24]. In linear SIM, the number of raw images required for a single superresolution image is much fewer than those required in STORM or PALM, and the illumination intensity is significantly less than that of STED. These features render SIM suitable for the rapid imaging of live cells [25–27]. Structured illumination has been successfully realised in samples using a grating [13], spatial light modulator [23], or digital micromirror device [28]. SIM provides excellent flexibility for imaging various biological structures, including mitochondria [27,29], bacteria [30,31], and other specimens [32–34].
Although super-resolution microscopy technologies have progressed considerably, the development of mP super-resolution microscopy remains slow [35]. The mP effect is due to the nonlinear response of fluorophores to the intensity of excitation laser; for example, because the intensity of two-photon (2P) fluorescence is proportional to the square of the excitation laser intensity, the 2P fluorescence pattern of a uniform fluorescence solution excited by a sinusoidal structured illumination pattern is a nonsinusoidal structured fluorescence pattern resulting from the superimposition of all frequencies, including the fundamental frequency and its higher-order harmonics with unequal amplitudes. To solve the fluorophore’s nonlinear response problem in mP microscopes, scanning patterned illumination (SPIN) and scanning patterned detection (SPADE) for 2P-SIM have been developed [36]. In SPIN microscopy, the super-resolution of the doubled diffraction limit is achieved by removing the harmonic (2ωt) from the passband of the effective 2P optical transfer function (OTF) (where ωt is temporal modulation frequency and t represents time). Specifically, this is achieved by controlling ωt such that it is equal to the cutoff frequency ωc of the detection fluorescence point spread function (PSF). Here, ωt is determined by the electro–optical modulator (EOM) and the speed of the scanners. Meanwhile, the resolution of SPADE microscopy can be improved by a factor of two by changing the sinusoidal structured illumination pattern to the sinusoidal square root structured illumination pattern to avoid the harmonics [35,36]. Recently, SPIN 2P-SIM with a lateral resolution of 141 nm, which improves the resolution by a factor of approximately two as compared with the diffraction limit [37], was developed experimentally. Additionally, the imaging of three-dimensional live organisms using SPADE 2P-SIM with ~150 nm lateral and ~400 nm axial resolutions was realised. The imaging depth was 100 μm from the coverslip surface [38]. Most reported 2P-SIM schemes are based on the principle of avoiding the harmonics of a structured fluorescence illumination pattern to realise a twofold improvement in resolution via 2P-SIM. However, we discovered that harmonics are crucial in further improving the image resolution: If the harmonics outside the passband of the detection fluorescence OTF can be used, then a many-fold resolution improvement in mP-SIM based on these harmonics can be achieved using an appropriate reconstruction algorithm.
Herein, we present a novel mP-SIM method that uses a nonsinusoidal structured fluorescence illumination pattern and a reconstruction algorithm, thereby enabling imaging with unlimited resolution theoretically if the order m of the nonlinear response of fluorophores in the mP excitation process is sufficient. Our mP-SIM, similar to SPIN, uses an EOM to sinusoidally modulate the laser intensity. The scanning sinusoidal structured illumination pattern can excite a nonsinusoidal structured fluorescence illumination pattern in samples by the superimposition of the direct current, fundamental frequency, and a series of harmonics generated by the nonlinear response of fluorophores via mP excitation, without requiring saturation excitation. The interaction of harmonics with the structures of the sample will shift the higher frequency information to the passband of the detection fluorescence OTF, thereby further improving the resolution. A reconstruction algorithm is developed, where the appropriate number of harmonics can be selected to reconstruct the super-resolution image based on the required resolution. Our theoretical results show that mPSIM affords an (m + 1)-fold improvement at the maximum in terms of the lateral resolution, as compared with conventional 2P microscopes, without requiring either specific fluorophores or highintensity laser. Furthermore, we demonstrate the applications of our 2P-SIM to image nanoparticles and bovine pulmonary artery endothelial (BPAE) cells with stained F-actin. An 86 nm lateral resolution for 2P-SIM and a 72 nm lateral resolution for secondharmonic-generation (SHG)-SIM can be achieved. To the best of our knowledge, the abovementioned resolution is the highest demonstrated in 2P-SIM hitherto.
《2. Material and methods》
2. Material and methods
《2.1. Optical system》
2.1. Optical system
Our system (Fig. 1) comprised a Nikon (Japan) inverted microscope with a 60× oil objective (CFI Plan Apochromat Lambda, Japan) and a mode-locked Ti:sapphire laser (Mai Tai DeepSee, Spectra– Physics, USA) tuned to a centre wavelength of 810 nm. The laser pulse duration was 100 fs, and the output power was 2.7 W. The laser power was sinusoidally modulated using an EOM (Model 350, Conoptics, USA). The laser beam was scanned line-by-line using a two-dimensional (2D) galvo scanner (GS) (Model 6210H, Cambridge Technology, USA) driven by sawtooth waves generated by a data acquisition (DAQ) card (NI-PCI6110). The focal length of the scanning lens was 60 mm. Excitation illumination patterns were generated by combining excitation beam scanning and the sinusoidal modulation of the excitation beam power. The phases and orientations of the illumination patterns can be changed by varying the phase and period of sine waves to operate the EOM. The fluorescence acquired by the objective was reflected by a dichroic mirror and filtered by a 2P filter (ET625SP-2P, Chroma, USA) to obstruct the excitation laser. Subsequently, the fluorescence signal was focused via a lens with a short focal length to a photo multiplier tube (PMT) (H7422-50, Hamamatsu, Japan). For SHG imaging, the emission filter for fluorescence was replaced with an SHG filter (ET405/10×, Chroma) to filter the backward SHG signal. Subsequently, the SHG signal was focused to a PMT.
《Fig. 1》

Fig. 1. Schematic illustration of microscope. Mode-locked near-infrared Ti:sapphire laser beam (red) is sinusoidally modulated by EOM and scanned line-by-line by 2D galvo scanner (GS) to excite fluorescence through 60× objective. Fluorescence (green) is acquired by the objective, deflected away from the excitation path, and detected by a PMT. M1, M2: mirror 1, mirror 2; f: focal length; Ex: excitation; HWP: half wave plate; DM: dichroic mirror; OBJ: objective; PMT: photo multiplier tube. Note: Drawing is not to scale.
《2.2. System-control and DAQ》
2.2. System-control and DAQ
The system was controlled by a personal computer. The EOM, 2D scanner, and PMT were synchronously controlled via a custom program written in LabVIEW. Sine and sawtooth waves were generated from an NI-PCI-6110 card to operate the EOM and 2D GS, respectively. The output voltage from the PMT was amplified by the low-noise preamplifier (Model SR570, Stanford Research Systems, USA) and then acquired via the same NI card to reconstruct the raw structured fluorescence images. We obtained scanning illumination patterns with orientations of 15°, 75°, and 135° with respect to the fast axis of the scanners by changing the initial phase and period of the sine wave without rotating the samples. For each orientation, at least five patterns were generated with different initial phases (i.e., 0, 2π/5, 4π/5, 6π/5, and 8π/5). The scan rate was set to one frame per second in the experiments.
《2.3. Data processing》
2.3. Data processing
The raw images were processed to obtain a super-resolution image using custom software written in MATLAB (MathWorks, USA). The data processing included the following main steps: ① rescaling of raw images. To compensate for intensity fluctuations of the light source and photobleaching, we rescaled the raw images to equalise their total background-subtracted intensity. ② Calculating the separated frequency components based on the five raw images in each direction. We slightly trimmed the spectra via apodisation to reduce the noise and edge artefacts introduced by discrete Fourier transform. ③ Shifting the separated frequency components in the three directions to their initial positions, and then linearly integrating them based on their weight. ④ Wienerfiltering the added spectrum and reconstructing a superresolution image.
《2.4. Preparation of fluorescence beads》
2.4. Preparation of fluorescence beads
Yellow–green beads (Fluoro-Max, G75; 75 nm diameter, ThermoFisher Scientific, Germany) were used to assess the lateral resolution of the system. The beads were diluted at a ratio of 1:1300 (1:100 in distilled water and 1:13 in ethanol) and dispersed across a cleaned conventional coverslip. After performing airdrying for a few minutes, both ethanol and water evaporated. Subsequently, the coverslips were washed gently with water to remove excess and unbound beads. After air-drying was performed again, the beads were dispersed in silicone oil and deposited onto glass slides, which were then covered by a coverslip and sealed with nail polish.
《2.5. BPAE cell samples》
2.5. BPAE cell samples
FluoCells® slide #1 (F36924, ThermoFisher Scientific) containing BPAE cells were stained with a combination of fluorescent dyes. Mitochondria was labelled with red-fluorescent MitoTracker® Red CMXRos, F-actin was stained using green-fluorescent Alexa Fluor® 488 phalloidin, and nuclei were labelled by blue-fluorescent 4' ,6-diamidino-2-phenylindole (DAPI).
《2.6. Collagen fibre samples》
2.6. Collagen fibre samples
The tail tendon was removed from Balb/C mouse-tails and stored in phosphate-buffered saline solution for 10 min. Glass slides and coverslips were ultrasonically cleaned in ethanol for 10 min, blown dry with N2 gas, and plasma cleaned in O2 gas for 5 min. A 10 mm-long section was cut from the tendon and placed onto a glass slide, which was then covered with a coverslip and sealed with dental cement. Glycerine was used to match the diffraction index between the samples and coverslips.
《3. Theory》
3. Theory
A generalised theory of mP-SIM based on the nonlinear response detection of fluorophores in the mP excitation process is provided in Note A in Appendix A. The theory reveals that unlimited resolution can be achieved by completely utilising the harmonics of the nonsinusoidal structured fluorescence pattern generated by sinusoidal structured pattern excitation in scanning mP-SIM. We omit trivial constant factors in the equations. Because the mP effect is nonlinear, it is difficult to excite mP fluorescence in a wide-field mode. Therefore, the sinusoidal structured excitation illumination pattern is produced by scanning the excitation beam with a synchronised sinusoidal intensity modulation.
We explain the resolution improvement along one dimension in mP microscopy, in which up to the mth harmonic frequency is generated by the nonlinear response of fluorophores in mP excitation process when the scanning sinusoidal structured excitation illumination pattern excites fluorophores. The detector cumulatively acquires the fluorescent signals point-by-point to generate a final frame of image (Note A in Appendix A).

where  is the normalised peak intensity of the excitation light at the focal spot and represents the structured excitation illumination pattern; r is the position of the center of the scanning beam;
  is the excitation PSF at the excitation wavelength with a cutoff frequency of
  ;
;  is the effective excitation PSF of mP microscopy with a cutoff frequency of
  ; s(r) is the conentration of fluorophores; and hem is the detection PSF with a cutoff frequency of ωc . If we do not consider the fluores-fluorescence cence Stokes shift, then
  denotes the convolution operation, and
  represents the corresponding structured fluorescence illumination pattern excited by
  . In Eq. (1), only the first term
 can yield the SIM form, where s (t ) and
 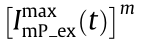 yield Moiré stripes, whereas the second term
  does not. Therefore,
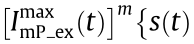
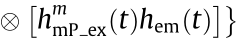 can be regarded as background noise.
For more intuitive calculations, we summarise a generalised matrix formula of the image p' (t) in Fourier space, as follows (Note A in Appendix A):
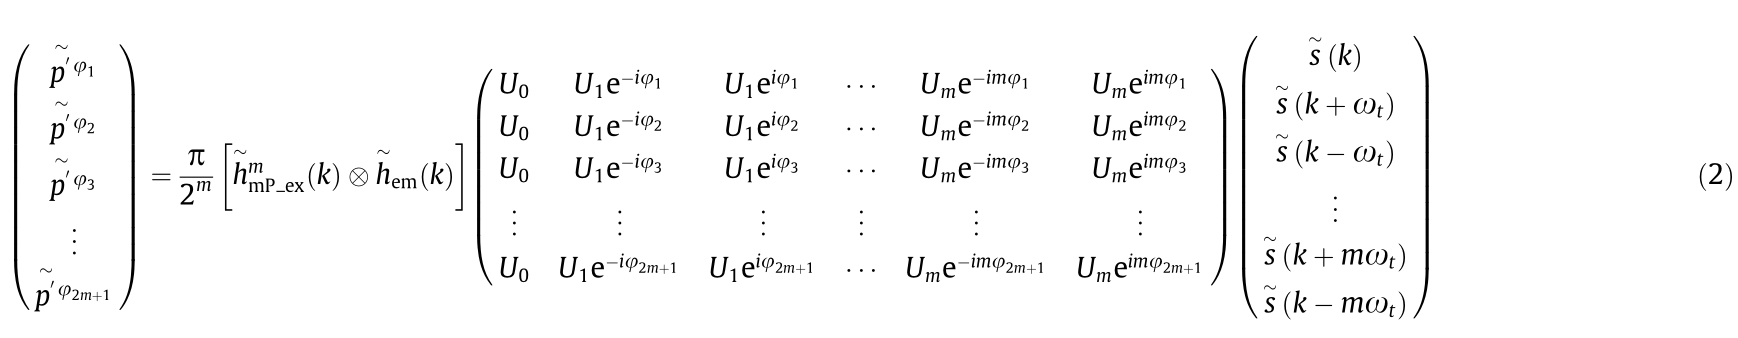
where  is the spatial frequency; U0 , ..., Um are constant coefficients.
Because of the nonlinear response of fluorophores in the mP process, the harmonics first appeared at the peak of the laser excitation; hence, they exhibited fine structural information. Based on Eq. (2), the interaction of the higher harmonics with the structures of the sample shifts the higher undetectable frequency information to the microscope’s detectable passband. The higher the frequency of the harmonics, the higher is the resolution. Therefore, the appropriate number of harmonics can be selected to reconstruct the super-resolution image based on the resolution to be improved in our reconstruction algorithm.
To better describe our theory without loss of generality, we present four photon (4P)-SIM as an example. The nonsinusoidal structured fluorescence illumination pattern was obtained by superimposing all frequencies, including the direct current, fundamental frequency (ωt), second harmonic (2ωt), third harmonic (3ωt), and fourth harmonic (4ωt), with different amplitudes (Note A in Appendix A). The fundamental frequency of the nonsinusoidal structured fluorescence illumination pattern was set to ωc by tuning the modulation frequency. If we reconstruct the super-resolution image using only the direct current, then the resolution will be that of the conventional 4P microscopy. If we reconstruct the superresolution image using the direct current and fundamental frequency ωc, then the corresponding microscopy is named 4P 1-order linear SIM (4P1-LSIM), and the resolution is improved by a factor of two as compared with the conventional 4P microscopy. If the direct current, fundamental frequency ωc, and second harmonic frequency 2ωc are used, then the corresponding microscopy is named 4P 2-order nonlinear SIM (4P2-NLSIM), and the resolution is improved three-fold. If the direct current, fundamental frequency ωc, second harmonic frequency 2ωc, and third harmonic frequency 3ωc are used, then the corresponding microscopy is named 4P 3- order nonlinear SIM (4P3-NLSIM), and the resolution is improved four-fold. Finally, if using the direct current, fundamental frequency ωc, second harmonic frequency 2ωc, third harmonic frequency 3ωc, and fourth harmonic frequency 4ωc, then the corresponding microscopy is named 4P 4-order nonlinear SIM (4P4-NLSIM), and the resolution is improved by up to five-fold compared with the traditional 4P microscopy. The naming convention is similarly adopted in other nonlinear microscopies, such as 2P-SIM.
Based on the matrix formula, at least nine raw images with different phases φn (n = 1, 2, ..., 9) are required in 4P4-NLSIM to calculate frequencies  in each direction. To obtain the isotropic resolution, seven orientations of the structured illumination pattern separated by 2π/7 rad are required to fill the Fourier space. Therefore, 63 raw images are required to reconstruct an isotropic super-resolution image in our 4P4-NLSIM. During the reconstruction, the frequency components should be shifted back to their actual positions and linearly integrated to obtain the frequency spectra of the samples in the frequency domain. Finally, a super-resolution image can be reconstructed via the inverse Fourier transform of the frequency spectra. To reduce reconstruction artefacts caused by discontinuities in the frequency domain, lowpass filtering should be performed during the reconstruction process. Although reconstructing the super-resolution image is more complicated based on our theory, an unlimited resolution can be achieved by integrating many higher-order harmonics of the structured fluorescence illumination pattern, if the order m of the nonlinear response of fluorophores is sufficiently high. However, the resolution is physically limited by the possible higher harmonics. If the higher harmonics terms are zero, then no further resolution improvement can be achieved. Because the highest order achievable in mP microscopy is four hitherto [39], the highest achievable resolution is approximately 43 nm, based on our method for 4P4- NLSIM.
《4. Results》
4. Results
To verify our mP-SIM imaging theory, we simulated the image formation of nanoparticles for different imaging modes, including the conventional 2P microscopy (2PM), 2P1-LSIM, 2P2-NLSIM, 3P3-NLSIM, and 4P4-NLSIM. We compared the PSFs of these imaging modes (Note B in Appendix A). For mP-SIM, we increased the nonlinear order m (m = 1, 2, 3, and 4 as an example) to investigate the resolution improvement. We digitally generated an ideal sample (Fig. S1 in Appendix A) comprising nanoparticles that were randomly distributed in the object plane. The size of the nanoparticles was 1 nm, which was much smaller than the resolution limit and equalled the pixel size of the simulated sample plane. Meanwhile, the image measured 512 pixel ×512 pixel. In the object plane, the grey values of the pixels occupied by the nanoparticles was set to 1, and the grey values of all other pixels were set to 0. Subsequently, the image pattern of these nanoparticles in the image plane was represented by the Airy disk of the microscopic system. Furthermore, we set the emission wavelength to 535 nm for all imaging modes. The objective lens used in the simulation was 60× with numerical aperture (NA) = 1.4. A sinusoidal structured illumination pattern with a spatial period of 210 nm was used. To show the resolution difference in these imaging modes more clearly, we present simulated images of only two particles (Fig. S1 in Appendix A) and provide the normalised lateral intensity distributions along the yellow line through the centre of the diffraction particle image (Fig. S2 in Appendix A). The results show that the PSFs of the diffraction images decreased as the nonlinear order m increased. The full-width at half maximum (FWHM) intensity of the normalised lateral intensity distributions were 210, 112, 74, 53, and 43 nm for the conventional 2PM, 2P1-LSIM, 2P2-NLSIM, 3P3-NLSIM, and 4P4-NLSIM, respectively. In addition, we present simulated Siemens star target images (Fig. S3 in Appendix A) using real-life values of excitation and emission wavelength of widely used fluorophores to directly compare the resolution capabilities of the abovementioned methods. The image resolution of 4P4- NLSIM improved by approximately five-fold compared with that of the conventional 2PM. To better elucidate the super-resolution performance, we simulated the OTFs of our imaging methods (Fig. S4 in Appendix A). Based on the simulation results, the relationship between the nonlinear order m and image resolution d in mP-SIM is expressed as
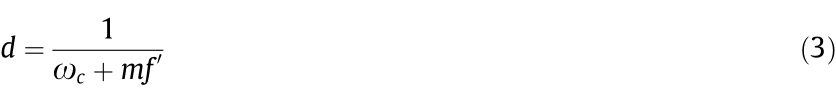
where d is the highest resolution of mP-SIM; and f' is the spatial frequency of the structured fluorescence illumination pattern.
To demonstrate the resolution improvement of 2P-SIM (Fig. 1) experimentally, we imaged 75 nm fluorescence beads using the conventional 2PM, 2P1-LSIM, and 2P2-NLSIM. The control signals were generated using a DAQ card: Sine waves of 32.3, 120.8, and 88.49 kHz were used such that the EOM generated 15°-, 75°-, and 135°-oriented structured illumination patterns, respectively. Meanwhile, sawtooth waves of 1000 and 1 Hz were used to operate the 2D GS. The acquisition time of each raw nonsinusoidal structured fluorescence illumination pattern was 1 s. In each orientation of the structured patterns, five frames of raw nonsinusoidal structured fluorescent images corresponding to a set of sinusoidal structured illumination patterns separated by 2π/5 rad were captured. For three orientations, 15 frames of raw nonsinusoidal structured fluorescent images were recorded. The reconstructed images using our mP-SIM algorithm for different imaging modes and the normalised intensity curves along the yellow and purple lines through the centre of a diffracted image point are shown in Fig. 2. Fig. 2(a) shows images of 75 nm beads captured by conventional 2PM (lower left), 2P1-LSIM (middle), and 2P2-NLSIM (upper right). The magnified images in yellow box in Fig. 2(a) are shown in Figs. 2(b)–(d). The improved resolution is shown in Fig. 2(e), where two fluorescent beads that could not be distinguished via 2P1-LSIM was able to be identified via 2P2-NLSIM. The image resolutions were (233 ± 10), (120 ± 8), and (86 ± 4) nm for the conventional 2PM, 2P1-LSIM, and 2P2-NLSIM, respectively, as shown in Fig. 2(f). Compared with the conventional 2PM, 2P2-NLSIM indicated a 2.7-fold improvement in terms of the lateral resolution.
《Fig. 2》

Fig. 2. Resolutions of 2PM, 2P1-LSIM, and 2P2-NLSIM; 75-nm fluorescence beads were imaged. (a) Images of 75-nm beads via conventional 2PM (lower left), 2P1-LSIM (middle), and 2P2-NLSIM (upper right). Circled area shows zoomed-in for comparison among three imaging modes: (b) 2PM, (c) 2P1-LSLM, and (d) 2P2-NLSIM. (e, f) Normalised intensity profiles of yellow and purple lines in (b)–(d), respectively. Profiles show average FWHM values of (233 ± 10), (120 ± 8), and (86 ± 4) nm. Spatial period of scanning fluorescence fringes at fundamental frequency was 273 nm. Scale bars: 2 μm in (a) and 0.3 μm in (b)–(d).
To investigate the potential of mP-SIM for biological imaging, we imaged fluorescent dye-labelled nuclei and F-actin in BPAE cells based on different imaging modes (Fig. 3) using the same microscope system and parameters as those mentioned above. Compared with the conventional 2PM and 2P-LSIM images, it was shown that 2P2-NLSIM improved the resolution and contrast of the images. The FWHM value of the F-actin microfilaments was 87 nm, which corresponded to a 2.7-fold improvement in the lateral resolution compared with that of the conventional 2P microscopy.
《Fig. 3》
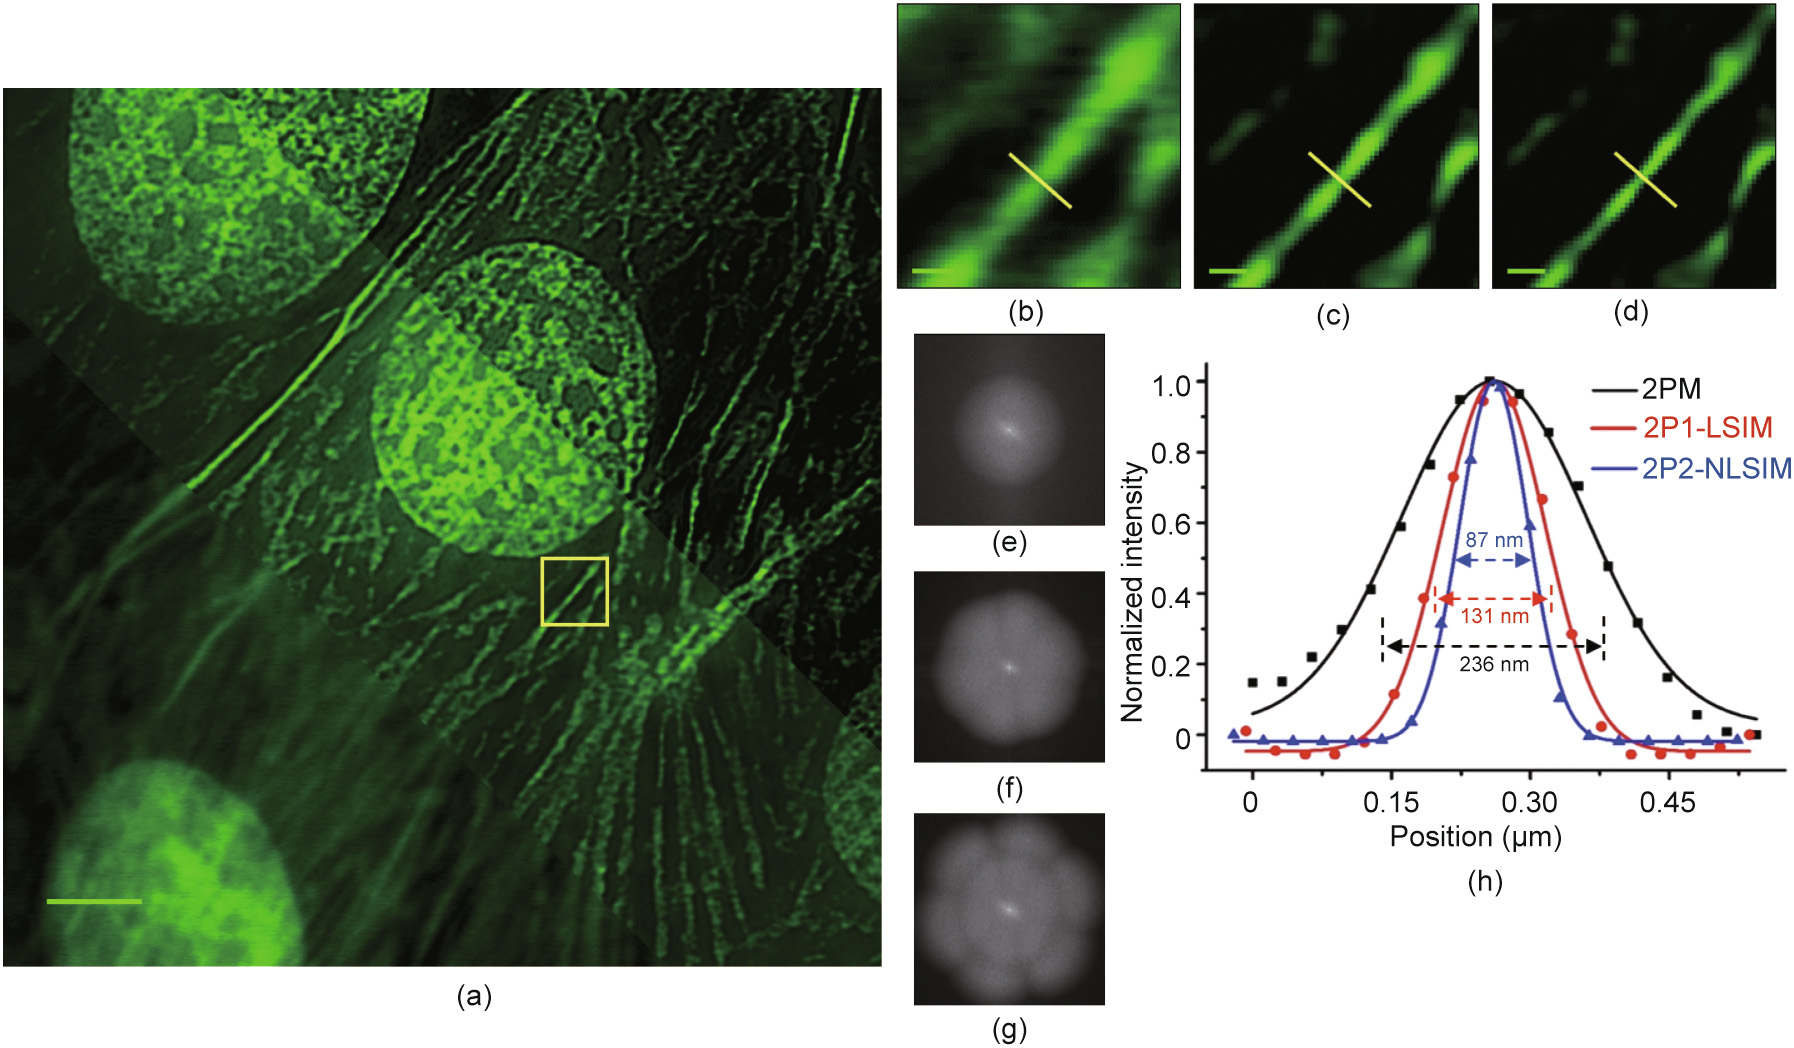
Fig. 3. Resolution improvement by 2P2-NLSIM. (a) Image of F-actin microfilaments and nuclei in BPAE cells obtained via conventional 2PM (lower left), 2P1-LSIM (middle), and 2P2-NLSIM (upper right). (b)–(d) Zoomed-in view of circled area in (a), highlighting resolution differences among images acquired via (b) 2PM, (c) 2P1-LSIM, and (d) 2P2- NLSIM. (e)–(g) Observable spatial frequency regions obtained by Fourier transforming images in (b)–(d) for (e) conventional 2PM, (f) 2P1-LSIM, and (g) 2P2-NLSIM. Much larger region of observable spatial frequencies (g) enables reconstruction of sample with higher spatial resolution. (h) Intensity profiles along same yellow line in three images. Profiles show that FWHM values of conventional 2PM, 2P1-LSIM, and 2P2-NLSIM are 236, 131, and 87 nm, respectively. Spatial period of scanning fluorescence fringes at fundamental frequency is 273 nm. Scale bar is 3 μm in (a) and 0.3 μm in (b)–(d).
Next, we applied our technique to the SHG imaging of collagen fibres in mouse-tail tendon. Collagen fibres exhibit noncentrosymmetric structures, which generate a strong SHG signal. An SHG signal in the backward direction was detected. Fig. 4 shows a comparison among the conventional SHG microscopy, SHG1-LSIM, and SHG2-NLSIM. We observed a significant improvement in terms of resolution and contrast in SHG2-NLSIM. The FWHM values of a collagen fibre for the conventional SHG microscopy, SHG1-LSIM, and SHG2-NLSIM were 195, 98, and 72 nm, respectively. The FWHM of 72 nm in SHG2-NLSIM is similar to the theoretical three-fold improvement in the resolution.
《Fig. 4》
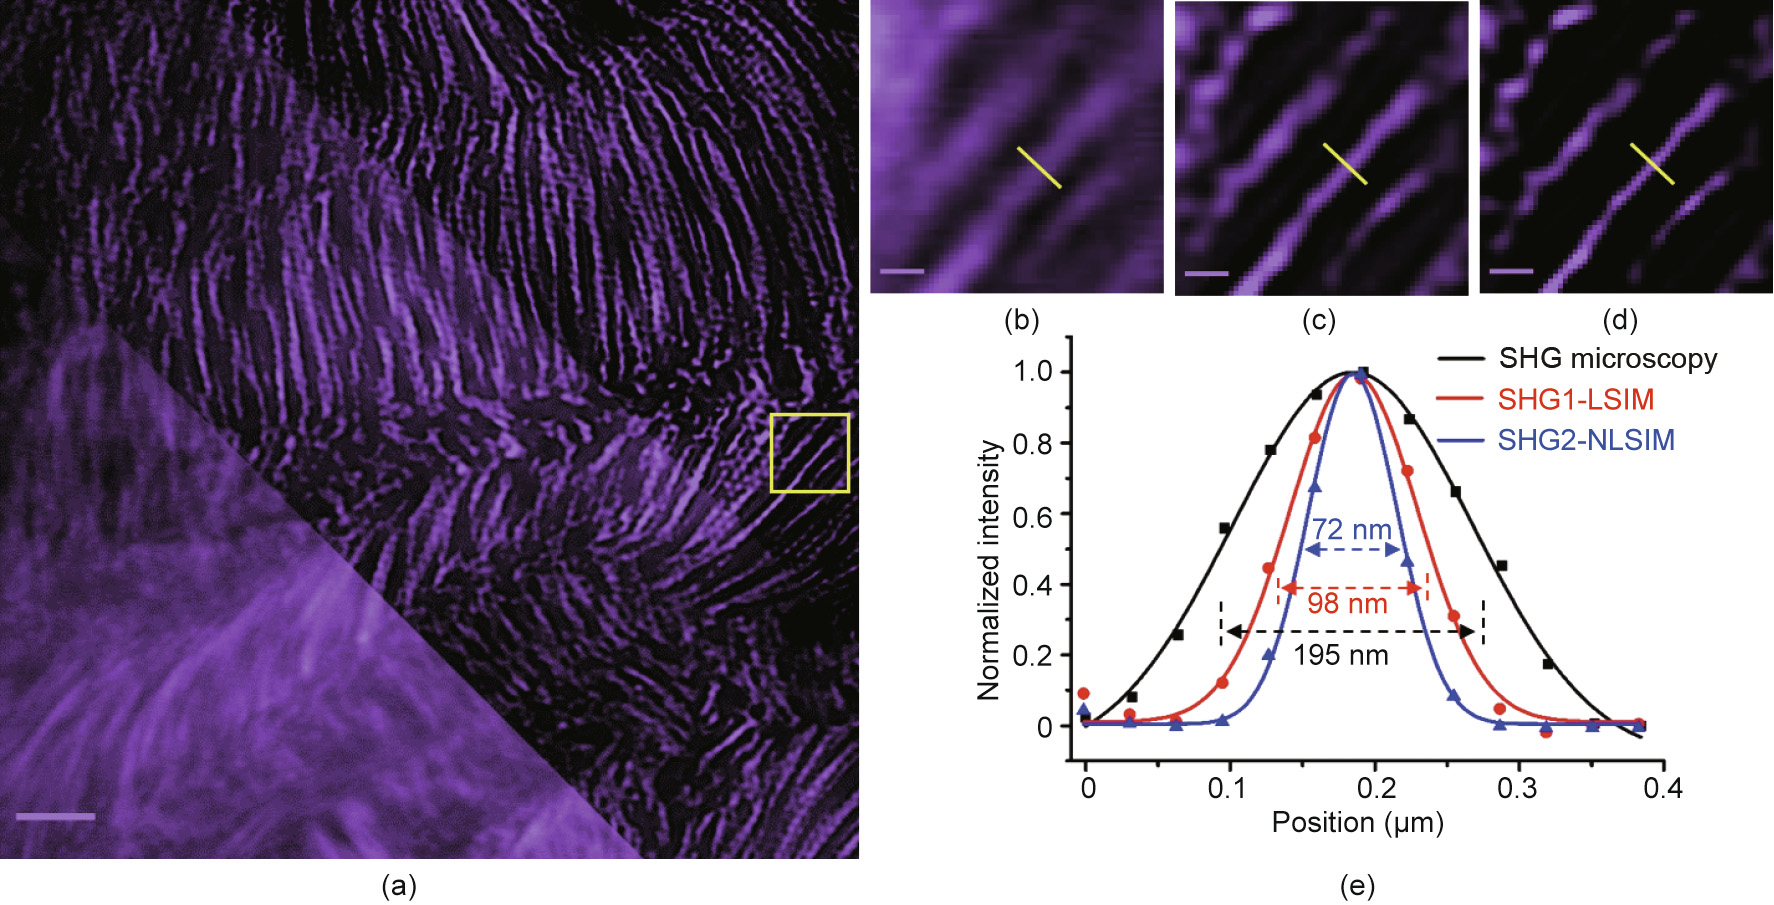
Fig. 4. Resolution and contrast improvement in SHG2-NLSIM. (a) Image of mouse-tail collagen fibres acquired via conventional SHG microscopy (lower left), SHG1-LSIM (middle), and SHG2-NLSIM (upper right). (b)–(d) Zoomed-in view of circled region in (a), highlighting resolution and contrast differences among images acquired via (b) conventional SHGM, (c) SHG1-LSIM, and (d) SHG2-NLSIM. (e) Intensity profiles along same yellow line in three images. Profiles show that FWHM values of conventional SHG microscopy, SHG1-LSIM, and SHG2-NLSIM are 195, 98, and 72 nm, respectively. Spatial period of scanning fluorescence fringes at fundamental frequency is 273 nm. Scale bar is 3 μm in (a) and 0.3 μm in (b)–(d).
《5. Discussion》
5. Discussion
Although super-resolution microscopy techniques have progressed rapidly in recent years, the development of the mP super-resolution microscopy technique has been slow. A method to improve the resolution of mP microscopy was presented herein, where the resolution improved as the nonlinear order m increased. Although some artefacts, which may have appeared owing to the improper choice of the Wiener factor used in the deconvolution performed by the Huygens Software (Scientific Volume Imaging, the Netherlands), were observed in the resolution images, to our knowledge, this is the first 2P-SIM or SHG-SIM that demonstrated an improvement by approximately three-fold in terms of the lateral resolution compared with the conventional 2P or SHG microscopy, based on applying the nonlinearities in the fluorescence response during the mP process. We demonstrated an 86 nm lateral resolution (almost three-fold improvement over the diffraction limit) for our 2P-SIM and a 72 nm lateral resolution for our SHG-SIM. Furthermore, our method afforded the following advantages: First, our mP super-resolution technique can be performed on existing mP microscopes by inserting a modulator to modulate the laser intensity. Second, our mP-SIM can be performed using typical fluorophores and the excitation light intensity of conventional 2P microscopes. Third, our super-resolution technique can be directly used in other coherent nonlinear optical microscopes, such as coherent anti-stokes Raman scattering (CARS) and stimulated Raman scattering (SRS). Whereas mP and SHG are different physical processes, 2P is an incoherent process with an incoherent PSF, and SHG is a coherent process with a coherent PSF; hence, we cannot apply SIM to SHG imaging to improve the resolution in the wide-field imaging mode [40,41]. However, for point-scanning SIM, the coherent characteristics of SHG are nullified when a time delay is introduced between adjacent spots. Therefore, we can directly apply SIM theory to improve the resolution of pointscanning SHG microscopy.
《6. Conclusions》
6. Conclusions
In this study, we first used the mP configuration to generate nonlinearities between fluorescence and excitation light without requiring a saturation excitation; therefore, the excitation power required was low. Second, we combined scanning with sinusoidal intensity modulation to generate fringe structured patterns in the sample plane. Owing to the nonlinear effect of the mP configuration, sinusoidal fringe structured patterns (such as ω) would trigger non-sinusoidal fluorescent structured patterns (such as 2ω for 2P). The fluorescence pattern was superimposed and mixed with the sample structures, and the mixed fluorescence information was detected directly by the PMT. Our system does not require a phase-locked detector as it can directly demodulate the harmonics [42]. Finally, the core of our image reconstruction algorithm is still based on the SIM reconstruction principle, but with increased harmonic contribution. Because of the nonlinear response of fluorophores in the mP process, the harmonics occurred first at the peak of the laser excitation; hence, they possessed fine structural information. For the mP SIM, the harmonics improved the resolution by up to (m + 1) times compared with the traditional mP microscopy. In our SIM reconstruction algorithm, the number of harmonics can be selected based on the resolution to be improved. The higher the resolution, the greater is the number of harmonics. However, to use more harmonics, more raw structured fluorescent images with different phases are required. For example, in our 2P2- NLSIM or SHG2-NLSIM, at least 15 frames of phase shift images (five images each direction) were required to reconstruct a super-resolution image with the theoretically isotropic resolution of approximately 74 or 58 nm, which corresponded to an improvement in resolution by three-fold. To improve the imaging speed, we expect the use of resonant scanners or multifocal excitation schemes in the future. Furthermore, imaging an area of interest using acousto–optical deflectors may increase the imaging speed.
《Acknowledgments》
Acknowledgments
This study was supported by the Project from the National Key Research and Development Program of China (2017YFB0403804), the National Natural Science Foundation of China (61775148 and 61527827), and the Shenzhen Science and Technology R&D and Innovation Foundation (JCYJ20180305124754860 and JCYJ20200109105608771).
《Compliance with ethics guidelines》
Compliance with ethics guidelines
Lei Wang, Xiaomin Zheng, Jie Zhou, Meiting Wang, Jiajie Chen, Youjun Zeng, Gaixia Xu, Ying Wang, Haixia Qiu, Yonghong Shao, Junle Qu, Bruce Zhi Gao, and Ying Gu declare that they have no conflict of interest or financial conflicts to disclose.
《Appendix A. Supplementary data》
Appendix A. Supplementary data
Supplementary data to this article can be found online at https://doi.org/10.1016/j.eng.2021.12.010.


 京公网安备 11010502051620号


