
《1. Introduction》
1. Introduction
Supported noble-metal nanocatalysts have long been subjected to academic investigation and used industrially, demonstrating excellent catalytic performance in the fields of energy and the environment [1,2]. Since catalytic behavior is mainly determined by the electronic structure of such catalysts [3], there is an imperative demand to radically improve the metal utilization efficiency; thus, extensive exploration in engineering the electronic metal– support interaction has taken place [4]. Strong metal–support interaction (SMSI) is widely recognized as having a remarkable influence on the electronic properties of a supported metal through covalent bonding with metal oxides [5]. However, harnessing the electronic properties of a metal via oxide support is usually limited to empirically selecting one of a few reducible metal oxides due to the simultaneous size, shape, strain, and proximity effects from SMSI [6,7]. Therefore, it is highly desirable to isolate these concomitant effects in order to fundamentally exploit the transfer of electrons across the metal–support interface to obtain superior catalytic performance.
Nanocarbons possess excellent electron conductivity along with tunable surfaces and bulk structures, which make them distinctively different from conventional metal oxides as a catalyst support; thus, the use of nanocarbons opens up unprecedented opportunities to manipulate the electronic properties of the supported metal [8,9]. The inherent chemical inertness of carbon would also be helpful in disentangling the electronic effects from the geometric and bifunctional effects within SMSI [7], making carbon a good candidate for studies on the electron transfer between a metal catalyst and its support. Recently, numerous studies on metal–carbon catalysts have revealed that multiple factors—such as heteroatom-containing groups, surface defects, and dopants— can cause variations in the catalytic performance [8–10]. However, fine-tuning the metal electronic structure by engineering the carbon surface chemistry remains challenging due to entangled factors such as support polarity, curvature, and textural properties [11–15]. In other words, it is still difficult to decouple and quantify the contribution of the electronic factors from the carbon support’s inherent structural and chemical complexity. Rationally designed and judiciously interpreted experiments are necessary in order to scrutinize the effects of electronic factors and achieve the precise engineering of carbon-supported catalysts.
Heterogeneous catalysis is a typical kinetics phenomenon [16]. Traditionally, there are two widely studied kinetic analyses: macrokinetics, which involves reaction rate (r) as a function of temperature (T) and concentration (C), that is, r =  ; and microkinetics, which involves the microscopic catalyst surface adsorption/reaction information. These kinetics respectively serve as the foundation for reactor design and for catalyst development [16–20]. With the advancement of computational chemistry and characterization techniques, the nature of catalytic active sites at the nanoscale, including factors such as size, charge, and composition, has been widely recognized as the basis for catalyst design, as it determines the intrinsic turnover frequency (TOF) and the resultant reaction rate [21,22]. However, the above two forms of kinetic modeling are rarely correlated with the properties of catalytic active sites, due to the challenges in discriminating and quantifying them for practical catalytic processes [23,24]. Therefore, much remains to be learned from reaction mechanisms and kinetics to develop a more specific and meticulous kinetics modeling that involves the geometric and electronic properties of catalytically active sites, which can provide principles for the rational design and manipulation of metal catalysts.
Herein, we report a precise engineering strategy for the carbon surface chemistry of Pt/C catalysts—that is, for electronwithdrawing/donating oxygen-containing groups (OCGs) on the support surface—to tame the electronic properties of the supported platinum (Pt). This strategy results in a 15-fold increment in the catalytic hydrogen evolution rate for ammonia borane (AB) hydrolysis—a reaction whose remarkable structural sensitivity has made it a prototypical reaction for gaining a fundamental understanding of the relationship between catalyst structure and performance [25–28]. In our strategy, the qualitative correlation among the carbon surface chemistry, Pt electronic properties, activation entropy/enthalpy, and catalytic activity reveals the Pt charge state to be the descriptor of the Pt active sites. By further incorporating this qualitative correlation with the number of Pt active sites, we propose a newly developed mesokinetics model for the first time. Our model can well describe the macroscopic catalytic performance to enable the rational design and manipulation of a Pt/C catalyst with descriptor-based kinetic parameters linked to the microscopic geometric and electronic properties of active sites.
《2. Experimental procedures》
2. Experimental procedures
《2.1. Catalyst preparation》
2.1. Catalyst preparation
Pristine and closed-end carbon nanotubes (CNTs; Beijing Cnano Technology Ltd., China) were functionalized by means of mixedacid oxidation using 8 mol∙L–1 of HNO3 (65%, Shanghai Lingfeng Chemical Reagent Co., Ltd., China) combined with 8 mol∙L–1 of H2SO4 (98%, Shanghai Lingfeng Chemical Reagent Co., Ltd.) in an ultrasonic bath at 60 °C for 2 h [12]. After the acid oxidation, the as-obtained CNTs were filtered, washed, and dried at 120 °C for 12 h. To change the types and concentrations of OCGs, the oxidized CNTs were further treated with different temperatures of 200, 400, 600, 800, and 1000 °C under an argon (Ar) atmosphere for 2 h. The resultant CNTs were denoted as CNT-X, where X refers to the heat treatment temperature.
The catalysts were prepared by mixing the above CNT-X with H2PtCl6 solution (Sinopharm Chemical Reagent Co., Ltd., China) with a Pt loading of 1.5 wt%. In addition, three Pt/CNT catalysts with distinct loadings (0.3 wt%, 0.8 wt%, and 1.2 wt%) were prepared using pristine CNTs as the catalyst support for comparison. The as-prepared catalyst precursors were further dried under stagnant air at room temperature, followed by drying at 120 °C for 12 h. Reduction of the catalysts was carried out by heating them to 250 °C under a hydrogen (H2) atmosphere and then maintaining them at that temperature for another 2 h. The gas was switched to Ar before the catalysts cooled down and was then switched to 1% oxygen/argon (O2/Ar) for catalyst passivation.
《2.2. Catalyst characterization》
2.2. Catalyst characterization
The textural properties of the CNT-X were determined by means of nitrogen (N2) physisorption using a Micrometrics ASAP 2020 (Micromeritics, USA) at –196 °C. The contents of the OCGs on the CNT-X were analyzed using thermogravimetric analysis (TGA) conducted on an SDT-Q600 system (TA Instruments, USA). Raman spectra of these CNT-X were collected using a LabRAM HR system (Horiba, France). Temperature-programmed desorption mass spectrometry (TPD-MS) measurements were carried out on an AutoChem II 2920 (Micromeritics). The distribution and average size of the Pt particles were determined by means of high-angle annular dark-field imaging scanning transmission electron microscopy (HAADF-STEM) on a Tecnai G2 F20 S-TWIN (FEI Company, USA). Aberration-corrected HAADF-STEM (AC-HAADF-STEM) images were obtained on a JEOL ARM200F (JEOL, Japan) with a scanning transmission electron microscopy (STEM) aberration (Cs) corrector operated at 200 kV. X-ray photoelectron spectroscopy (XPS) measurements were taken on a Kratos XSAM 800 spectrometer (Kratos, UK). Fourier-transform infrared (FTIR) spectra were obtained on a PerkinElmer Spectrum 100 FTIR spectrometer (PerkinElmer, USA). The Pt LIII-edge X-ray absorption fine structure (XAFS) of these catalysts was investigated at the BL14W1 beam line in the Shanghai Synchrotron Radiation Facility (SSRF), China. The energy was calibrated according to the absorption edge of pure Pt foil. Athena and Artemis codes were used to extract the data and fit the profiles. For the X-ray absorption near-edge structure (XANES) part, the experimental absorption coefficients as a function of the energies μ(E) were obtained by means of background subtraction and normalization procedures [29]. For the extended X-ray absorption fine structure (EXAFS) part, the Fourier-transformed (FT) data in R space were analyzed for Pt–O, Pt–Cl, and Pt–Pt contributions. The fitted ranges for the k and R spaces were selected to be k = 3–11 Å–1 (1 Å = 10–10 m) with R = 1.0–3.0 Å (k3 weighted).
《2.3. Catalytic testing》
2.3. Catalytic testing
The AB hydrolysis using these catalysts was performed in a three-necked flask with a magnetic stirrer. A certain amount of catalyst was preloaded into the flask. The reaction was started by introducing the AB solution into the flask at a stirring speed of 900 r∙min–1 . For the different catalysts, the molar ratio of Pt to AB (nPt/nAB) was kept at 0.0047. Moreover, to probe the underlying kinetic information of these catalysts, a kinetic isotope experiment was conducted under the same reaction conditions using D2O as the reactant.
《2.4. Density functional theory calculations》
2.4. Density functional theory calculations
All density functional theory (DFT) calculations were performed using the Vienna ab initio simulation package (VASP) [30–33] within the generalized gradient approximation (GGA) using the Perdew–Burke–Ernzerhof (PBE) functional [34,35]. The optB86bvdW [36] functional was employed to evaluate the interaction between the molecules and the CNT substrate [37]. We used a cutoff energy of 400 eV (1 eV = 1.602176 × 10⁻¹⁹ J) for the Kohn–Sham orbitals, a Monkhorst–Pack grid for the k-point sampling in the Brillouin zone, and Gaussian smearing with a width of 0.05 eV [38]. In all models, the geometry optimizations were conducted using a conjugated gradient method [39]. The saddle points and minima were considered to reach convergence once the maximum force in each degree of freedom was less than 0.03 eV∙Å–1 . A fast algorithm operating on a charge density grid was carried out for the Bader charge analysis [40,41]. The resultant charge density difference was plotted using the visualization for electronic and structural analysis (VESTA) software. All the supported Pt adatom models were placed on a periodic CNT structure with a 1 × 1 × 4 supercell (11.48 Å × 11.48 Å × 9.84 Å). A 1 × 1 × 1 Monkhorst–Pack k-point mesh within the surface Brillouin zones was used for these models.
《3. Results and discussion》
3. Results and discussion
《3.1. DFT calculations of electron transfer between the Pt and its C support》
3.1. DFT calculations of electron transfer between the Pt and its C support
To obtain excellent physicochemical properties, functionalization of the carbon support before metal immobilization is widely applied during catalyst preparation; during functionalization, various OCGs can be integrated on the support’s surfaces [42]. Notably, the question of whether and how these OCGs affect the resultant properties of the supported metal particles remains open for discussion. To start with, we chose a carbonsupported Pt catalyst, as the most investigated noble metal catalyst, for our model to study the metal–carbon synergy. DFT calculations were first performed to theoretically investigate the influences of four typical OCGs—namely, carbonyl, hydroxyl, carboxyl, and ester groups—on the geometric and electronic properties of the supported Pt. The Pt10 adatoms immobilized on the CNTs became incorporated with these OCGs, in comparison with a pure CNT support like those constructed for computational simulations, as illustrated in Fig. 1(a). It is obvious that the Pt adatom(s) tend to bond with the OCGs, which is consistent with the OCGs acting as anchoring sites for metal immobilization [43].
Accordingly, the changes in the electronic density spatial distribution for these different complexes were compared. Fig. 1(a) depicts the corresponding differential electron density isosurfaces of the Pt10 adatoms. Taking Pt10 adatoms on pure CNTs as the benchmark, the figure clearly shows that the electron density decreases for Pt10 adatoms supported on carbonyl-, carboxyl-, or ester-incorporate carbon, but it increases for Pt10 adatoms supported on hydroxyl-incorporated carbon. The Bader charge analysis suggests that the Pt10 adatoms supported on pure CNTs have almost no charge, indicating negligible electron transfer between the Pt10 adatoms and pure CNTs. For the carbonyl-, hydroxyl-, carboxyl-, and ester-incorporated CNTs, the corresponding charge of the whole Pt10 adatoms was calculated to be +0.33, –0.06, +0.36, and +0.35 electrons, respectively, as shown in Fig. 1(a). Hence, from a theoretical perspective, the carbonyl-, carboxyl-, and ester-incorporated CNTs act as an electron acceptor, in comparison with the hydroxyl-incorporated CNTs, which serve as an electron donor. This finding granted us an excellent opportunity and advantage for manipulating the electronic properties of Pt by engineering its surrounding environment in terms of OCGs.
《3.2. Remarkable support effects from different surface OCGs》
3.2. Remarkable support effects from different surface OCGs
To experimentally investigate the influences of OCGs, mesoporous and closed-end CNTs were selected as the carbon support. In this way, we excluded the influence of the carbon bulk structure, Pt location/confinement, and diffusion limitation [12,13,25]. Pristine CNTs were activated and functionalized with OCGs via mixed-acid oxidation, which was followed by annealing under an inert atmosphere at gradually elevated temperatures (i.e., 200, 400, 600, 800, and 1000 °C) to selectively remove these OCGs, as schematically shown in Fig. 1(b). As mentioned earlier, the partially deoxygenated CNTs were denoted as CNT-X, where X refers to the heat treatment temperature. The textural properties of these as-prepared CNTs were characterized by means of N2 physisorption, as summarized in Appendix A Table S1. Clearly, not only the specific surface areas but also the total pore volumes of these CNTs remained almost unchanged, indicating the limited influence of heat treatment on their textural properties by heat treatment.
Raman and TGA measurements were further conducted to characterize the structural properties of these CNTs. Fig. S1 in Appendix A displays the Raman spectra with three obvious bands around 1345, 1580, and 1610 cm–1 , which can be ascribed to the disordered graphitic lattice (graphene layer edges, D1), ideal graphitic lattice (G), and disordered graphitic lattice (surface graphene layers, D2), respectively [44]. Therefore, the integral area ratio of D1 to G band (ID1/IG) was employed to quantify the surface defects. As shown in Fig. 1(c), a clear trend is visible in which ID1/IG starts at 1.61–1.46 upon heat treatment at 200 °C and then increases to 1.73 at 400 °C, after which it remains almost unchanged with further increases in temperature.
《Fig. 1》

Fig. 1. (a) Optimized structures and differential electron density isosurfaces for Pt10 adatoms supported on a pure CNT support and on CNT supports incorporated with carbonyl, hydroxyl, carboxyl, and ester groups. The yellow and light blue isosurfaces correspond to the electron increase and depletion zones, respectively. (b) Schematic procedure for the preparation of CNT-X. (c) OCG content and integral area ratio of D1 to G band (ID1/IG) value of CNT-X. (d) Pt binding energy (BE) and particle size. (e) Catalytic activity and durability of Pt/CNT-X (rinitial: initial hydrogen generation rate; r5th/r1st: the ratio of the activity in the fifth run to that in the first run).
Based on these findings, the following deductions can be made: ① The low temperature promotes the saturation of some dangling bonds at the edge sites and increases the degree of graphitization; ② the medium temperature eliminates a majority of OCGs and significantly introduces surface defects; and ③ further high temperatures have only a limited influence on the structural properties. This trend, given the similar amounts of defects, provides a valuable opportunity to fundamentally understand the effects of OCGs. Moreover, the TGA curves for these CNTs, as presented in Appendix A Fig. S2, exhibit different weight losses at temperatures above 120 °C due to the decomposition of OCGs. Hence, as summarized in Fig. 1(c), the amounts of OCGs were determined to be 7.9 wt%, 4.8 wt%, 2.7 wt%, 0.9 wt%, 0.5 wt%, and 0.4 wt% for CNT-0, CNT200, CNT-400, CNT-600, CNT-800, and CNT-1000, respectively, which are consistent with the Raman analysis. The above analyses suggest that heat treatment can remove a majority of OCGs and simultaneously create surface defects at around 400 °C. Further increasing the temperature can tailor the type and amount of the remaining OCGs while having a negligible influence on the surface defects.
Based on these analyses, a series of CNTs with remarkably different OCGs were prepared, as good candidates for catalyst supports, in order to study their interactions with Pt particles and the resultant catalytic performance. We chose AB hydrolysis to produce hydrogen over the Pt/CNT catalysts as the probe reaction, since it has high structure sensitivity and exhibits strong Pt particle size-dependent catalytic activity [25–28]. To acquire definite information on the support effects, supported Pt catalysts were prepared, each with the same loading of 1.5 wt%. HAADF-STEM was employed to characterize these catalysts, as depicted in Appendix A Fig. S3. The average Pt particle size was found to be almost unchanged in the different catalysts, as summarized in Fig. 1(d), which helped to exclude the effects of Pt particle size.
As Fig. S4 in Appendix A clearly shows, these catalysts exhibited significantly different catalytic behaviors. The corresponding initial hydrogen generation rate (rinitial) was calculated based on the zero-order reaction kinetics. As shown in Fig. 1(e), the rinitial appears to exhibit a typical volcano-shaped dependence on the temperature of the heat treatment, with Pt/CNT-400 delivering the highest rinitial of 811.3  , which is more than 15 times higher than that of Pt/CNT-0. A comparison of Pt/CNT-400 with the monometallic Pt-based catalysts reported in previous studies was conducted and is shown in Appendix A Table S2. Among these catalysts, Pt/CNT-400 still demonstrates the highest catalytic activity for a similar particle size.
The AC-HAADF-STEM images of these catalysts, as shown in Appendix A Fig. S5, reveal the existence of a few single Pt atoms spread over the support surfaces. To investigate the influence of these single atoms, catalysts with a much lower Pt loading (0.05 wt%), which should involve abundant single Pt atoms, were prepared and tested for the AB hydrolysis reaction. As shown in Appendix A Fig. S6, all of these low-Pt-loaded catalysts demonstrated much lower activity; thus, the influence of the single Pt atoms could be neglected.
The durability of the catalysts was also evaluated, as shown in Appendix A Fig. S7. For a fair comparison, the ratio of the activity in the fifth run to that in the first run (r5th/r1st), was employed as a criterion of durability, as shown in Fig. 1(e). It is clear that the Pt/CNT-400 catalyst delivers both the highest activity and the greatest durability among all these catalysts. These results demonstrate that tailoring the heat treatment of CNTs as a Pt catalyst support is a facile and efficient approach to achieve robust hydrogen generation for AB hydrolysis.
《3.3. Pt–carbon electronic synergy》
3.3. Pt–carbon electronic synergy
Considering the similar textural and structural properties of these catalysts, it is tempting to attribute the significant improvement in the hydrogen generation performance to their electronic effects. XPS measurement was conducted to investigate their electronic properties, and the obtained Pt 4f spectra were further deconvoluted, as shown in Fig. S8 in Appendix A. Clearly, all the catalysts involve both the metallic state of Pt0 and the ionic states of Pt2+ and Pt4+; the relative percentages of the Pt species are summarized in Appendix A Table S3, which shows that the catalysts exhibit similar Pt0 species percentages of about 70%. Interestingly, shifts in the Pt binding energy (BE) were detected among the catalysts. Taking the Pt0 4f7/2 spin–orbit peak as an example, the corresponding Pt BE exhibits a volcano curve with the heat treatment temperature, as shown in Fig. 1(d), rising from 71.75 eV for Pt/ CNT-0 to the maximum of 72.07 eV for Pt/CNT-400 and then continuously declining to 71.92 eV for Pt/CNT-1000, according to the trends in activity and durability shown in Fig. 1(e). In light of the similar Pt particle size and high electron conductivity of the CNTs, the observed lowest Pt BE, which occurs for Pt/CNT-0, mainly originates from the Pt valence band that is filled with electrons donated by CNT-0; the opposite is true for Pt/CNT-400, which has the highest Pt BE.
To confirm this trend, the XAFS technique was employed to investigate the structural and electronic properties of the catalysts. Fig. 2(a) displays the normalized Pt LIII-edge XANES spectra of these Pt catalysts, along with reference materials for the Pt0 (Pt foil) and Pt4+ (PtO2) standards. The white-line peak around 11 568 eV can be clearly identified. Thus, based on the relationship between the ionic valence and the white-line intensity of the reference compounds, the average charge state of the Pt in these catalysts was calculated to be +0.71, +0.87, +1.07, +0.90, +0.91, and +0.88, respectively. Unexpectedly, a good linear relationship was obtained between the Pt BE, as determined by XPS, and the Pt charge state, as determined by XANES, as shown in Fig. 2(b). This high consistency further validates the above analysis of the Pt electronic properties of these catalysts. Moreover, the trend in the Pt charge shown in Fig. 2(a) and in Appendix A Table S4 is quite consistent with the catalytic performance shown in Fig. 1(e), which strongly suggests that the Pt charge, as an indication of the Pt electronic properties, is the main cause for the improvement in hydrogen generation. This will be briefly discussed in the following section.
Fig. 2(c) displays the FT Pt LIII-edge k3 -weighted EXAFS spectra, and the structural parameters obtained through the EXAFS fittings are listed in Table S4. Three major contributions can be observed at distances of about 1.94, 2.25, and 2.73 Å, respectively, which originate from the shells of Pt–O, Pt–Cl, and Pt–Pt, respectively. The similar values for the Pt–Pt coordination number (CN) at around four strongly suggest similar Pt particle sizes (~1 nm), based on a previously reported method [45], which is in good agreement with the HAADF-STEM results. Moreover, these catalysts exhibit similar Pt–Cl CNs, whose influence on the structural and electronic properties could be similar for these catalysts. Consequently, a combination of EXAFS and HAADF-STEM strongly suggests that these catalysts have similar particle sizes, which helps to decouple the electronic properties measured by XPS and XANES as the main cause for the volcano-shaped catalytic performance.
《Fig. 2》
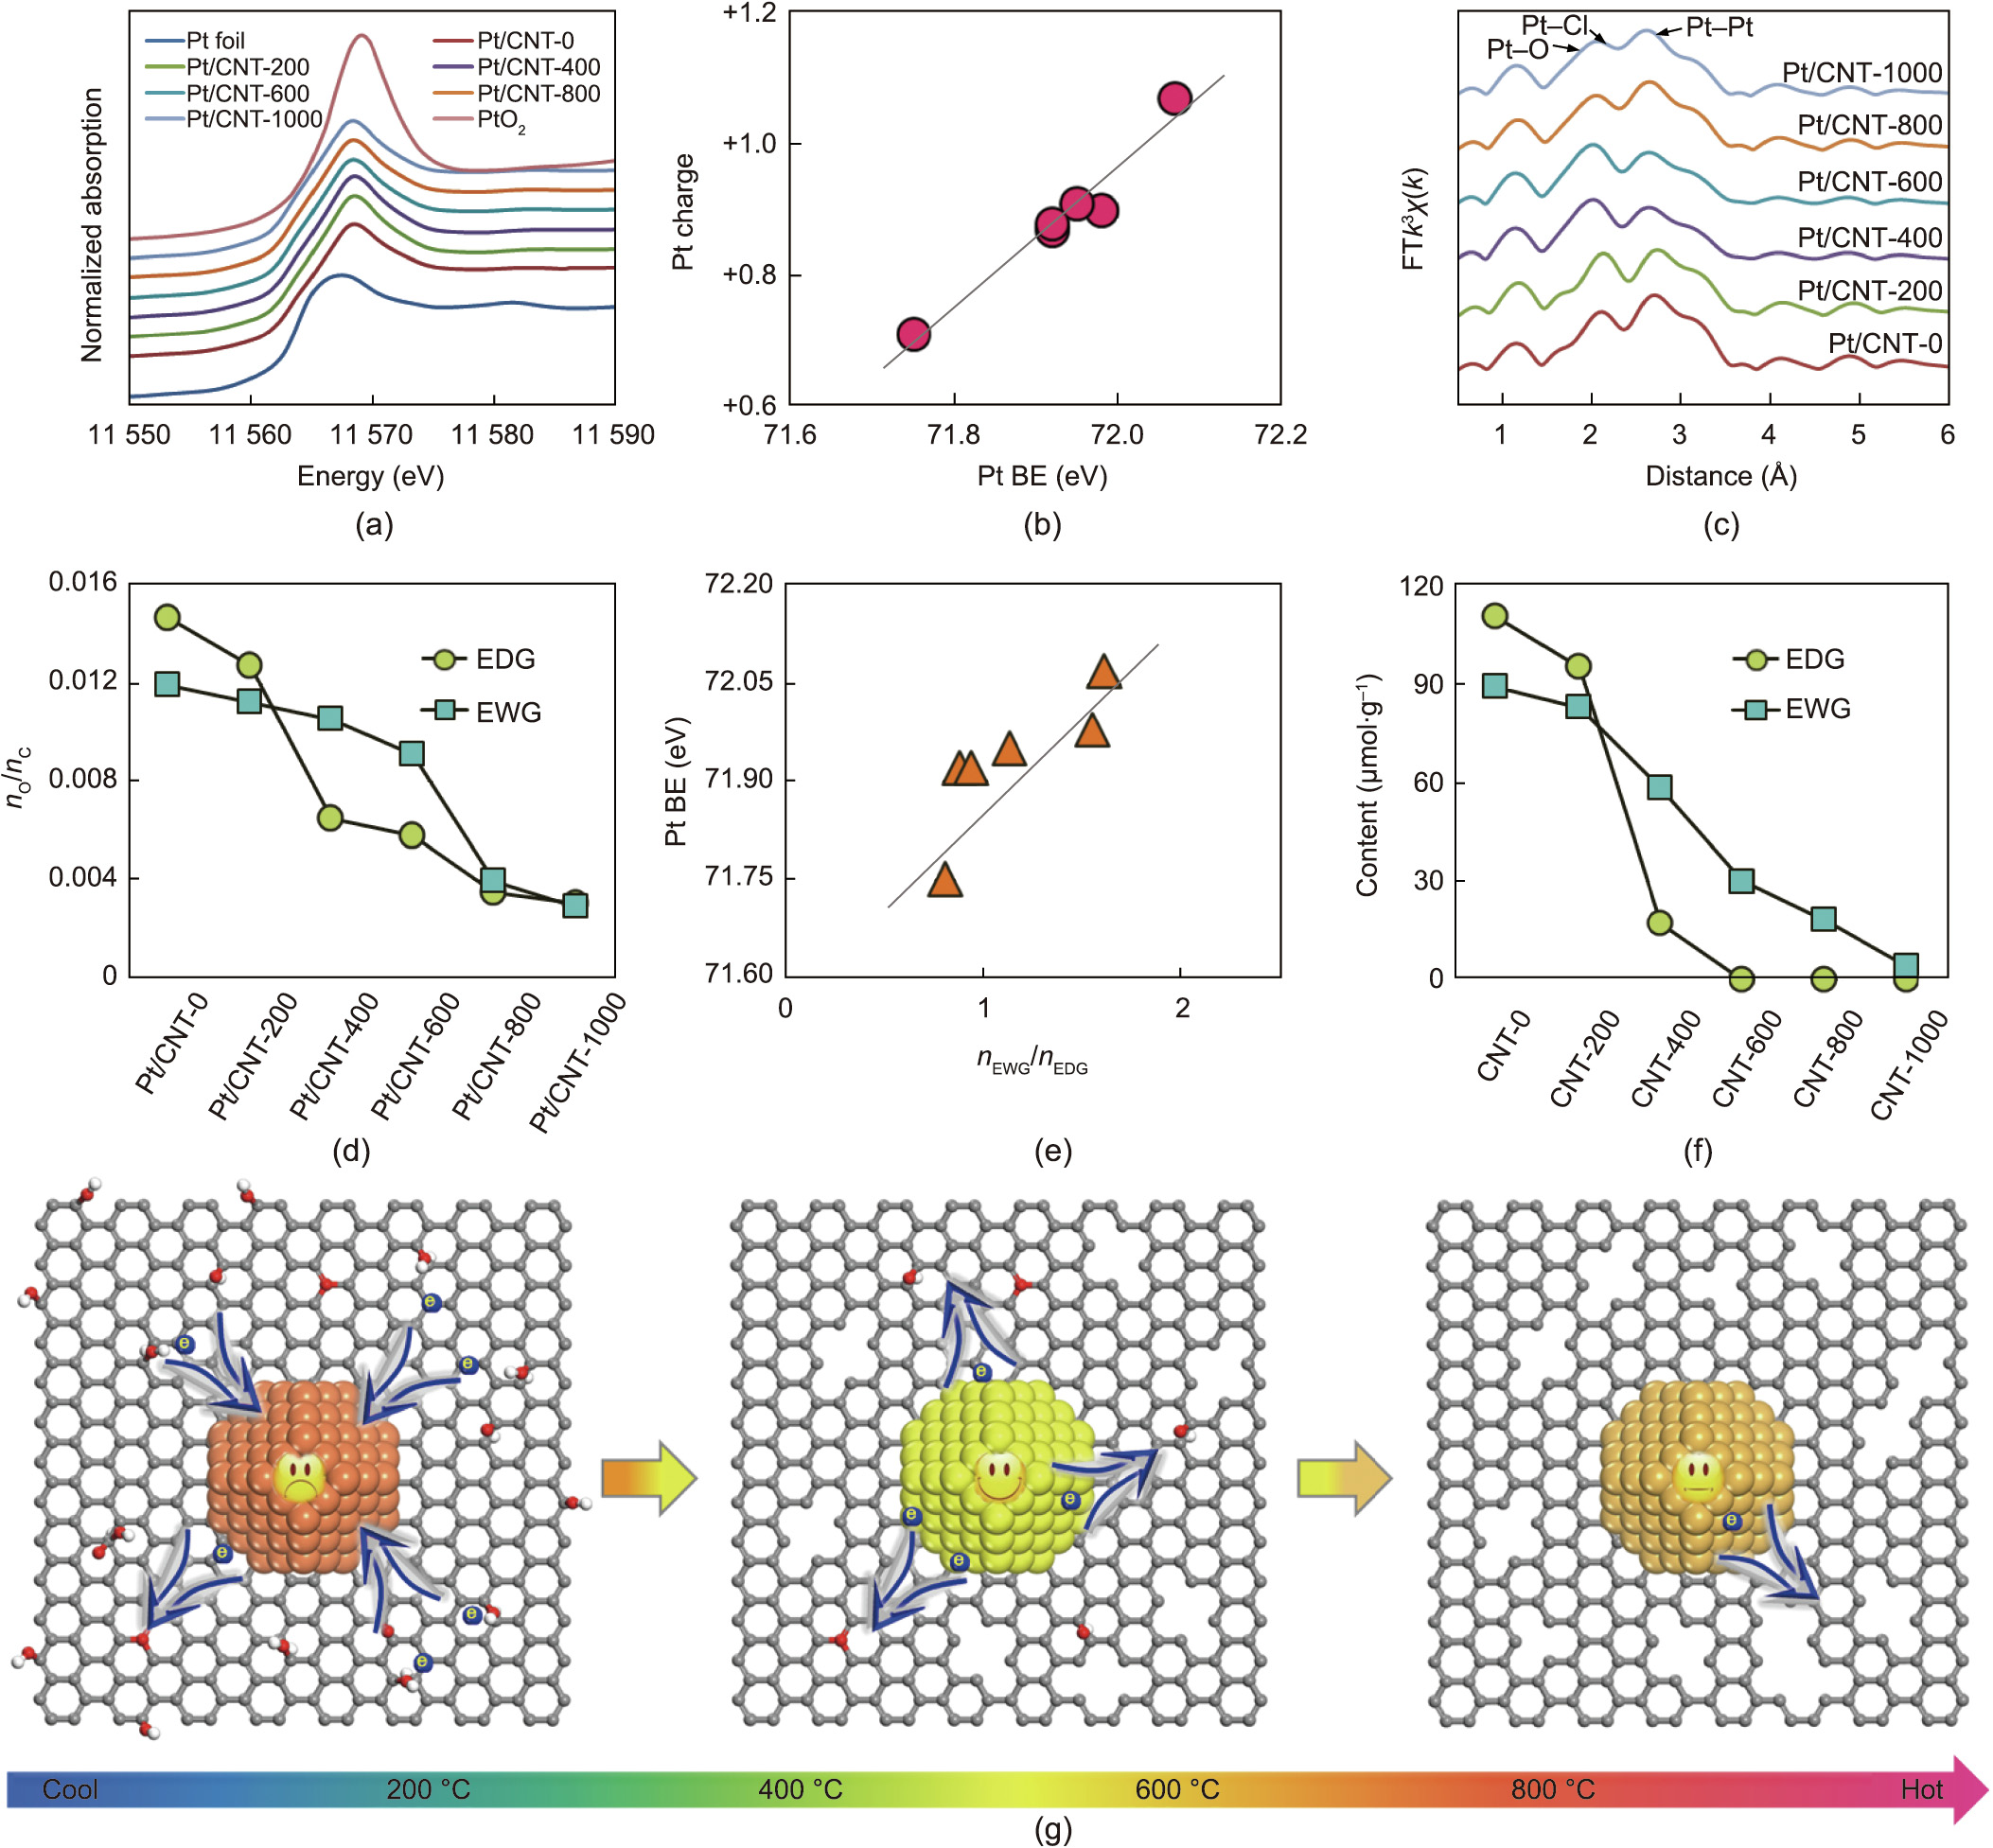
Fig. 2. (a) Pt LIII-edge XANES spectra; (b) relationship between Pt charge and Pt BE; (c) EXAFS fitting results in R space; (d) oxygen-to-carbon molar ratios (nO/nC) of electrondonating groups (EDGs) and electron-withdrawing groups (EWGs) for Pt/CNT-X; (e) relationship between Pt BE and the molar ratio of EWGs to EDGs, nEWG/nEDG, for these catalysts; (f) contents of EDGs and EWGs for CNT-X; (g) schematic diagram of the electron transfer between Pt and CNTs under heat treatment at different temperatures.
Considering their strong electron-withdrawing/donating ability, the OCGs of these catalysts were analyzed by XPS and the asobtained O 1s spectra (Appendix A Fig. S9) were deconvoluted according to the different oxygen binding energies:  groups at (531.1 ± 0.1) eV (oxygen atoms in carbonyls); O–H groups at (532.3 ± 0.1) eV (oxygen atoms in hydroxyls); ether oxygen atoms in esters and anhydrides at (533.5 ± 0.1) eV; and oxygen atoms in carboxyl groups at (534.4 ± 0.1) eV [46]. Based on the above DFT results for the electrophilicity, these OCGs were categorized into electron-withdrawing groups (EWGs)—including carbonyl, carboxyl, and ester groups—and electron-donating groups (EDGs)— namely, hydroxyl groups. The amounts of these two groups are summarized in Table S5 in Appendix A and are further plotted with the temperature in Fig. 2(d). Clearly, for the oxidized CNT-0, the OCGs are mainly EDGs. The EWGs gradually dominate the OCGs with the heat treatment temperature, and the difference between these two groups reaches the maximum at 400 °C. Hence, the competition between EWGs and EDGs, nEWG/nEDG, could be the main reason for the variable Pt charge and Pt BE, as shown in Fig. 2(e).
To test this tendency, FTIR and TPD-MS were employed to characterize the OCGs. As shown in Appendix A Fig. S10, all these CNTs display almost identical FTIR spectra, possibly due to the strong adsorption peak ascribed to H2O overlapping with those of other groups. In contrast, the TPD-MS profiles shown in Appendix A Fig. S11 exhibit significant differences in the types and concentrations of OCGs, which were further deconvoluted, as shown in Appendix A Fig. S12 [47]. Similarly, these OCGs were categorized into EWGs and EDGs; their contents are summarized in Table S6 in Appendix A and plotted with the heat treatment temperature in Fig. 2(f). Similar trends of EWGs and EDGs can be found for the TPD-MS analysis, further confirming nEWG/nEDG as the predominant reason for the volcanic Pt BE in Fig. 1(d), as well as the resultant volcanic catalytic activity in Fig. 1(e). It is notable that the similar surface defects in Pt/CNT-400 to Pt/CNT-1000, as reflected by the Raman results, suggest the similar yet limited influence of surface defects on the electronic properties of Pt and the resultant catalytic activity. As depicted in Fig. 2(g), the abundant EWGs in comparison with EDGs over the CNT-400 surface capture more electrons from Pt particles, giving rise to the highest Pt BE (Fig. 1(d)). Further increasing the temperature will narrow the difference between the EWGs and EDGs, and thus continuously lower the Pt charge as well as the Pt BE, as shown in Fig. 1(d).
《3.4. Kinetics-assisted identification of the catalytic descriptor》
3.4. Kinetics-assisted identification of the catalytic descriptor
The paramount influence of the electronic properties of Pt on the catalytic performance of Pt/CNT catalysts, which has been qualitatively interpreted from a combination of theoretical calculations and multiple characterizations, has emerged as a key topic in heterogeneous catalysis. In general, the electronic properties of the metal in a metal-based catalyst have been suggested to be the key factor in determining the binding strength between the metal particles and the adsorbed intermediates, as well as in determining the resultant catalytic properties [48]. However, from an experimental perspective, a quantitative description of the binding strength of the reaction species with respect to the electronic properties of the metal and the resultant performance of the catalyst is still lacking. Hence, we made an attempt to identify the catalytic descriptor by correlating the electronic properties of Pt with the kinetic behaviors. Fig. S13 in Appendix A displays the hydrogen evolution of these catalysts at 25–40 °C, which yields the reaction rate constant (kH) for the characteristic zero-order reaction. The corresponding Arrhenius plot in Fig. 3(a) gives the activation energy (Ea) of these catalysts, as shown in Fig. 3(b), among which Pt/CNT-400, which exhibits the highest catalytic activity, shows the lowest Ea.
《Fig. 3》

Fig. 3. (a) Arrhenius plots between lnkH and 1/T, (b) activation energy (Ea), and (c) kinetic isotope effect (KIE, kH/kD) values for Pt/CNT-X. (d–f) Correlations between (d) lnAi and Ea, (e) activation entropy ( ) and activation enthalpy (
 ), and (f) rinitial and for Pt/CNT-X, 0.3-Pt/CNT, 0.8-Pt/CNT, and 1.2-Pt/CNT. (g) Correlation between and Pt charge. (h) Correlation between and Pt charge. (i) Experimental and predicted TOF as a function of Pt charge.
Kinetic isotope experiments were also conducted under the same reaction conditions by comparing the reaction rate using H2O and D2O, respectively, as the reactant in order to probe the underlying kinetics information. As shown in Appendix A Fig. S14, all these catalysts exhibit a much lower hydrogen generation rate when using D2O as the reactant. The corresponding rate constant (kD) was determined, as described earlier, and the reaction rate constant ratio (kH/kD) using H2O and D2O, respectively, as the reactant was employed to evaluate the ability to activate water [49]. The reaction rate constant ratio was found to be around 2.2 for all these catalysts, as shown in Fig. 3(c). Considering the relatively large yet almost unchanged kinetic isotope effect (KIE) values, these findings indicate that all the catalysts are very likely to have the same rate-determining step and reaction mechanism, which makes it possible to ensure a fair comparison and thus fundamentally understand the kinetics.
Interestingly, the logarithm of the pre-exponential factor (Ai) for the six catalysts in Appendix A Table S7, as determined from the Arrhenius plots, exhibits a linear dependence on the corresponding Ea, as shown in Fig. 3(d). To verify whether this linear relationship is true or an accidental coincidence, we prepared another three Pt/ CNT catalysts with different Pt loadings of 0.3 wt%, 0.8 wt%, and 1.2 wt% and respectively denoted them as 0.3-Pt/CNT, 0.8-Pt/ CNT, and 1.2-Pt/CNT. As before, HAADF-STEM and XPS measurements were conducted to characterize the catalysts’ structural (Fig. S15 in Appendix A) and electronic properties (Fig. S16 in Appendix A), respectively. The three catalysts were then tested for the AB hydrolysis reaction, as shown in Appendix A Fig. S17. Using the same method, the Ea and lnAi of these three catalysts were calculated, as shown in Table S7. As shown in Fig. 3(d), when these three new catalysts were taken into consideration along with the previously tested catalysts, all the catalysts exhibited good linearity. This finding strongly suggests that the observed linear relationship between lnAi and Ea is true, instead of being an accidental coincidence, and can be interpreted as kinetic compensation effects, according to the Cremer–Constable relation [21]:

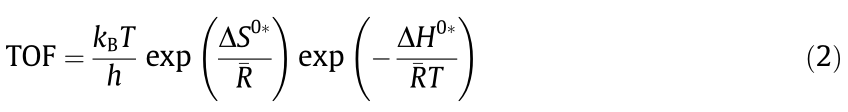
where  is the slope on the plot between lnAi and Ea and b is the intercept. From a classical perspective, this relation can be interpreted as a thermodynamic balance between the activation enthalpy () and the activation entropy (). In order to calculate and , the TOF can be expressed as the Eyring form [21]:
where kB, T, h, and  are the Boltzmann constant, absolute temperature, Planck constant, and gas constant, respectively. Moreover, can be related to Ea based on the Temkin equation [50]:

where  are the adsorption enthalpies and reaction order of reactant i, respectively. Because zero-order reaction kinetics were observed, Eq. (3) could be written as follows:

Therefore, the of these catalysts can be calculated, as shown in Table S8 in Appendix A. In addition, the TOF can be expressed as follows:

where ka is the reaction rate constant, and  is the dispersion of the active sites—that is, the Pt(111) atoms—and can be calculated according to our previous study [25], as shown in Table S9 in Appendix A. Combining Eqs. (2)–(5) and the Arrhenius equation
 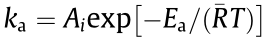 gives the following:

Hence, the of these catalysts can be calculated, as summarized in Table S8, and can be linearly correlated with the corresponding shown in Fig. 3(e). In general, quantifies the energy change from the ground state of the reactants to the transition state, and quantifies the loss of freedom of the reactants upon adsorption. The observed compensatory relationship between and shown in Fig. 3(e) indicates that the catalyst (e.g., Pt/CNT-400) that causes the largest loss of freedom of the reactants upon adsorption will have the lowest reaction energy barrier and thus the highest hydrogen generation rate. Hence, is correlated with the catalytic activity, as shown in Fig. 3(f), and can be further employed to predict the change in catalytic activity. However, using as the descriptor of catalytic activity is still unrealistic, due to the challenges involved in directly measuring and tailoring it in experiments.
Considering that Pt/CNT-400 exhibited the highest catalytic activity, it is reasonable to assume that its electron-deficient Pt surface tends to strongly adsorb the reactants and facilitate bond cleavage to form reaction intermediates with a low energy barrier, thereby promoting the overall hydrogen generation. To test this idea, a correlation between the Pt charge and the corresponding and was made, as shown in Figs. 3(g) and (h), respectively. Interestingly, it was found that both the and the exhibit almost linear relationships with the Pt charge; the corresponding expressions can be written as follows:
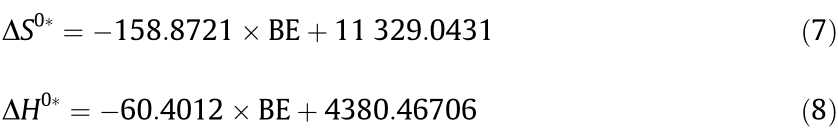
Therefore, substituting Eqs. (7) and (8) into Eq. (2) gives Eq. (9):

It is notable that the TOF values predicted by Eq. (9) agree well with the experimental data shown in Fig. 3(i). Although the Pt charge can change under different reaction conditions, the Pt charge of the fresh catalyst is still a promising descriptor (d) of the catalytic active sites. Hence, the reaction can be quantitatively described by the Pt charge, whose increment would significantly promote the catalytic activity. This finding can be interpreted as the Pt surfaces becoming more positively charged when the Pt charge is higher and thus forming stronger bonding with the negatively charged H atoms in AB (Fig. S18 in Appendix A)—that is, Pt+ —H– —BH2NH3. The stronger bonding gives rise to the dissociative adsorption of AB, as shown in Fig. S19 in Appendix A. As a result, it contributes to a significant loss of freedom upon AB adsorption and a low activation energy barrier by facilitating the cleavage of the H–B bond, which has been identified as the prerequisite of the rate-determining step [49]. In this way, a high Pt charge yields high catalytic activity. The expression developed here using the Pt charge as the electronic descriptor (d) quantitatively correlates the electronic properties of the Pt with the catalytic activity, which is validated by the available experimental data.
《3.5. Mesokinetics modeling》
3.5. Mesokinetics modeling
Carbon-supported noble-metal catalysts play a prevailing role in the production of fine chemicals, as their chemical and physical properties (e.g., support polarity, surface defects, and OCGs) have long been recognized as affecting catalyst preparation and the resultant catalytic performance [11–15]. Unfortunately, despite numerous studies on carbon-supported catalysts, a mechanistic understanding of the origin of the support effects is still lacking. Often, the results reported in the literature concerning carbon support effects stem from multiple factors and thus yield inconclusive and even contradictory results. For example, Yang et al. [51] and Serp et al. [52] found that the elimination of (electronegative) OCGs on CNTs would enhance the electron transfer from the CNTs to the metal and lower the metal’s BE. However, de Jong et al. [53,54] suggested an opposite trend: namely, that the removal of OCGs on carbon nanofiber by heat treatment would increase the metal BE. These seemingly contradictory results can be interpreted as being due to the difficulty in decoupling multiple factors and assessing their individual impacts, because the factors are always mutually interacting and simultaneously changing.
Apart from the difficulty in identifying the key factor(s) and ordering them into a hierarchy of contributions to the electronic properties of the metal, correlating the metal’s electronic properties with catalytic performance remains a major challenge. Nørskov et al. [3,48,55] pioneered a theoretical method using the d-band center of the metal as the descriptor to predict catalytic activity. However, it is impractical to directly engineer the dband center to achieve optimal values based on the adsorptionactivity relationship, because of the unreality of directly measuring the d-band center. Moreover, the intrinsic characteristics of metal catalysts that dominate the adsorption properties of the reaction species are still uncertain. Hence, it is crucial to identify the key descriptor, which is readily accessible in the laboratory, in order to tune the adsorption behaviors of reaction species over metal surfaces to achieve desirable catalytic performance.
Herein, we make an attempt to mimic enzyme catalysis in order to precisely engineer the electronic properties of Pt/C catalysts. As schematically illustrated in Fig. 4, due to the good electronic conductivity of carbon, the electronic properties of the Pt metal are modified by hybridization between the carbon and the metal. The OCGs on the carbon surface are used as ligands, and the electronic properties of the metal center are then fine-tuned by engineering these ligands based on their electron-withdrawing/ donating properties. Hence, the Pt/C catalysts described herein possess full flexibility, in that their electronic properties can be manipulated for targeted reaction systems, resulting in a 15-fold increment in hydrogen generation activity for AB hydrolysis, as well as the highest catalytic durability. Furthermore, a kinetics analysis of these catalysts reveals a unique kinetic compensation effect between lnAi and Ea, which can be interpreted as a thermo-dynamic balance between and . The advanced characterizations allow us to exclude the common artifacts related to variations in mass transfer limitation, textural properties, particle size, support polarity, and surface defects. As a result, the observation of a linear relationship between Pt charge and both and strongly suggests that the Pt charge serves as the descriptor (d) of Pt/C catalysts. In comparison with state-of-the-art descriptors such as the d-band center [48] and the local density of states at the Fermi level [56], the Pt charge is more directly relevant to the catalyst properties and can easily be measured through experimental characterization.
《Fig. 4》
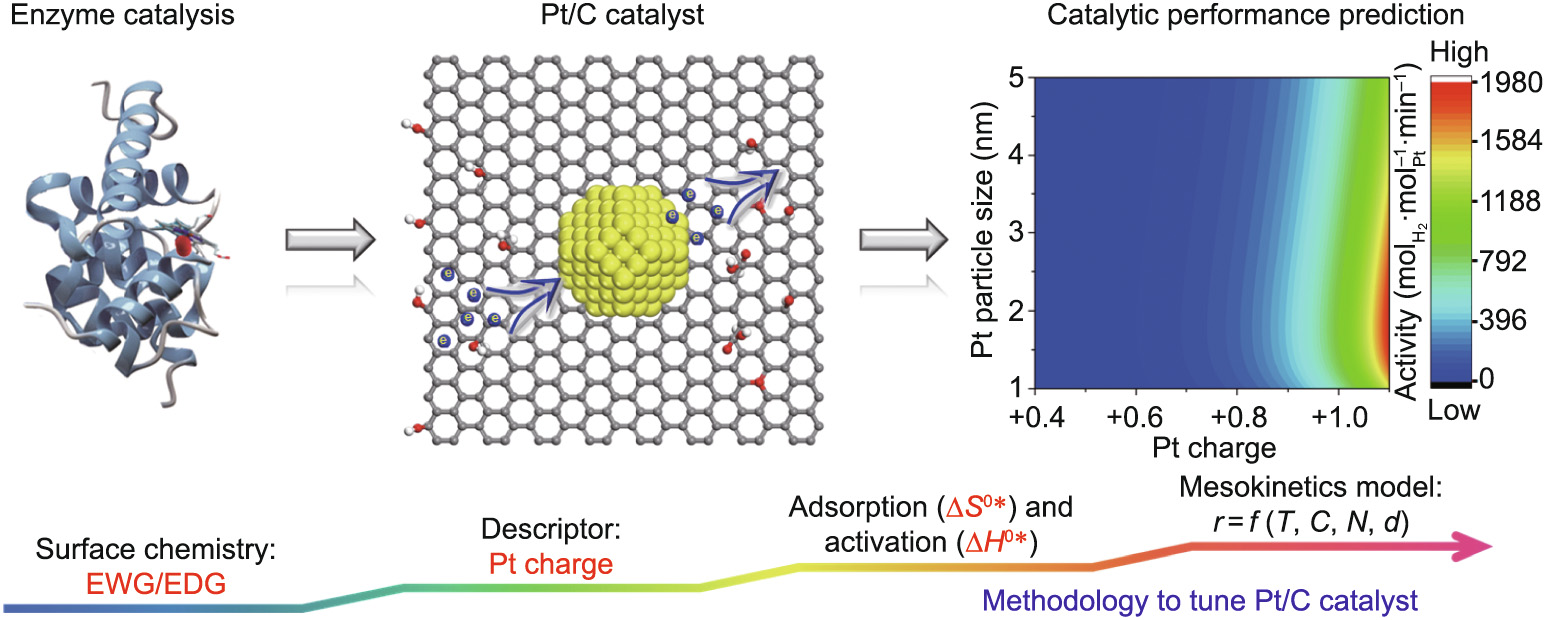
Fig. 4. Methodology based on mesokinetics to tune Pt/C catalysts.
Importantly, a design principle based on the descriptor (d) is still lacking, although it is essential in order to guide the preparation of Pt/C catalysts that are adapted to the requirements of targeted reactions. It should be noted that the traditional macrokinetics model has been widely adopted by fitting a power-law rate expression to the experimental reaction kinetics data, which can only help with the design and optimization of the reactor, rather than those of the catalysts. Hence, microkinetics modeling based on the reaction mechanism and elementary steps was developed to incorporate essential microscopic information about the catalyst surface (e.g., reaction intermediates, surface coverage, adsorption, and rate constant). With the advancement of computational chemistry and characterization techniques, the intrinsic properties of metal catalysts, such as size, charge, and composition, have been widely recognized as the basis for metal catalysis. As a result, it remains highly desirable to develop a new kinetics model to incorporate the properties of catalytic active sites and act as a complementary technique to the microkinetics model for catalyst design and manipulation.
In the present work, the high level of consistency shown in Fig. 3(i) implies a direct correlation between the Pt charge and the TOF, which can be interpreted as the quality of the Pt active site. Moreover, our previous study revealed that the Pt particle size significantly affects the catalytic activity [25], which can be interpreted as the influence of the quantity (N) of Pt active sites. Therefore, an understanding of the combined influence of the quantity (N) and descriptor (d) of the Pt active sites can help in deriving a new rate equation in the form of  , as schematically shown in Table S10 in Appendix A and Fig. 4. Clearly, this newly developed model links the microscopic electronic and geometric properties of the Pt active sites with the macroscopic catalytic performance, demonstrating that the Pt charge is an experimentally accessible descriptor that can predict catalytic performance. Hence, this newly developed mesokinetics model can be used to search for the optimal Pt catalyst: That is, a higher Pt charge and an optimized particle size of around 1.8 nm would combine the synergistic electronic and geometric merits for robust hydrogen production.
《4. Conclusions》
4. Conclusions
In summary, we report a precise engineering methodology for the carbon surface chemistry of Pt/C catalysts—that is, electronwithdrawing/donating OCGs—to tame the electronic properties of the supported Pt. A progressive relationship among carbon surface chemistry (EWG/EDG), Pt charge and Pt BE, activation entropy (), and activation enthalpy (), as well as the resultant catalytic activity (rinitial), has been established by means of DFT calculations, advanced characterizations, and detailed kinetic and isotopic analyses. After decoupling the influences of other factors, the Pt charge state was identified as an experimentally accessible descriptor (d) of the active site, based on which a newly developed mesokinetics model was unprecedentedly proposed by further incorporating the number of Pt active sites. Due to the capacity of our proposed methodology to fine-tune the electronic and structural properties of the metal, coupled with the guidance of the established mesokinetics model, we believe that our study represents a foundation for the rational design and manipulation of Pt/C catalysts with simultaneous high mass-specific activity and durability.
《Acknowledgments》
Acknowledgments
This work was financially supported by the Natural Science Foundation of China (21922803, 92034301, 22008066, and 21776077), the China Postdoctoral Science Foundation (BX20190116), the Innovation Program of Shanghai Municipal Education Commission, the Program of Shanghai Academic/Technology Research Leader (21XD1421000), 111 Project of the Ministry of Education of China (B08021). The authors thank beamline BL14W1 (Shanghai Synchrotron Radiation Facility) for the beam time and assistant in the experiments.
《Compliance with ethics guidelines》
Compliance with ethics guidelines
Wenyao Chen, Wenzhao Fu, Xuezhi Duan, Bingxu Chen, Gang Qian, Rui Si, Xinggui Zhou, Weikang Yuan, and De Chen declare that they have no conflict of interest or financial conflicts to disclose.
《Appendix A. Supplementary data》
Appendix A. Supplementary data
Supplementary data to this article can be found online at https://doi.org/10.1016/j.eng.2020.11.014.


 京公网安备 11010502051620号


