
《1. Introduction》
1. Introduction
Most clinical biomarkers and therapeutic drugs are small molecules [1]. Thus, monitoring their concentration levels in dried blood spots (DBSs) [2], plasma samples [3], urine [4], and other bodily fluids is of great physiological value. Creatine (CRE) metabolic diseases can be caused by a lack of CRE transport vectors, arginine–glycine amidinotransferase (AGAT), and recombinant guanidinoacetate-N-methyltransferase (GAMT), where both of the latter are enzymes involved in CRE synthesis [5]. Laboratory diagnosis of CRE metabolic diseases is based on the determination of guanidinoacetic acid (GAA) and CRE in plasma and urine [6]. One strategy for such determinations is by immunoassay, which plays an important role in clinical analysis and is currently still adopted for newborn screening (NBS) [7]. However, band overlap and unavoidable background interferences limit the detection of multiple analytes.
Mass spectrometry (MS) overcomes the multiple detection limits because of its high resolution and specificity [8–11]. A linear ion trap (LIT) is a kind of mass analyzer with high ion capture and ion storage efficiency [12]. Unlike three-dimensional (3D) ion traps, in an LIT or dual-LIT, the ions are trapped along the polar axis instead of gathering at a point, which effectively avoids the inherent drawbacks of 3D ion traps [13–15]. As a result, the capture efficiency is improved, the space charge effect is weakened, and the specificity and sensitivity of MS analysis are greatly improved [16]. However, when the targets are analyzed in complex matrices, the space charge effect remains, which can affect mass measurement [17–19]. Consequently, efficient determination of multiple analytes in clinical samples without loss of sensitivity while retaining flexible and automated operation remains a challenge in LIT MS analysis.
Quadrupole mass analyzers are dynamic mass filters that have many advantages in MS investigations, as reflected by their popularity. Quadrupoles are used alone or in tandem for ion isolation. A single-quadrupole mass spectrometer can only measure ion fragments or precursor ions produced by in-source fragmentation. Due to this restriction, the single-quadrupole mass spectrometer provides limited structural information and is more restricted by specificity than a tandem quadrupole MS. In recent years, the triple quadrupole (QqQ) tandem MS has been extensively applied to quantitative analysis and is known as the ‘‘gold standard” [5,9,20]. Meanwhile, the linear quadrupole provides the most effective solution for ion isolation [13], as well as being robust and simple to use. Similar to the limitations of the single quadrupole, the QqQ can only provide secondary MS information and is useless when faced with isomers in complex matrices. Other forms of tandem MS instruments exist, such as the tandem ion trap, which is also known as the hybrid linear ion trap triple quadrupole (QTRAP) [21]. The QTRAP is a perfect instrument with superior performance, but the system is complicated.
In this article, a home-built quadrupole-LIT (Q-LIT) tandem mass spectrometer is designed and developed for the measurement of smallmolecule diseasemarkers in complex samples (Fig. 1). By using a quadrupole screening function, the target precursor ions are isolated and background interferents are eliminated, thereby reducing the number of ions entering the LIT, minimizing the space charge effect, and improving sensitivity. The fragmentation of precursor ions and the capture of target product ions are then performed directly in the LIT, eliminating the need for collision cells and thus simplifying the instrument system structure. At the same time, multistage fragmentation (MSn , n ≥ 3, where n is the mass fragmentation stage) can still be achieved in the LIT.Moreover, high-accuracy quantification is achieved through precise ion control. In conclusion, the use of the Q-LIT method—which neither relies on chromatographic separation nor requires complicated pretreatment steps—for the analyses of complex biological samples results in a significant increase in throughput and efficiency.
《Fig. 1》

Fig. 1. A schematic of the home-built Q-LIT tandem mass spectrometer and its application. LC: liquid chromatography.
《2. Materials and methods》
2. Materials and methods
《2.1. Chemicals》
2.1. Chemicals
GAA, CRE, D2-GAA, and D3-CRE standards (purity ≥ 99%) were purchased from Dr. Ehrenstorfer GmbH (Augsburg, Germany). Methanol, acetonitrile, and formic acid (MS grade) were provided by Thermo Fisher Scientific Inc. (Pittsburgh, PA, USA). The other chemicals (analytical reagent grade) were purchased from Sinopharm Chemical Reagent Co., Ltd. (Beijing, China). Quantitative test kits for GAA and CRE in neonatal DBS (MS/MS method) were provided by Aidia Life (Yantai City, China). The extraction solution was 80:20 methanol/water with 0.05% formic acid. Stock internal standard solutions of GAA and CRE were prepared by dissolving a powdered mixture of each compound into the extraction solution, and were stored at 4 °C in amber glass vials. The working standard solution was prepared from the extraction solution according to a 1:110 dilution of the stock solution. The stock solutions were kept stable for a minimum of 30 d, and the working solution remained stable for a maximum of 24 h in an amber vial at a temperature of less than 4 °C.
《2.2. Instrumentation》
2.2. Instrumentation
All MS/MS acquisitions were performed by a home-built Q-LIT V2 tandem mass spectrometer, which was manufactured by the Mass Spectrometry Engineering Technology Research Center at the Center for Advanced Measurement Science of the National Institute of Metrology, Beijing, China.
The basic design of the Q-LIT appearance, quadrupole, and the LIT used in this work is described in Fig. 2(a). The length, width, and height of the entire instrument are 65, 55, and 54 cm, respectively. Fig. 2(b) shows the key components, including the quadrupole and LIT. The quadrupole is composed of four round electrodes machined from stainless steel with round rod profiles and a field radius (r) of 6 mm. Every rod was divided into three axial parts with lengths of 20, 130, and 20 mm. The field radius of all the quadrupole rod arrays is 5.31 mm. The LIT adopted in this study has a geometry close to what was described previously [22,23]. The length of the LIT is 100 mm, and the half distances between the radio frequency (RF) electrodes are 6.76 mm for both the x and y pairs. A slit with a width of 0.28 mm and a length of 70.0 mm is centrally located in each x electrode
《Fig. 2》

Fig. 2. Schematics of (a) the Q-LIT tandem mass spectrometer and (b) key components (quadrupole, LIT). The half-distance between x electrodes is 6.76 mm, the half-distance between y electrodes is 6.76 mm, the length in the z direction is 100.00 mm, the slit length is 70.00 mm, and the width is 0.28 mm. RF: radio frequency.
The fundamentals of the Q-LIT are shown in Fig. 3(a). Using two electron multipliers, the ions ejected from the LIT are detected. An RF coil was built to use balanced two-phase RF voltages in the x and y pairs of electrodes separately. Home-built electronics and ion trap control language (TinyTrap, National Institute of Metrology, China) programs were used to control the Q-LIT system. The helium buffer gas used in this instrument was directly introduced into the LIT through a hole in a polycarbonate holder to realize high pressure in the LIT. For all experiments, the pressure outside the LIT was 2.67 × 10⁻³ Pa. An RF frequency of 922 kHz was used for the quadrupole, whereas a frequency of 1149 kHz was used for the LIT. The quadrupole RF/direct current (DC) was chosen for precursor ion selection. Alternating current (AC) auxiliary waveforms were coupled to the LIT RF and applied to the x electrodes for ion isolation, excitation, and then resonance ejection. The dimensionless Mathieu parameter (q) value in this experiment was 0.30 for collision-induced dissociation (CID). According to a reported study [24], the q value of 0.83 was selected for both isolation and resonance ejection. A schematic of the scan function employed for the Q-LIT tandem mass system is illustrated in Fig. 3(b). By increasing the RF voltage of the quadrupole, precursor ions were first isolated, and then trapped in the LIT. A single-frequency AC waveform in the LIT was applied to the precursor ion fragmentation. Finally, product ions were analyzed by scanning the LIT RF voltage.
《Fig. 3》
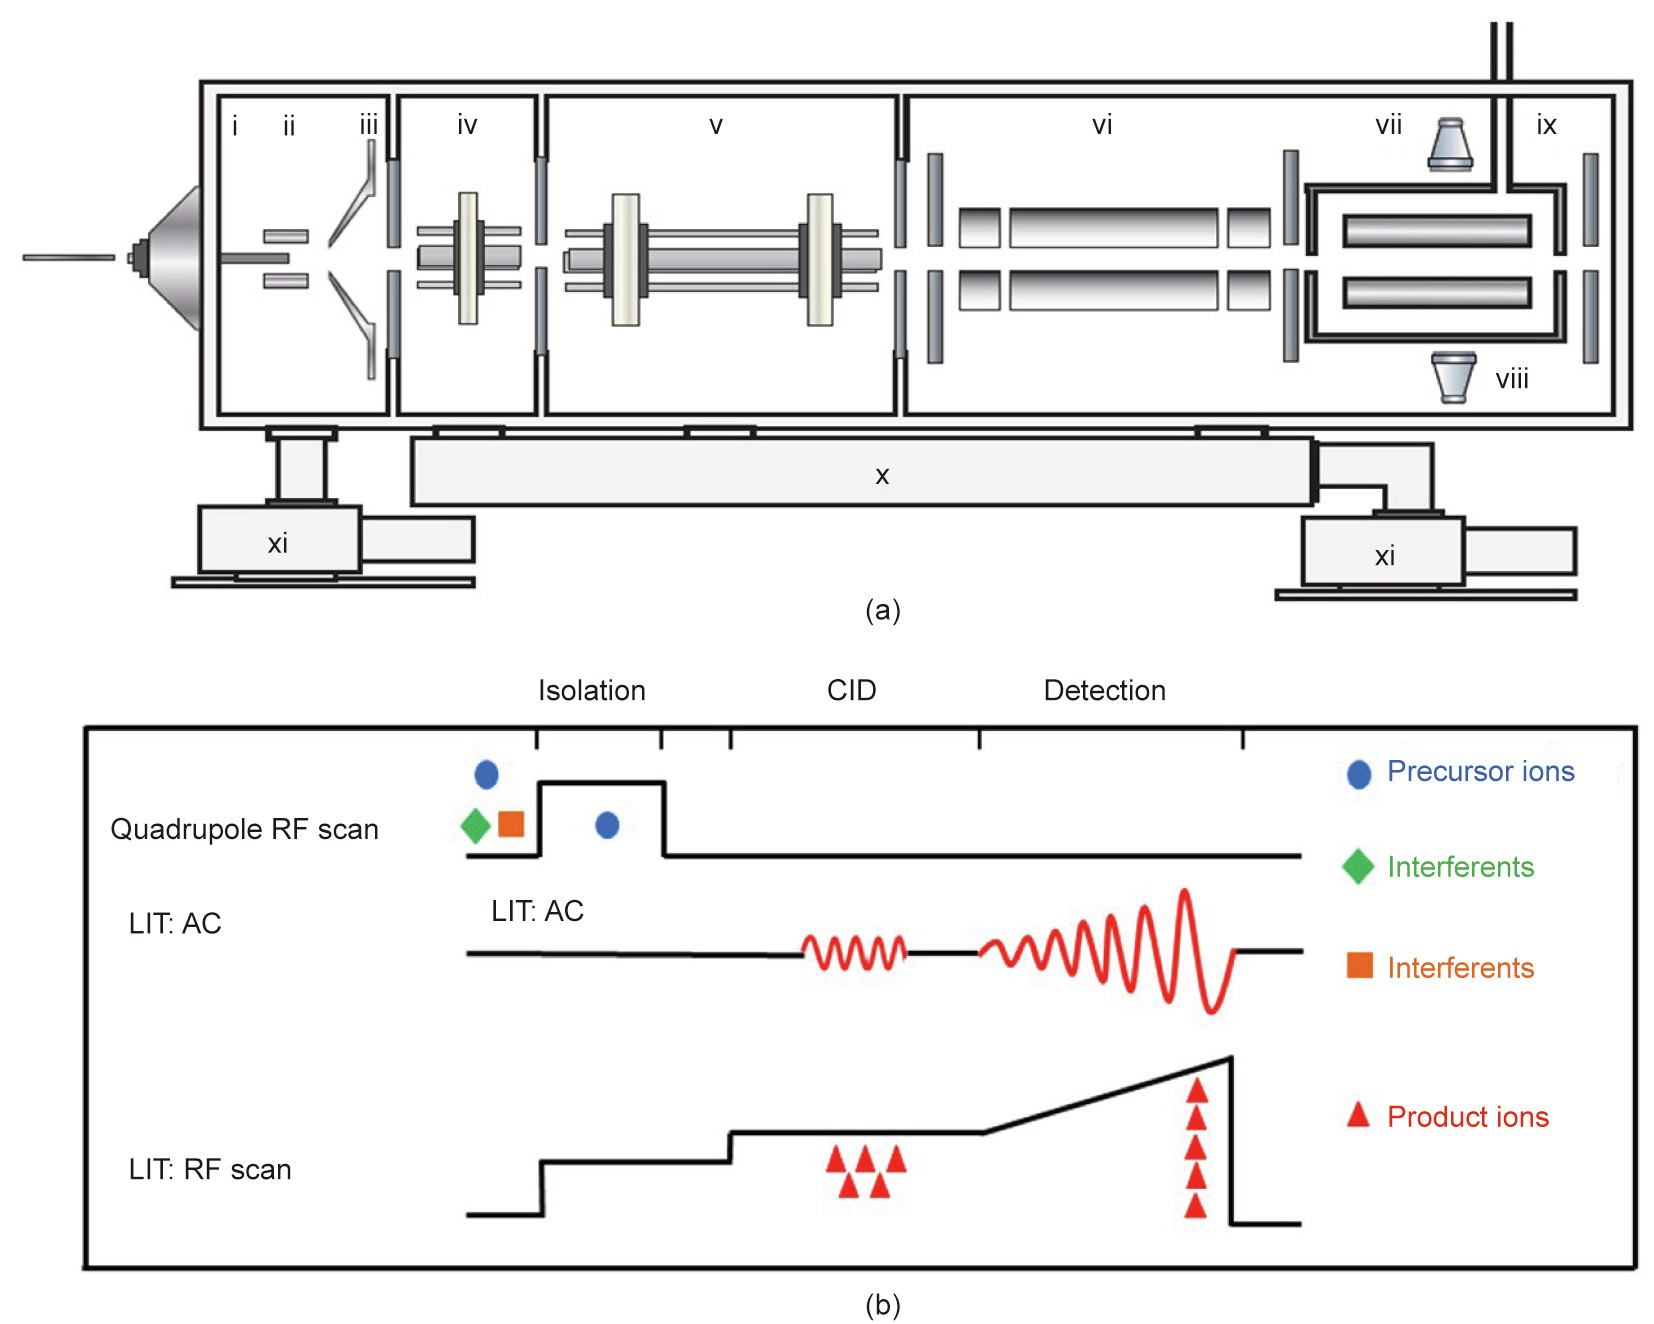
Fig. 3. (a) Schematic of the Q-LIT: (i) heated capillary, (ii) tube lens, (iii) skimmer, (iv) square quadrupole ion guide 1, (v) square quadrupole ion guide 2, (vi) quadrupole, (vii) LIT, (viii) electron multiplier, (ix) buffer gas inlet, (x) split flow turbo pump, (xi) rough pump. (b) Scan function used for the Q-LIT system. CID: collision-induced dissociation; AC: alternating current.
In the performance test experiments, a calibration solution was injected into the Q-LIT at a flow rate of 10 μL·min–1 with an injection pump to verify the mass range. A flow rate of 10 μL·min–1 was selected for injecting reserpine into the instrument. Changing the scanning speed can reflect changes in the mass resolution. By implementing CID using resonance excitation, the MS2 product ion (mass-to-charge ratio (m/z) 448.05 and 397.19) spectrum of reserpine (m/z 609.30) was observed and used for optimization. By changing the ion injection time, the observed mass shift and peak width changes of the reserpine ion peak showed the effectiveness of the Q-LIT for reducing the space charge effects.
《2.3. Applications》
2.3. Applications
In the mode of single reaction monitoring (SRM), Q-LIT V2 MS/ MS analysis of GAA and CRE in DBS was conducted using a positive ion electrospray ionization (ESI+ ). The interface conditions were as follows: a source temperature of 120 °C, nitrogen (N2) sweep gas (3.45 × 10³ Pa, 305 °C), N2 auxiliary gas (1.38 × 10³ Pa); N2 sheath gas (6.89 × 10⁴ Pa), and a capillary voltage of 4.9 kV. The ion injection/enrichment times were 1800 and 150 ms for GAA/D2-GAA and CRE/D3-CRE, respectively. The corresponding quadrupole radio frequency (QRF) and ion trap radio frequency (ITRF) were optimized to make the detection sensitivity as high as possible. The precursor ions, product ions, and optimized SRM parameters, including QRF and ITRF, are given in the Table S1 in Appendix A. The flow injection analysis (FIA) of GAA and CRE was performed without a chromatographic column, with a methanol/water solution (80:20, v/v, with 0.05% formic acid) as the mobile phase. Moreover, the flow rate was varied, as shown in Table S2 in Appendix A. The volume of injection was 5.0 μL, and the sample temperature was kept at 4 °C.
The following steps were followed for sample pretreatment and extraction: The quality control (QC) samples and DBS samples were punched, where the diameter of each sample was approximately 3.2 mm (1/8 in). Each of the punched samples was then transferred to a clean 96-well plate. Subsequently, a total of 100 μL of working solution, which was prepared daily, was added to each well, and the samples were incubated for 45 min at a temperature of 45 °C while shaking at a rate of 750 revolutions per minute (rpm). Next, a total of 75 μL of the extracted solution was collected. Finally, a total of 5.0 μL of the collected sample solution was detected by the FIA-Q-LIT tandem MS system.
The above method was used for the analysis of the control samples and 77 actual samples.
《3. Results and discussion》
3. Results and discussion
《3.1. Performance test》
3.1. Performance test
Molecules with known m/z were detected using the Q-LIT, and the mass range being detected was verified based on the obtained mass spectrum. The calibration solution contained many compounds with masses covering m/z 195–2022, and was used to verify the working mass range. During the RF scanning process, the amplitude of the dipolar auxiliary alternating current potential (405.9 kHz) rose from 0.21 to 8.20 V to promote the efficient ejection of ions, and the m/z ranged from 48 to 2000. Fig. 4(a) shows a spectrum recorded at a scanning rate of 12 180 amu·s–1 , which obtained full-width peaks at half-maximum (FWHM) values below 0.8 amu in the available m/z range of 2000.
《Fig. 4》

Fig. 4. (a) Mass spectrum of the calibration mixture solutions recorded by the Q-LIT, showing the full scanning range reaching m/z 2000. (b) FWHM of the reserpine peak (m/z 609.30), which was analyzed by the Q-LIT system as a function of scanning rate. (c) MS/MS spectrum of protonated reserpine (m/z 609.30) for product ions, which was detected by the Q-LIT instrument at a CID efficiency of 64%. FWHM: full-width peaks at half-maximum.
A common way to improve the mass resolution of a Q-LIT system is to decrease the scanning speed. Considering that the number of increments increases on the basis of the RF voltage in a fixed mass range, the time required to resolve ions with contiguous m/z values, which are being ejected at their stability threshold, can increase. The influence of scanning speed on resolution was noted. Spectra of reserpine (m/z 609.30) were collected at different scanning rates ranging from 400 to 12 000 amu·s–1 , and peak width was plotted as a function of scanning rate, as displayed in Fig. 4 (b). The mass resolution increased as the scanning rate decreased to 400 amu·s–1 . An FWHM as narrow as 0.28 amu was realized for protonated reserpine at a scanning rate of 1218 amu·s–1 based on the current LIT version.
We then investigated the capabilities of our Q-LIT MS system. The ion isolation and CID efficiencies were featured using the ions generated from reserpine. In this experiment, precursor ions were selected using the quadrupole. The q values of 0.25, 0.30, 0.35, 0.40, 0.45, and 0.50 were optimized, and the highest dissociation efficiency was obtained at q = 0.30. Therefore, CID was activated by resonance excitation at q = 0.30, providing a good balance between the low mass cut-off for the fragment ions and the radial pseudopotential well depth. As shown in Fig. 4(c), protonated reserpine was seen in the MS2 product ion spectrum at m/z 609.30. Using an activation time of 50 ms, an overall CID efficiency of 64% was acquired.
《3.2. Space charge》
3.2. Space charge
Compared with a 3D ion trap with the same cross-sectional area, the z-direction elongation of a two-dimensional (2D) trap makes the trapped ion volume much larger [8]. When ions are ejected out of 2D traps, such as the LIT, the cloud of ions is spread along the z-axis [22,25] and the ions do not group into a sphere with a diameter of about 1 mm as they do in 3D traps [26]. In this study, the effectiveness of the Q-LIT for reducing space charge effects was tested using reserpine (m/z 609.30). As illustrated in Fig. 5, the ion cloud before isolation/fragmentation (red line, without isolation) can be immensely affected by the space charge. The space charge issue is normally overcome by simply isolating a single precursor ion. To characterize the effect of space charge in our home-built Q-LIT mass analyzer, a comparison of both methods (isolation in the quadrupole mass filter or in the LIT) was performed to analyze the isolated precursor ion. The mass resolution, mass shift, and intensity were measured based on the number of ions trapped, using a reserpine standard solution at a concentration of 1.0 μg·mL–1 . As shown in Fig. 5(a), the time of ion injection could be increased from 0.1 to 0.8 s (isolation in the LIT) and from 0.1 to 0.4 s (isolation in the quadrupole) without losing mass resolving power. For quadrupole isolation, when the time of ion injection is 0.6 s, the resolution first drops by approximately 100, and then remains unchanged. For LIT isolation, the time of ion injection can be increased from 1.0 to 8.0 s, and the resolution continuously declines (~200). Moreover, mass shifts (Fig. 5(b)) can be effectively improved by isolation. For example, the mass shifts are approximately 0.38 amu for both isolation methods with an ion injection time ranging from 0.1 to 8.0 s. In addition, Fig. 5(c) quantitatively characterizes the changes in mass intensity caused by the space charge effect. The mass intensity of the LIT isolation gradually increased as the time of ion injection increased from 0.1 to 0.8 s, and then declined sharply with an ion injection time greater than 0.8 s. For quadrupole isolation, the mass intensity increased gradually at ion injection times of less than 7 s. A similar result was obtained by adding 100 μg·mL–1 of methionine–arginine–phenylalanine–alanine (MRFA) (m/z 524.56) to 10 ng·mL–1 of reserpine. Thus, for a relatively pure solution analysis within the dynamic range of the ion trap, stored waveform inverse Fourier transform (SWIFT) isolation of the ion trap is superior to quadrupole isolation in terms of resolution and intensity, and the mass shift is equivalent to that of quadrupole isolation. However, in a complex matrix analysis (20 ng reserpine was added to 2 mL of DBS extraction solution, reserpine at a concentration of 10 ng·mL–1 ), LIT isolation is directly affected by matrix interferences, which lead to space charge effects. Consequently, the response of quadrupole isolation continues to increase (Fig. 5(d)). The above results demonstrate that, for a complex sample matrix, excessive matrix interferences from the actual sample can easily cause space charge effects in a single LIT. In addition, the sample concentration of the target chemical compounds is unknown, and a wide dynamic range is required. Therefore, the design of the QLIT is advantageous, as the quadrupole can selectively isolate precursor ions from complex matrix samples and reduce matrix interferences and space charge effects, as well as eliminating the chromatographic separation of complex samples to simplify the pretreatment process.
《Fig. 5》

Fig. 5. Space charge of the reserpine peak (positive ion m/z 609.30) recorded using the Q-LIT mass spectrometer. (a) Mass resolution changes for the reserpine standard solution due to space charge effects. (b) Mass shifts for the reserpine standard solution due to space charge. (c) Mass intensity changes for the reserpine standard solution with increasing ion injection time. (d) Mass intensity changes for the reserpine spiked in DBS extraction during ion injection; reserpine added at a concentration of 10 ng·mL–1 .
《3.3. Applications》
3.3. Applications
As the gold standard analysis method, MS is essential in NBS and in other areas [7]. For Q-LIT V2 tandem mass analysis, the target precursor ions were first selected in the quadrupole, and then simultaneously injected, trapped, and fragmented in the LIT to obtain and enrich the target product ions. Multistage fragment ions were directly enriched. For each analyte, one transition was selected for identification, and the major product ions were m/z 101.12, 103.12, 90.11, and 93.10 for GAA, D2-GAA, CRE, and D3- CRE, respectively. The formation of the product ions at m/z 101.12 for GAA (precursor ion at m/z 118.11) and m/z 103.12 for D2-GAA (precursor ion at m/z 120.09) was assumed to involve the loss of an ammonia molecule (NH3) [27], as shown in Figs. 6 and 7. This phenomenon was also indicated by the CRE and D3- CRE spectra, but the signal response was insufficient and was dramatically less than that of the m/z 90.11 ions for CRE and the m/z 93.10 ions for D3-CRE (Figs. S1 and S2 in Appendix A). The formation process of these product ions was considered to contain the missing cyanamide molecule (CN2H2). Moreover, as illustrated in Fig. 6, precursor ions that were directly transported into the LIT without being selected by the quadrupole caused space charge effects and saturation problems in the ion trap. However, precursor ions that were selected by the quadrupole resulted in a greatly reduced space charge effect (Fig. 7). Finally, the corresponding tube lens, direct current bias voltage of ion guide (Q0), direct current bias voltage of pre-quadrupole (PreQ), and direct current bias voltage of rod (ROD), were optimized for maximum detection sensitivity, as displayed in Fig. S3 in Appendix A.
《Fig. 6》

Fig. 6. Mass spectra of ions directly injected into the LIT without being selected by the quadrupole. (a) All ions in the GAA standard solutions; (b) fragment ions of GAA; (c) all ions in the D2-GAA standard solutions; (d) fragment ion of D2-GAA. [M + H]+ : parent ion.
《Fig. 7》

Fig. 7. Mass spectra of ions injected into LIT after selection by the quadrupole. (a) Precursor ion of GAA; (b) fragment ions of GAA; (c) precursor ion of D2-GAA; (d) fragment ions of D2-GAA.
The FIA–ESI-MS/MS method is widely used for determining many biomarkers in different kinds of biological matrices [7,28]. This method has great potential for the high-throughput screening of multiple diseases because the analysis time required for FIA– MS/MS is often only 1.0–2.5 min per sample (Table S3 in Appendix A). Consequently, FIA–ESI-MS/MS has been applied to analyze and detect amino acids, acylcarnitines, CRE, GAA, and other biomarkers in clinical samples [27,29,30]. To improve the sensitivity, some target analytes are usually derivatized as their butyl esters, such as amino acids, GAA, CRE, and 25-hydroxy vitamin D [27,31,32]. The FIA–ESI-MS/MS method (1.0 min) for estimating GAA and CRE in DBS extracts was first established by Carducci et al. [27]. However, this method uses the derivatization to butyl esters, which often makes pretreatment steps cumbersome and time-consuming. Liquid chromatography–tandem MS (LC–MS/MS) is also widely used to detect GAA and CRE, but can be time-consuming (5–10 min) [5,33]. The total acquisition time of the developed FIA–ESI-Q-LIT method is 1.5 min, making the analysis very fast and efficient. When compared with liquid chromatography (LC) methods, the time required was reduced by more than a factor of three. Moreover, compared with the reported FIA–ESI-MS/MS method that is used to detect GAA and CRE [27], our established method does not require derivatization, and the sample preparation for MS analysis only requires one solid–liquid extraction step. In summary, the FIA–ESIQ-LIT method is demonstrated to be suitable for high-throughput NBSs for GAMT and AGAT.
Under optimal experimental conditions (Tables S1 and S2 in Appendix A), the Q-LIT V2 method was validated according to the linear range, sensitivity, accuracy, and squared regression coefficients. The results are shown in Table S4 in Appendix A. In the range of 1.20–9.84 μmol·L–1 , the linear correlation coefficient (R2 ) of GAA was 0.9908. In the range of 122.05–656.76 μmol·L–1 , the R2 of CRE was 0.9902. The mean recoveries of GAA and CRE based on whole blood samples spiked with the analytes at two concentrations (3 and 8 μmol·L–1 for GAA, 150 and 300 μmol·L–1 for CRE) were in the range of 112.4%–119.9%, with a coefficient of variation (CV) less than or equal to 7.73%. Moreover, low-level QC (QC-LL) and high-level QC (QC-HL) samples were analyzed ten times to evaluate the repeatability of the method (intraday precision). The CVs of QC-LL were 6.38% and 8.19% for GAA and CRE, whereas the CVs of QC-HL were 6.88% and 8.40% for GAA and CRE, respectively. When the signalto-noise ratio was three, the detection limits were 0.35 and 0.07 nmol·L–1 for GAA and CRE, whereas the limits of quantification when the signal-to-noise ratio was 10 were 1.0 and 0.2 nmol·L–1 for GAA and CRE, respectively. In addition, validation data using the TSQ Altis (Thermo Fisher Scientific Inc., USA) method (Table S5 in Appendix A) are listed in Table S4, showing that the sensitivity, linearity, QC, and recovery of QLIT and TSQ Altis are comparable. Although the repeatability of Q-LIT meets clinical requirements, the stability of Q-LIT should be studied in depth in future research.
After method validation, a number of 77 actual samples were analyzed. These actual samples were tablets of dried human blood. The Q-LIT V2 and TSQ Altis were used to measure the samples. The results of Q-LIT V2 were consistent with those of TSQ Altis, and all the results were within the mean ± standard deviation of TSQ Altis. Detailed results are presented in Table S6 in Appendix A. Moreover, the extracted ion mass spectrum and FIA chromatogram are illustrated in Fig. 8. The measurement of several actual clinical samples demonstrated the good qualitative and quantitative capabilities of Q-LIT V2.
《Fig. 8》

Fig. 8. Mass spectra and chromatograms of (a) GAA, (b) CRE, (c) D3-CRE, and (d) D2-GAA in actual DBS samples, as obtained by FIA–ESI-Q-LIT.
《4. Conclusions》
4. Conclusions
A home-built Q-LIT tandem mass spectrometer was developed for clinical biomarker analysis. Mass range, scanning speed, and dissociation efficiency were evaluated. Reduction of the space charge effect using this instrument was verified experimentally. The experimental results indicated that this method can help reduce the number of ions entering the LIT and effectively weaken the effect of space charge. In addition, this method solves the drawbacks of the complicated and time-consuming sample analysis process required by LC methods. The FIA–ESI-Q-LIT method developed and validated herein can also be introduced as a fast, simple, and dependable tool to conduct quantitative analysis of trace or ultra-trace compounds in complex clinical matrices.
《Acknowledgments》
Acknowledgments
This research was financially supported by the National Key R&D Program of China (2018YFF0212503, 2019YFF0216303, and 2016YFF0200502), the National Natural Science Foundation of China (21927812), and the Research Project of the National Institute of Metrology (AKY1934). We sincerely thank Weijie Zeng and Keke Yi for their help with the experiments.
《Compliance with ethics guidelines》
Compliance with ethics guidelines
Xiang Fang, Jie Xie, Shiying Chu, You Jiang, Yuting An, Chang Li, Xiaoyun Gong, Rui Zhai, Zejian Huang, Chunling Qiu, and Xinhua Dai declare that they have no conflict of interest or financial conflicts to disclose.
《Appendix A. Supplementary data》
Appendix A. Supplementary data
Supplementary data to this article can be found online at https://doi.org/10.1016/j.eng.2020.10.021.


 京公网安备 11010502051620号


