
《1 Introduction》
1 Introduction
“Research on manufacturing power strategy” is an important consulting project jointly organized by multiple departments, such as the Chinese Academy of Engineering, the National Ministry of Industry and Information Technology, and the general administration of quality supervision inspection and quarantine of China. The durations of phases I and II of the project were 2013–2014 and 2015–2016, respectively. In the phase I study, the research group first constructed the “manufacturing power evaluation index system,” and evaluated and analyzed the manufacturing power development level of nine typical countries between 1946 and 2012. The three-step (three decade) strategic goal of China in the manufacturing power was proposed simultaneously. Our research group also contributed significantly to the introduction of Made in China 2025.
To systematically indicate the manufacturing power development process, the group optimized and completed the index system, and continuously collected and evaluated the annual index data in phase II of the study [1–6]. The report is based on the optimization of individual indicators, data statistics, calculation method, the work performed for the 2015 index data collection and collation, index evaluation, and the detailed analysis of issues related to the index. Meanwhile, by combining the manufacturing added value of China and other official data available in 2016, the preliminary calculation of the comprehensive index of manufacturing power in 2016 was performed, and the development trend of the last five years was further summarized, providing a good foundation for the sustainable development of the index. It is beneficial to further improve the scientific and effective evaluation work and provide a useful reference for China’s manufacturing.
《2 Comprehensive analysis of the manufacturing power index system optimization》
2 Comprehensive analysis of the manufacturing power index system optimization
In this paper we will first introduce several aspects, such as data source updating, calculation method optimization, and index classification improvement, for the improvement and optimization of the manufacturing power index evaluation system.
《2.1 Data source update》
2.1 Data source update
2.1.1 Manufacturing added value
In the current study, the primary source of added value for manufacturing is the World Bank. Considering the delay and frequent updates of data from the World Bank database (data of China, USA, and Japan is delayed by over two years), the research group uses “update data released by the World Bank in October each year” as the data collection time point. In the same period, the World Bank’s unpublished national data were obtained from authoritative institutions, such as the National Bureau of Statistics, and were then converted by the average exchange rate in that year.
2.1.2 Rate of manufacturing added value
To easily obtain the data source, the index of added value rate of manufacturing was decomposed herein. The index of added value rate of manufacturing was calculated using the added value of the manufacturing industry, the total output of the base year manufacturing (data from the United Nations industrial development organization database), and the growth rate of the industrial production and sales (data from the China economic information network).
2.1.3 Manufacturing total labor productivity.
In phase II of the study, the research group conducted an indepth study on the number of manufacturing workers in various countries. Hence, the labor productivity of all the countries’ manufacturing industries was recalculated. Among them, the total labor productivity of China’s manufacturing industry was measured by the manufacturing added value, the number (data from the third census) of manufacturing employees in the base year (2013), and the ratio of the number of employees in the second industry (data from the National Bureau of Statistics). Data of all other countries is measured by the manufacturing added value and number (data from the China economic information center) of manufacturing practitioners.
2.1.4 The operating income ratio of China’s manufacturing enterprises among the top 500 companies in the world
Owing to the merger and reorganization of some listed companies, especially in China, the research group reorganized the list of manufacturing companies in the top 500 in the second study, and the primary business revenue was confirmed according to the new distinction.
2.1.5 Informatization development index
In the previous research, the “network readiness index (NRI)” (released in collaboration with the world economic forum and the Center for International Development Studies at Harvard University) was established to reflect the level of information development in the manufacturing industry. However, in view of the small change in the NRI, and the small gap between the countries, it is impossible to show the development process and gap of the manufacturing industry informatization. Therefore, the NRI is adjusted to the “informatization development index” (released by the International Telecommunication Union).
《2.2 Optimization of calculation method》
2.2 Optimization of calculation method
Quality is one of the focuses of China’s manufacturing industry. To more comprehensively reflect the quality of products and the value of unit products, the research group proposed a more comprehensive index called the “quality index” and a calculation method (Table 1).
《Table 1》
Table 1. “Quality index” optimization and calculation method description.

The number of recalls in the United States and the European Union reflects the quality of products in each country and the influence of the two countries on their respective trade policies and political factors, which cannot embody the unit value factor of the product. In view of the one-sidedness and limitations of the early “export product recall index” and based on the weakening trade policy and political factors, reducing the difference in country volume, and enhancing the value comparison, this paper introduces a more comprehensive “quality index,” i.e., by introducing the average unit export price of the typical products of the nine countries, and the weighted synthesis of the recall notification index into the new “quality index.” This index more comprehensively reflects the quality level of various national products.
《2.3 Index classification and improvement》
2.3 Index classification and improvement
The trade competitive advantage index of high-technology products can reflect whether the products thereof produced in China have competitive advantages in the international market. In previous studies, it was classified into “quality benefit” level 1 indicators to reflect the industrial benefits. However, the current “structure optimization” secondary indicators primarily reflect the structure of the industry and enterprises. The product structure is not reflected, and high-technology products will be critical in promoting and upgrading the traditional industries and industrial structure. Therefore, this paper classifies the “trade competitive advantage index of high-technology product” into the “structure optimization” primary index.
《3 Measurement and analysis of manufacturing power development index》
3 Measurement and analysis of manufacturing power development index
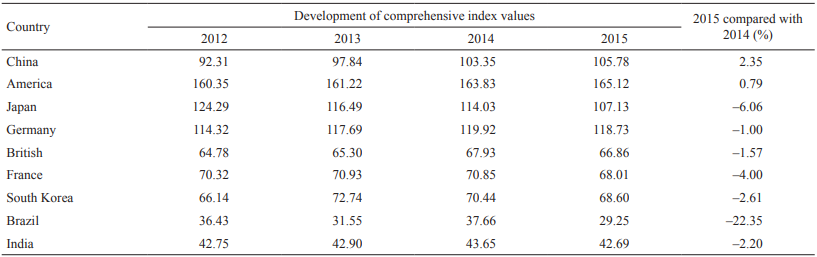
The comprehensive indices for the development of manufacturing power in China are given in Table 2; the values for the United States, Germany, Japan, South Korea, France, the United Kingdom, India, and Brazil are 105.78, 165.12, 118.73, 107.13, 68.60, 68.01, 66.86, 42.69, and 29.25, and the corresponding growths in 2014 are 2.35%, 0.79%, −1%, −6.06%, −2.61%,−4%, −1.57%, −2.20%, and −22.35%, respectively. The global manufacturing industry has generally been depressed. American manufacturing has performed well in developed countries. China’s manufacturing sector has performed better in developing countries. China, the United States, Germany, the United Kingdom, and South Korea had all improved their comprehensive index from the composite index trend in 2012–2015. Among them, China’s synthetical index is the most obvious in the same period. In Japan, France, Brazil, and India, the overall index has declined by a certain margin (Table 2). Among them, Japan’s comprehensive index fell most sharply in the same period. The added value of Japanese manufacturing has a rapid decline of over 30% (US dollar). After validating the statistics from the Ministry of Economy and Trade of Japan, the added value (local currency) of Japanese manufacturing was stable during this period. We verified that from 2012 to 2015, the comprehensive index of the manufacturing industry in Japan declined rapidly; this is largely due to a sharp drop in the value added to manufacturing, in which the current US dollar value is the calculating unit, when the yen’s volatility led to a drop in the US dollar. Thus, Japan’s manufacturing sector itself did not suffer a serious decline.
《Table 2》
Table 2. Comprehensive index of the development of the top nine countries.
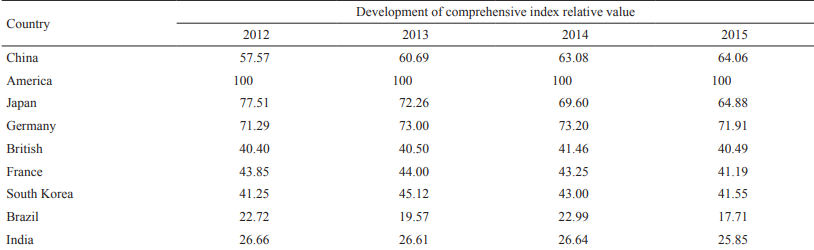
To compare the annual change trend of China, the research group set the annual U.S. manufacturing power composite index to 100 points to calculate the relative scores of other countries (Table 3). Thus, the process of China’s manufacturing power is reflected more intuitively. The gap between China and the US is narrowing; it is known that the score is changing year by year, but the pace of the narrowing gap is slowing.
《Table 3》
Table 3. Relative value of the comprehensive index of the development of the top nine countries.
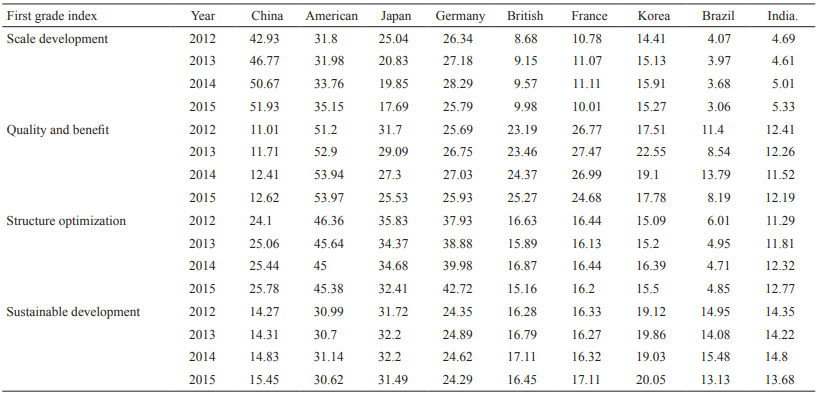
From the 2015 sub-index (Table 4), the scale development of China (51.93) is far ahead of other countries. The United States (35.15) was second, while Germany (25.79) and Japan (17.69) ranked third and fourth, respectively. In terms of the quality benefit, China (12.62) occupies the seventh place, and is in the latter position. The ascension space is large but it is very difficult to improve. The United States (53.97) leads the other countries, and is followed by Germany (25.93), and Japan (25.53). The indices for Britain (25.27), France (24.68), and South Korea (17.78) were higher than that of China. For the structural optimization, China (25.78) is in fourth place, in the middle level. United States (45.38), and Germany (42.72) were the highest rankings, followed by Japan (32.41) in third place. In terms of sustainable development, China (15.45) is in seventh place. At the lower levels, Japan (31.49) is first, United States (30.62) is second, Germany (24.29) is third, and South Korea (20.05) is fourth.
《Table 4》
Table 4. Sub-item index of the manufacturing power of the nine countries from 2012 to 2015.
The analysis above shows that the comprehensive index of China’s manufacturing power grew at high speeds in 2013, 2014, and 2015. In addition, during these three years, the top three countries America, Japan, and Germany differed significantly. The United States and Germany steadily rose, and Japan’s composite index fell significantly under the influence of yen exchange rate fluctuations. Germany surpassed Japan in second place in 2013.
《4 Gap and bottleneck analysis of China’s manufacturing power process》
4 Gap and bottleneck analysis of China’s manufacturing power process
《4.1 Gap analysis》
4.1 Gap analysis
Because the score of China’s manufacturing power index depends on the “scale development” sub-item, this study excludes the “scale development” in the national comprehensive index. To ensure that the sum of the weights is constant, we divided the weight of the scale development level index into the remaining 16 secondary indicators. From 2012 to 2015, we observed differences in the comprehensive indexes of “quality benefit,” “structural optimization,” and “sustainable development.”
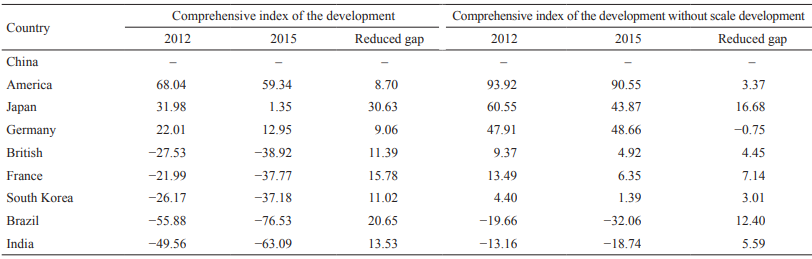
For the scale development factors from 2012–2015, China lagged behind the United States, Japan, and Germany in its comprehensive index, while advanced ahead of the United Kingdom, France, South Korea, Brazil, and India, and the ranking did not change. However, the gap with Japan narrowed in 2015 within two points. Without considering the scale factor, China’s comprehensive index in 2012–2015 lagged behind that of the United States, Japan, Germany, Britain, France, and South Korea, while advancing ahead of Brazil and India, and the ranking did not change. Although the gap with South Korea narrowed to two points, the gap with the US, Japan, and Germany is even greater (Table 5).
《Table 5》
Table 5. Comprehensive index of the development gap except scale development between China and the typical developed countries in 2012.

Considering the factors of scale development, from 2012 to 2015, the gap between China and the typical developed countries was close to 9 points, and the gap with Japan narrowed by more than 30 points. Regardless of the scale development factor in 2012–2015, the gap between China and the US manufacturing process changed from 93.92 to 90.55 points, narrowing only by 3.37 points. The gap between China and Japan changed from 60.55 to 43.87 points, narrowing by 16.68 points. The gap between China and Germany changed from 47.91 to 48.66 points, and the gap is widened by 0.75 points. The gap between China and the UK changed from 9.37 to 4.92 points, narrowing by 4.45 points. The gap between China and France changed from 13.49 to 6.35 points, down by 7.14 points. The gap between China and South Korea narrowed by 3.01 points from 4.40 to 1.39 points.
It is noteworthy that the performance of the manufacturing power’s comprehensive index varied between Japan and China. In 2015, this was driven by depressed manufacturing and a significantly reduced exchange rate; the scope of Japan manufacturing contracted. Therefore, considering the scale development factor, the comprehensive indices of China and Japan were 107.13 and 105.78, respectively. Regarding global manufacturing marketing, the comprehensive index of China was almost the same as that of Japan. However, without including the scale development, the comprehensive index of Japan and China were 111.09 and 67.22, respectively, in 2015, 43.87 points higher than that of China (Table 6). As is shown, Japan had a strong manufacturing ability. Chinese manufacturing was weakened by follow-up development, and there were large gaps with Japan, e.g., in innovation and quality. By comparing the typical developed manufacturing power from the index scores, the highest scale factor is processing. The gap changes between the comprehensive indices from 2012 to 2015 are shown in Table 7. The manufacturing power comprehensive index grew rapidly, owing to the rapid growing scale of China’s manufacturing, and the gap was obviously reduced between China and the typical developed countries. However, the quality benefit, structure optimization, and sustainable development ability, which support the manufacturing power follow-up development, did not exhibit any catching-up or surpassing trend.
《Table 6》
Table 6. Comprehensive index of the development gap except scale development between China and the typical developed countries in 2015.

《Table 7》
Table 7. Comprehensive index of the development gap between China and the typical developed countries from 2012 to 2015.
《4.2 Bottleneck analysis》
4.2 Bottleneck analysis
Based on comprehensive and subentry indices from the nine countries, there are three development bottlenecks during the Chinese manufacturing power process, as follows.
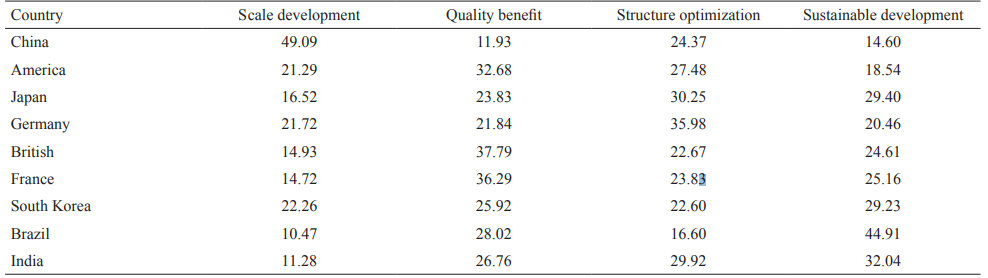
(1) Currently, China’s manufacturing power index is overrelying on the “scale development.” From the share of the four sub-indices in the composite index (Table 8), China’s “scale development” index value accounted for up to 49.09%, undoubtedly promoting the process of creating a powerful country. However, it shows a far-reaching dependence on the other eight countries, and concealing hidden issues. With the slowdown of the scale of China’s growth in quality and efficiency, the excellent structure and sustainable development of the three elements are inadequate for the development. The stamina and international competition prospects are not optimistic. In contrast with other countries, the United States, Countries, Britain, and France have built a global industry, with high quality and efficiency. Germany has mastered the systematic discourse of the global industrial structure optimization. Japan and South Korea’s manufacturing industry maintained a balanced development, albeit a single one. The level of the item is not very prominent, but the overall strength is stable. Owing to the late starts in Brazil and India, although the industrial development level is still weak, they have less negative burdens and the national strategy is more efficient.
《Table 8》
Table 8. Proportion of the sub-index in the composite index of the nine countries in 2015. (%)
(2) “Quality benefit” and “sustainable development” are still China’s weaknesses for the process of creating a powerful nation. Currently, the proportions of China’s “quality benefit” and “sustainable development” in the country’s manufacturing power comprehensive index both rank at the bottom. Although global trade and technical barriers have further increased in recent years, the dilemmas of “quality benefit” and “sustainable development” in China still remain. “Quality benefits” and “sustainable development” complement each other; the “quantity benefit” level is external to the “sustainable development” level of a country’s industry performance, and “sustainable development” is the ability to determine a country’s “quality and efficiency” in international competitiveness. Although our country has adopted the national strategy to increase the manufacturing industry’s “sustainable development” ability to cultivate, the industry’s “quality benefit” level has not significantly improved. Thus, further improvements are required.
(3) “Structure optimization” is still the biggest challenge for China to become a strong manufacturing power. According to the proportions of the four sub-indices in the composite index, the proportion of “scale development” increased by 2.59 percentage points, the proportion of “quality benefit” remained stable, the proportion of “structure optimization” decreased by 1.74 percentage points, and the proportion of “sustainable development” dropped by 0.86 percentage points (Table 9). As shown, the “scale development” sub-index of China’s manufacturing power accounted for half of the composite index, with the ratio increasing each year. The quality and efficiency, structure optimization, and sustained development scoring performance, such as the sub-index score are still weak. It is noteworthy that the proportion of sub-indicators of “structure optimization” in the overall indicator was the same and has continued to decline, showing that China’s traditional manufacturing transformation and upgrading, and the cultivation of emerging industries to achieve significant results, still require time and further strategic support measures. Especially under the condition of continuous decline of industrial scale growth of China’s manufacturing industry, structure optimization, quality benefit, and sustainable development do not have the capability to continuously support the manufacturing power idex; if the manufacturing growth rate declines further, the index of manufacturing power would likely decline instead of increase also.
《Table 9》
Table 9. Proportion of the sub-index in the composite index of China from 2012 to 2015. (%)

《5 China’s manufacturing power in 2016: a preliminary calculation and analysis》
5 China’s manufacturing power in 2016: a preliminary calculation and analysis
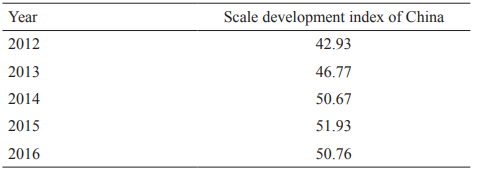
The analysis above demonstrated that from 2012–2015 China’s manufacturing power showed an overall trend of steady growth; the scale of development in the manufacturing power comprehensive index was the most dominant, and had the most significant driving effect; the quality benefit, the structure optimization, and the sustainable development level have been developed, but are still far behind the developed countries such as the United States, Japan, and Germany. Based on macroeconomic situations such as the unstable economic recovery in the emerging market countries, interest rates being promoted by U.S. expected inflation, and the rising expectation of RMB devaluations, and to show progresses in building a manufacturing power, the authors calculate the value added of the manufacturing sector, which has the most significant impact on the manufacturing power index, according to the increase of value added from 2014–2015, and the exchange rate of the RMB against the U.S. dollar in 2016, thus giving a prediction and brief analysis on the 2016 index, when authorities such as the World Bank have not yet fully released original data such as the value added of the manufacturing sector in 2016. The results are shown in Tables 9–11.
《Table 10》
Table 10. Calculation of the 2016 scale development index of China.
《Table 11》
Table 11. Change in the scale development index between China and America from 2012 to 2015.
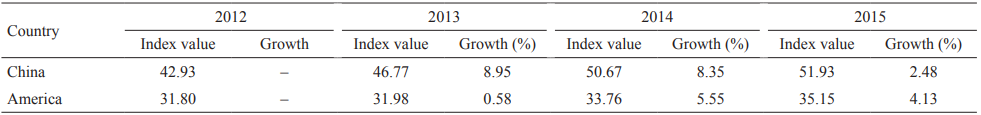
The calculation was based on the growth rate and the change in the exchange rate during China’s manufacturing industry from 2014–2015. As shown, in the case of exchange rate fluctuations and manufacturing growth decline, the scale development index has experienced years of rapid growth, i.e., from 2012–2014. In 2015, China’s manufacturing power index growth rate slowed down significantly. However, for the case of significant depreciation in 2016, the scale development index of 2016 will likely show negative growth, reflecting a significant impact of the exchange rate variations on the scale development index (Fig. 1).
《Fig. 1》

Fig. 1. Measurement and process comparison of the scale development index of China’s manufacturing power in 2016.
Additionally, it is noteworthy that with Chin’s scale development entering the low- and medium-speed growth stage, thepromoting effect of the scale on the comprehensive index will further weaken. If the quality, efficiency, structure optimization, and sustainable development cannot eliminate the current lowgrowth trend, China will experience a major challenge of becoming the number-one manufacturing powerhouse in the global manufacturing industry by entering the first phalanx of manufacturing power in 2045. From the gap with the United States, from 2012 to 2015 (4 years), a total increase of 13.5 Chinese index points, corresponding to an average annual increase of 3.4 was shown; similarly, the United States showed a total increase of 4.8 points, corresponding to an average annual increase of 1.2 points. The gap narrowed from 68 to 59.3, and the average annual reduction was 2.17 points. According to the speed and current gap (59.3), a further 27 years is required for further improvement. In fact, China’s exponential growth has begun to decline from 2012 to 2015. Therefore, growth of China’s manufacturing industry is transferred from a high-speed stage to a medium-high speed stage. As such, we must accelerate the adjustment of the industrial structure to rely on innovation, and upgrade traditional industries and emerging industries to nurture, grow, and improve quality and efficiency, ultimately achieving global competitiveness.
《6 Conclusions》
6 Conclusions
The manufacturing power process in China is steadily advancing, and has entered a new stage of normal development. The scale advantage is still obvious, but gaps with developed countries still remain. Currently, the global manufacturing industry is entering an unprecedented innovation-intensive and industrial revolution era. An accurate analysis of the fundamental gap between China and the United States, Germany, Japan, and other manufacturing powers, aimed at the weak links of quality benefit, structure optimization, and sustainable development, is crucial for China to realize the inevitable manufacturing power requirement and direction of this endeavor. In the future, we should continue to maintain the scale advantages, accelerate industrial transformation and upgrading, persist in innovation-driven and quality-first efforts, and promote the comprehensive and beneficial development of the manufacturing industry, to lay a solid foundation for achieving the transition from a big manufacturing country to a strong manufacturing power.
In the “manufacturing power (Phase III)” study, the research group will strengthen cooperation with the United Nations Industrial Development Organization, the World Bank, the World Intellectual Property Organization, and the World Trade Organization Authority Communication. The research group will also support the index report seminar, provide positive publicity, and continue to perform a comprehensive evaluation and publishing work of the index for the 2017 manufacturing power. Further, we will perform research on the characteristic indices and continue to optimize the manufacturing power’s index system. In addition, the research group will evaluate the manufacturing power construction process as follows. ① Comprehensive research and analysis on the changing trend of the manufacturing power index in the last five years. ② Comparative study on the construction process of a typical national manufacturing power. ③ Focus on the weak links, such as “quality benefit”, “structure optimization”, and “sustainable development”, and perform a detailed analysis, obtain the gap, enhance the path, and propose specific countermeasures and suggestions. ④ Combining the ten advantages and strategic industries of “China made 2025,” perform an in-depth investigation and key index research of typical industries and key areas.


 京公网安备 11010502051620号


