

《1 Introduction》
1 Introduction
The rate at which the Chinese economy is growing has accelerated the process of urbanization, improved the standard of living for most residents, and led to a series of environmental problems. According to the China Statistical Yearbook 2017, the yield of China’s municipal solid waste was 2.04 × 10⁸ t in 2016, and it was increasing at an annual rate of 8 %–10 % [1]. If the large volume of domestic waste is not handled properly, the resulting environmental problem will become fairly serious. The composition of China’s municipal solid waste is complex, with food waste being the most important component, accounting for approximately 15.74 %–85.8 % [2]. Due to the high content of moisture and organic matter in food waste, spoilage and bacterial growth can occur easily. At the same time, large amounts of food waste are used as animal feed, which can easily cause the spread of diseases and threaten human health. Therefore, harmless, reduced, and resourceful treatment of food waste has received significant attention.
At present, the main treatment methods for food waste are landfills and composting [3]. Landfill treatment solves the problem of food waste in the short term. However, this approach requires a large amount of land, with low resource recovery and severe pollution of land and water. Composting of food waste can achieve the objective of resource utilization [4]. Furthermore, food waste compost (FWC) not only alleviates the shortage of chemical fertilizer resources in China, but also reduces the environmental pollution caused by food waste. Additionally, the moisture content of food waste is reduced after composting, while porosity and dispersion are improved. However, FWC contains significant impurities, which makes the quality of compost poor. The oil and salt content of food waste is high after composting. Thus, the use of compost as fertilizer can destroy the soil structure and cause soil compaction and salinization [5]. Therefore, FWC must be treated effectively to realize harmless decrement in and resourceful disposal of food waste.
Torrefaction pretreatment [6,7] is a slow pyrolysis process conducted at low temperatures ranging from 200 °C to 300 °C under anoxic or oxygen-free atmospheric pressure conditions. The solid products obtained by torrefaction have high calorific value and low moisture content, while the grinding ability, energy density, and combustion characteristics of solid products are obviously improved. Poudel et al. [8] studied the fuel characteristics of food waste at torrefaction temperatures ranging from 150 °C to 600 °C and residence times in the range of 0–50 minutes. It was found that torrefaction could improve the fuel properties of solid products by reducing the ratios of O/C and H/C, and that the torrefaction temperature had a greater influence on fuel characteristics than residence time. Yuan et al. [9] studied the effect of torrefaction on municipal solid waste. With the increase in torrefaction temperature, the O and H contents of the solid products decreased, while the fixed carbon content increased. Moreover, the combustion characteristics improved. Torrefaction can reduce the content of Cl in municipal solid waste. In this study, the Cl content decreased with the increase in torrefaction temperature. In this paper, the effects of torrefaction temperature on fuel properties (proximate analysis, ultimate analysis, calorific value, energy yield, and mass yield) and combustion characteristics are explored.
《2 Experimental materials and methods》
2 Experimental materials and methods
《2.1 Materials》
2.1 Materials
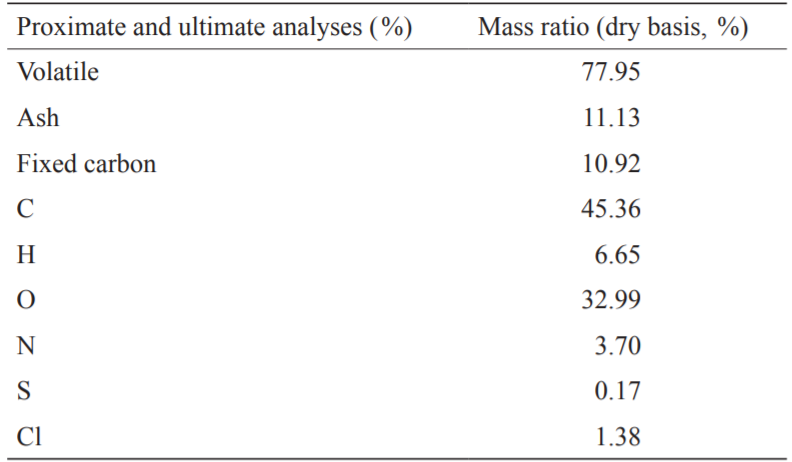
FWC from southern China was selected as the raw material for the experiment. The samples were crushed to less than 50 mesh and dried at a temperature of 105 °C for approximately 24 hours until a constant weight was obtained. The proximate analysis, ultimate analysis, and calorific value of the FWC (dry basis) are shown in Table 1. It can be inferred from the table that the O and N contents of FWC are high, thus generating NOx and other gases during combustion, while a higher O content results in lower FWC energy quality.
《Table 1》
Table 1. Proximate and ultimate analyses of raw FWC.
《2.2 Torrefaction》
2.2 Torrefaction
The torrefaction experiments were carried out in a horizontal tubular furnace (Fig. 1). During the torrefaction process, approximately 10 g of FWC were weighed in a quartz boat and placed in a quartz tube. The quartz tube was sealed with rubber stoppers at both ends. High-purity N2 (99.99 %) at a flow rate of 100 mL·min−1 was introduced into the tube for approximately 30 minutes to ensure that no air remained in the tube before the experiment. Torrefaction experiments were conducted from room temperature to the five temperature points of 250 °C, 300 °C, 350 °C, 400 °C, and 450 °C, respectively, at a heating rate of 10 °C·min−1. The reaction was maintained at the set temperature for 30 minutes. The gas tar was cooled to a liquid state with an ice-water mixture and left in the conical flask. The NaOH solution was allowed to absorb the HCl in the gas product. Finally, the air bag collected the exhaust gas generated during the constant temperature condition. After torrefaction, the quartz boat was removed and the solid product was weighed. During each experiment, the solid product after weighing was crushed to 100 mesh using a ball mill and named T250, T300, T350, T400, and T450, respectively. The quartz tube and rubber stopper were weighed before and after the experiment to calculate the liquid yield. The mass yield of the solid and liquid products of the FWC were calculated according to Eq. (1), while the gas yield was obtained by subtraction. Further, Eq. (2) was used to determine the energy yield of the solid product.
where m(torrefied FWC) represents the weight of torrefied FWC (g), m(raw FWC) represents the weight of raw FWC (g), HHV (torrefied FWC) represents the higher heating value of torrefied FWC (kJ/kg), and HHV(raw FWC) represents the higher heating value of raw FWC (kJ/kg).
《Fig. 1》

Fig. 1. Torrefaction experimental setup.
《2.3 Physicochemical analysis of FWC》
2.3 Physicochemical analysis of FWC
The volatile and ash contents of the samples were measured according to the ASTM D3175–11 and ASTM D3174–11 standards with a SX-G07123-type muffle furnace, while the fixed carbon content was obtained by subtraction. The ultimate analyses were performed using a vario EL cube elemental analyzer, and the O content was calculated by subtraction. The calorific value was measured using WZR-1T-CII and IKA C2000 microcomputer calorimeters and the ASTM D5865–03 standard.
To detect the Cl content in the samples more accurately, Cl was divided into soluble Cl and insoluble Cl. Contents of each were determined using the extraction method and the Eschka method (GB/T33558–2014). After extraction, the Cl in the filtrate was soluble, whereas the Cl in the filter residue was insoluble. The total Cl content was the sum of the soluble Cl and the insoluble Cl. The absolute content of Cl was calculated according to the following equation:

where WCl-absolute ( %) and WCl-relative ( %) represent the absolute content and relative content of soluble Cl and insoluble Cl, respectively. Xmass refers to the mass yield of the solid product.
《2.4 Combustion experiments》
2.4 Combustion experiments
The SDT 650 thermogravimetric system was selected to study the combustion characteristics of the torrefied FWC solid product and raw FWC. During combustion experiments, a sample of approximately 10 mg was placed in an Al2O3 crucible. The furnace was initially heated from room temperature to 30 °C and maintained at this temperature for 30 minutes. Subsequently, it was heated to 900 °C at a rate of 20 °C·min−1, with air flow at 30 mL·min−1.
《3 Results and discussion》
3 Results and discussion
《3.1 Characteristics of torrefaction》
3.1 Characteristics of torrefaction
Torrefaction is a slow pyrolysis process [10,11] that can be divided into three stages: heating, torrefaction, and cooling. During the heating stage, the temperature of the sample increased from room temperature to the torrefaction temperature. When the temperature was higher than 100 °C, the free water in the sample evaporated. After continuing to heat the sample to 200 °C, the hemicellulose decomposed and dehydroxylation occurred, releasing the physically bound water with a small amount of light volatiles. During the torrefaction stage, the sample was heated to the preset temperature and maintained for a period, during which the sample was torrefied. In the torrefaction stage, a large amount of hemicellulose decomposed, along with the depolymerization and deoxidation of cellulose. Weight loss was the greatest during this stage. In the cooling stage, the sample was cooled from the set temperature to room temperature, and its physicochemical properties tended to be stable.
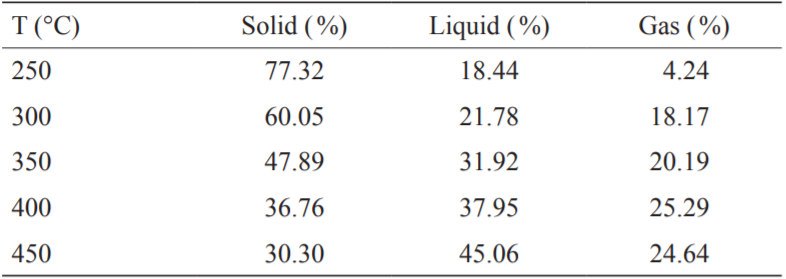
Table 2 shows the torrefied product distribution of FWC at various torrefaction temperatures. It can be seen from Table 2 that the torrefaction temperature had a great influence on the yield of the products. When the torrefaction temperature increased, the hemicellulose in the FWC decomposed [12], gradually decreasing the yield of the solid product of torrefied FWC. The release of large amounts of oxygen-containing volatiles increased the mass yield of the liquid products [13]. When the torrefaction temperature increased from 250 °C to 300 °C, the mass yield of solid products decreased from 77.32 % to 60.05 % because of the loss of water and the thermal decomposition reaction that generated volatile gas [14]. Additionally, the mass yield of the liquid and gas products increased from 18.44 % and 4.24 % to 21.78 % and 18.17 %, respectively. As the torrefaction temperature continued to increase, the mass yield of the solid product was less than 50 %, and the removal of a large amount of combustible components from the solid product reduced the fuel quality and caused a wastage of energy.
《Table 2》
Table 2. Product yield of torrefied food waste compost (FWC).
《3.2 Physicochemical properties of FWC solid products》
3.2 Physicochemical properties of FWC solid products
The proportion of volatiles in raw FWC was 77.95 %, while the ash and fixed carbon contents were relatively low (i.e., 11.13 % and 10.92 %, respectively). Table 3 indicates that the torrefaction temperature had a significant influence on the proximate analysis of FWC. As the torrefaction temperature increased, the ash and fixed carbon contents in the FWC solid product gradually increased. However, the volatile matter with the highest content decreased significantly. The fixed carbon content of T300 was 2.1 times that of raw FWC, while the volatile content was 0.73 times that of raw FWC. Before the torrefaction temperature increased to 300 °C, the effect of torrefaction dominated, with the release of moisture, light components, and volatile non-condensable gases. In addition, the volatile content was reduced. Above 300 °C, the pyrolysis reaction was enhanced, and the decarbonization and dehydroxylation reactions of the organic components in the FWC solid product resulted in the generation of semicoke, which promoted an increase in the fixed carbon content. The volatile content of the solid FWC product decreased and the fixed carbon content increased. Moreover, the fuel characteristics improved significantly. The increase in ash content was attributed to the increase in mass loss that caused an accumulation of alkali metal species. However, the high ash content increases the risk of contamination and slagging in the combustion process. Therefore, the torrefaction temperature should not be too high. At the same time, the researchers discovered and verified that the cleavage of O―H groups in the biomass and the formation of unsaturated non-polar substances inhibited the formation of hydrogen bonds and the absorption of moisture [15]. Thus, the FWC solid product was enhanced in hydrophobicity, making spoilage or deterioration difficult and facilitating ease of transportation and storage as fuel.
《Table 3》
Table 3. Proximate and ultimate analyses results for torrefied FWC.
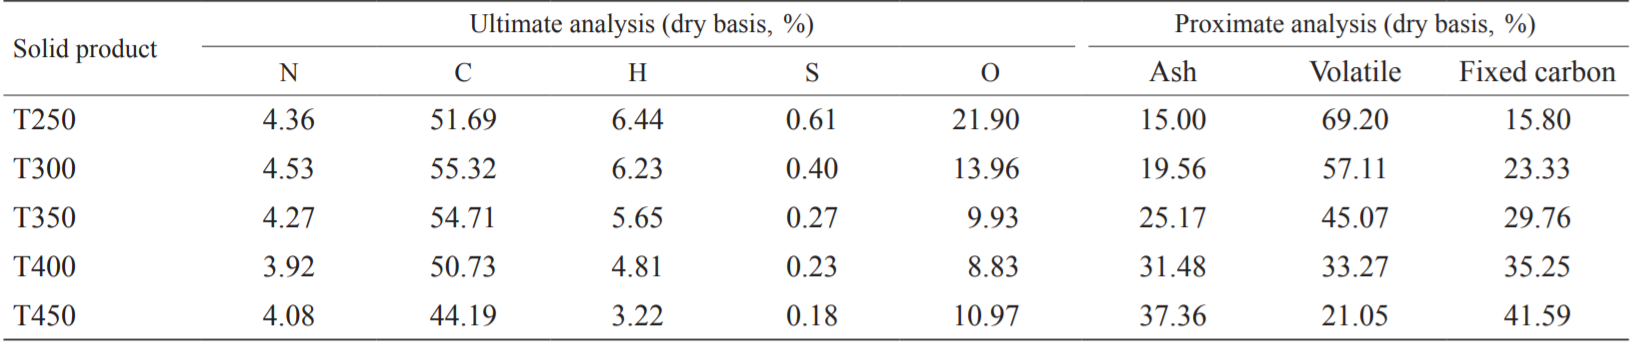
Table 3 provides the results of proximate and ultimate analyses of the FWC solid product. It can be seen from Table 3 that torrefaction had a significant effect on the content of elements in FWC (the higher the temperature, the more significant the effect). After torrefaction, the C content of the solid product showed a tendency to increase initially and subsequently decrease because of the volatilization of water and light organic volatiles [16], reaching a maximum of 55.32 % at 300 °C. When the torrefaction temperature gradually increased, the pyrolysis reaction was gradually enhanced (in this temperature range, the torrefaction reaction was converted to pyrolysis reaction), and the increase in the amount of hydrocarbons generated caused the C content in the solid product to decrease. During torrefaction, the FWC underwent the decomposition of oxygen-containing functional groups and decarboxylation and dehydroxylation reactions [17–19], generating H2O, CO, and CO2, as well as hydrocarbons (such as methane) and oxygenated tars, for example, resulting in the gradual decrease of O and H in FWC solid products with the increase in torrefaction temperature. From T250 to T300, the content of O in FWC solid products rapidly decreased. Therefore, torrefaction can reduce the O content in FWC solid products, increase the energy density and the C content of the solid products, improve FWC fuel quality, and achieve the purpose of energy treatment. As the torrefaction temperature increased, the N and S contents in the solid product showed a downward trend, while the S content changed considerably, from 0.61 % at T250 to 0.18 % at T450. Torrefaction reduced the content of S and N in the FWC, effectively reducing the possibility of SOx and NOx emissions in the combustion process. Moreover, the treatment was harmless.
The fuel characteristics can be evaluated using the O/C and H/C molar ratios. Fig. 2 shows the O/C and H/C molar ratios of the raw FWC and FWC solid products at various torrefaction temperatures. Lower molar O/C and H/C ratios in the fuel can suppress the generation of water vapor and fumes during combustion, reduce the loss of thermodynamic energy, and increase combustion efficiency [18]. In this study, as the torrefaction temperature increased, the molar ratios of O/C and H/C in the FWC solid product gradually decreased. When the torrefaction temperature was below 300 °C, the molar ratios of O/C and H/C decreased sharply. When the torrefaction temperature was above 300 °C, the C content began to decrease. Moreover, the molar ratio of O/C decreased slowly, increasing at T450, while the H/C molar ratio continued to decline. When the torrefaction temperature was higher than 300 °C, the molar ratios of O/C and H/C were lower. Additionally, the generation of water vapor and flue gas during the combustion process was low, the loss of thermodynamic energy was reduced, and the combustion efficiency was improved. Therefore, torrefaction can obviously improve FWC fuel characteristics.
《Fig. 2》
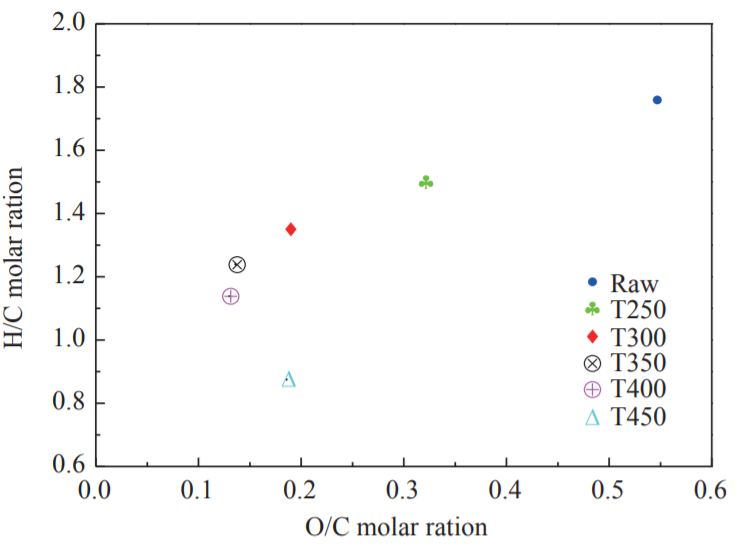
Fig. 2. O/C and H/C molar ratios of torrefied FWC and raw FWC.
The soluble Cl in FWC was mainly derived from KCl and NaCl, whereas the insoluble Cl was mainly derived from organic compounds. Fig. 3 shows the absolute content of Cl in raw FWC and FWC solid products. It can be inferred from the figure that as the torrefaction temperature increased, the absolute contents of both soluble Cl and insoluble Cl decreased. After the raw FWC was torrefied at 250 °C, the absolute content of soluble Cl changed minimally, while the insoluble Cl decreased from 0.16 % to 0.12 %. When the torrefaction temperature was increased between 250 °C and 350 °C, the effect on insoluble Cl was minimal, while the soluble Cl was reduced significantly. The total Cl content in T300 was 1.27 %, indicating a reduction of approximately 0.11 % compared to the raw FWC. This resulted mainly from the reaction of Cl with oxygen-containing functional groups and free radicals to produce HCl, CH3Cl, and Cl-tar [20–23]. When the torrefaction temperatures were 400 °C and 450 °C, the content of insoluble Cl decreased significantly, while the content of soluble Cl tended to be stable. The decrease in the absolute content of Cl in the FWC solid product indicated that torrefaction released the Cl element in the FWC, reducing the emission of dioxin precursors during the combustion of the solid product and avoiding secondary pollution.
《Fig. 3》
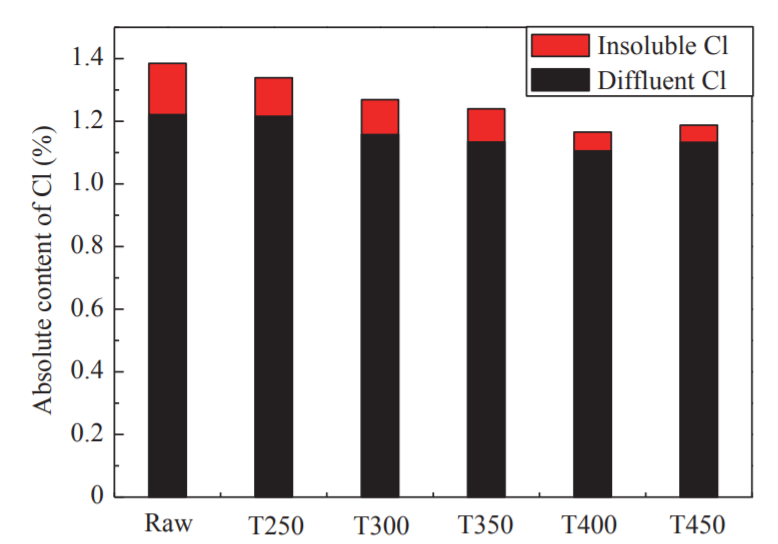
Fig. 3. Absolute content of Cl in torrefied FWC and raw FWC.
The energy yield is an effective parameter for characterizing the FWC energy change during torrefaction and can be calculated from the mass yield and calorific value. Fig. 4 shows the calorific value and energy yield of the raw FWC and FWC solid products. It can be seen from the figure that the calorific value of the FWC solid products increased significantly with an increase in the torrefaction temperature. It reached a maximum of 24 783 kJ·kg−1 at 300 °C. When the torrefaction temperature was higher than 300 °C, the FWC solid product calorific value tended to decrease because of the pyrolysis reaction in the high temperature section. When the torrefaction temperature ranged from 300 °C to 350 °C, the pyrolysis reaction was weak and the calorific value decreased slowly. When the torrefaction temperature increased above 350 °C, the pyrolysis reaction was enhanced and the calorific value of the solid product decreased significantly. Therefore, the FWC torrefaction temperature had a negative effect on the calorific value. It can be seen in Fig. 4 that as the torrefaction temperature increased, the energy yield of the FWC solid product gradually decreased from 87.83 % to 25.67 %. When the torrefaction temperature was less than 300 °C, the energy yield of the FWC solid product was between 73.9 % and 87.83 %, with most of the energy being retained in the solid product. When the torrefaction temperature increased above 300 °C, the enhanced pyrolysis reaction gradually reduced the energy yield of the solid product to less than 60 %. This study showed that torrefaction consumed energy. Therefore, an excessively high torrefaction temperature not only resulted in the loss of FWC energy, but also excessive energy consumption and wasted energy, along with a reduction in economic feasibility. Therefore, the torrefaction temperature should not be too high.
《Fig. 4》

Fig. 4. Caloric value and energy yield for torrefied FWC solid products and raw FWC.
《3.3 Analysis of combustion characteristics》
3.3 Analysis of combustion characteristics
The thermogravimetry-derivative thermogravimetry (TG-DTG) curve definition method was used to determine the ignition point of the sample in this study (ignition temperature: an important feature point to measure the ignition characteristics of the sample). It is recorded as Ti, °C. On the DTG curve, the over-peak point A is intersected by the vertical line and the TG curve at point B. Point B is the tangent line of the TG curve, and the TG curve is the initial parallel line at point C. The temperature corresponding to this point is the ignition point (Fig. 5). If there are multiple peaks in the DTG curve, the vertical line at the first peak point on the curve and the intersection point is used with the TG curve to determine the ignition point [24]. Figs. 6, 7, and 8 show the TG, DTG, and differential scanning calorimetry (DSC) curves, respectively, of raw FWC and FWC solid products. As shown, the combustion of raw FWC and FWC solid products can be divided into four stages [25].
《Fig. 5》

Fig. 5. Determination of the ignition point.
《Fig. 6》
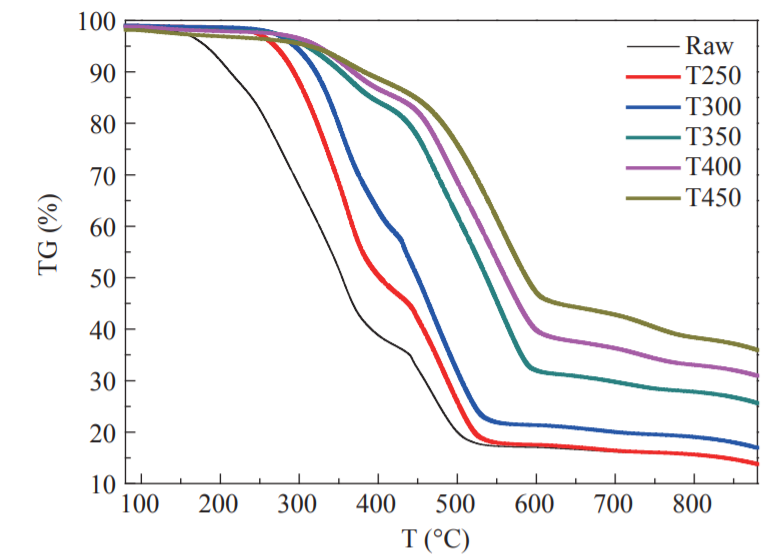
Fig. 6. TG curves of torrefied FWC and raw FWC.
《Fig. 7》
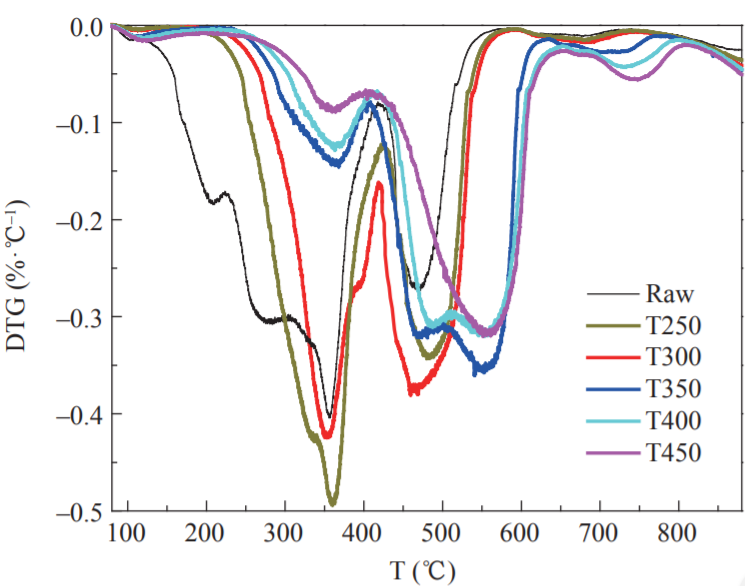
Fig. 7. DTG curves of torrefied FWC and raw FWC.
《Fig. 8》
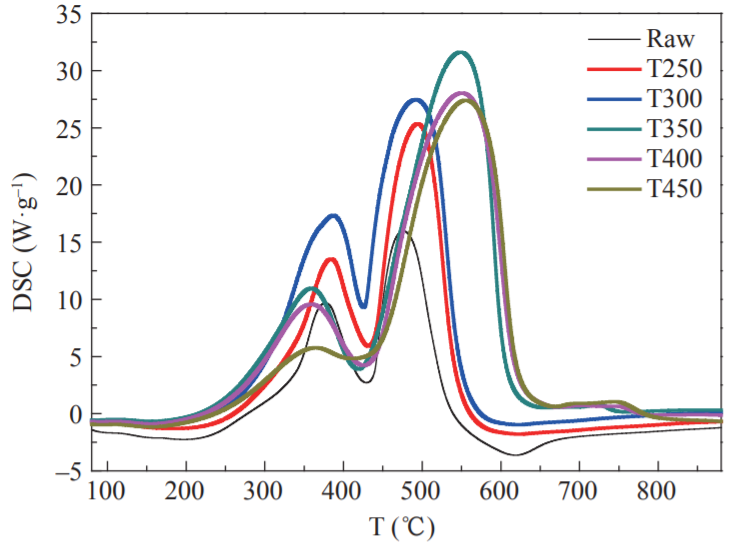
Fig. 8. DSC curves of torrefied FWC and raw FWC.
The first stage was the water release stage (also called the drying stage). The temperature of the sample was increased from room temperature to 150 °C, and the TG curve in the interval changed smoothly. Since the FWC had a dry basis, the weight loss was small. The evaporation of moisture required heat. Therefore, the DSC curve of the sample combustion was negative. The peak for raw FWC was larger than that for the FWC solid products, while the DSC curve of the raw FWC had more endothermic peaks than that of the FWC solid products. Torrefaction caused the release of moisture in raw FWC. Thus, the solid product absorbed less heat and the DSC peak was smaller.
The second stage involved the release and combustion of the volatiles. The temperature ranged from 150 °C to 420 °C, with the appearance of the first obvious peak of the DTG curve. At this stage, the low molecular volatiles reached the ignition point first and promoted the combustion of more volatiles. The content of volatiles in raw FWC was relatively high. Therefore, the reaction was rapid and severe, and the mass loss was 63 %. After torrefaction, the volatiles in the FWC were released, the ignition point increased, and weight loss during the combustion stage of the volatiles decreased. When the torrefaction temperature was higher than 300 °C, the pyrolysis reaction intensified. A large amount of volatiles in the FWC was released, while the decarboxylation and dehydroxylation reactions were accompanied by the promotion of coke production. The weight loss peaks of T350, T400, and T450 were obviously reduced, and the weight loss due to combustion was only 10 %–15 %, which was consistent with the results of the proximate analysis. At this stage, the first obvious peak appearing in the DSC curve corresponded to the combustion of volatiles in the samples. A large amount of heat was emitted and the DTG curve characteristics were consistent, possibly because of the higher content of bound water in raw FWC, as well as the more complete combustion of the FWC solid product. The heat discharge in the volatile combustion stage of FWC solid products was greater than that in the original sample, while the heat discharge of T250 and T300 volatiles was larger. When the torrefaction temperature was subsequently increased, the heat discharge was reduced.
The third stage was the fixed carbon combustion stage, with a temperature range of 420–660 °C. The combustion of the volatiles promoted the combustion of the fixed carbon in FWC, so that all the second fixed carbon combustion peaks in the DTG curve were closely linked to each other. In fixed carbon combustion, the raw FWC’s weight loss was lower than that of the FWC solid product, and the weight loss peak was low. As the torrefaction temperature increased, the fixed carbon content of the FWC solid product increased, while the weight loss and peak weight loss also increased significantly. Further, the T300 weight loss peaked reached its maximum. From the DSC curve (Fig. 8), it can be seen that the maximum combustion heat release occurred in the fixed carbon combustion stage. Torrefaction caused the fixed carbon content in the FWC to increase and the volatile content to decrease. Therefore, the peak area and width of the DSC curve of the FWC solid product at this stage increased. Compared with the raw FWC, the volatile content of the sample after torrefaction decreased, the surface morphology changed, the time required for combustion decreased, while the heat released increased. As the torrefaction temperature increased, the content of fixed carbon in the solid product increased, the heat during combustion increased, and the fuel quality improved. When the torrefaction temperature was higher than 300 °C, the fixed carbon and ash content increased. The increase in ash content had a significant role in promoting carbon combustion, leading to an increase in the peak area of the DSC curve with the increase in torrefaction temperature. During the combustion process, excessive ash content can easily cause slagging problems. Therefore, the torrefaction temperature should not exceed 300 °C.
The fourth stage was the decomposition of minerals [26]. The temperature at this stage was 660–770 °C and the weight loss was below 5 %. As the torrefaction temperature increased, the ash content in the FWC solid product increased. Thus, the T450 weight loss peak in the DTG curve was maximized. The decomposition of minerals was an endothermic process and the DSC curve was negative.
The entire process of sample combustion indicates that compared with the raw FWC, the fuel characteristics of FWC solid products improved, and the calorific value of combustion increased significantly. Although T350, T400, and T450 had large heat releases from combustion, the energy yield was lower. A large amount of energy was lost during the torrefaction process, and the problems of slagging and contamination caused by excessively high ash content greatly limited the use of FWC as a fuel. Therefore, the optional torrefaction temperature range was identified as 250–300 °C.
《4 Conclusions》
4 Conclusions
The study showed that torrefaction had a significant influence on the physicochemical properties and fuel properties of FWC. Thus, it can be used as a pretreatment technology for FWC.
(1) Torrefaction had a significant effect on the proximate analysis and ultimate analysis of FWC. As the torrefaction temperature increased, the C and fixed carbon content increased. Additionally, the O, N, S, and Cl content and volatile content decreased and calorific value increased. Torrefaction pretreatment is beneficial for energy utilization, a reduction in secondary pollution, and the harmless treatment of FWC.
(2) When the torrefaction temperature increased, the energy density increased, while the quality and energy yield of the product decreased. Further, the torrefaction process consumed energy, and an excessively high torrefaction temperature resulted in a waste of the FWC’s energy. Therefore, the torrefaction temperature should not be too high.
(3) The combustion of FWC and FWC solid products occurred in four stages: water release, volatile combustion, fixed carbon combustion, and mineral decomposition. After torrefaction, the fuel quality of FWC improved significantly, the burning rate accelerated, and the heat release from combustion increased significantly. Therefore, the ideal torrefaction temperature was identified to be between 250 °C and 300 °C.


 京公网安备 11010502051620号


