

《1 Introduction》
1 Introduction
With the deepening of international trade due to the Belt and Road initiative (BRI), greater trade in goods and services has resulted in direct and indirect environmental impacts from various links in the production process, that is, changes in the flow of environmental elements embedded in goods and services across multiple regions of the world, including the international flow of virtual water.
The water resource security situation in China is very severe. Water resources per capita and available water per capita are both low. With the development of the national social economy, water shortages have gradually emerged as a new challenge. Water shortage has become one of the most important ecological and economic problems in Northwestern and Northern China; therefore, promoting the sustainable utilization of water resources is necessary for sustainable development.
Virtual water, a new concept proposed in the mid-1990s, refers to the amount of water needed to produce goods and services [1]. At present, virtual water trade has become a hot topic in both domestic and foreign research. The more commodities or services are traded, the more virtual water is stored “invisibly” in other commodities. The virtual water flow through trade can alleviate the shortage of local water resources, which may provide a new way to solve regional water security problems in China [2].
《2 Literature review on trade virtual water》
2 Literature review on trade virtual water
Based on input–output tables and water resource consumption data, a water resource input–output model can be used to account the water footprint and virtual water flow embodied in various industrial sectors, regions, and inter-regions. It is important to account the transfer and consumption of water resources among regions. To clarify the responsibility for water utilization in the world, Arto et al. [3] indicated that trade has led to the international transfer of vitual water. The EU-27 is the largest virtual water importer in the world, while China and India are the main virtual water exporters. Wu et al. [4] used a multi-regional input–output model to analyze the demand patterns and the spatial and sectoral patterns of virtual water flows in China’s provinces. Virtual water outflows in most provinces and regions were directed mainly to other provinces in China, and the inflows of virtual water in most provinces and districts were also derived mainly from other provinces in China. Beijing has become a virtual water import area and has realized the safe and rational allocation of water resources through the improvement of water use efficiency and the virtual water trade [5]. Okadera et al. [6] assessed the water footprint of energy supplies in the Liaoning Province of China, finding that Liaoning’s energy supply is dependent on water resources in neighboring provinces. To ensure future regional energy security, water resources will need to be effectively managed through water-saving power generation and inter-sectoral water allocation.
Great differences in the results of analyzing industrial water consumption characteristics can result from using only the direct water consumption coefficient and the comprehensive utilization of total water use coefficient, the correlation degree and other indictors. There is a need for a comprehensive evaluation on the characteristics of sectoral water consumption [7]. Zhou and Shi [8] constructed a “value–physical” mixed input–output table to accurately account the trade embodied virtual water of various industries and regions, and evaluate the negative effects of virtual wastewater on production sites and the national environment, with the consideration of the physical fresh water consumptiona and wastewater discharge.
At present, the research on the virtual water trade in China and regions along the Belt and Road has not received enough attentions, especially the research on tracking the virtual water embodied in trade between China’s subnational regions and other countries. Water resources are consumed in the production and consumption processes of products. On the basis of existing research, this research constructed a sub-national–national–global scaled nested model by linking Chinese multi-regional input-output table with the world input-output table, to accurately account the trade embodied virtual water and track the sources and destinations of virtual water flows in the global supply chain both from producer and consumer perspectives. In doing so, we aimed to answer the following questions: Is the BRI beneficial to China’s water security? Which areas are the most important source and destination of the virtual water trade? What forms of industrial water resource management needs to be further strengthened? Our research aimed to emphasize the strategic significance of providing a strong scientific basis for China's active participation in virtual water trade and the establishment of a new global water security strategy under the Belt and Road initiative.
《3 Methods and data》
3 Methods and data
《3.1 The construction of the W-G-MRIO model》
3.1 The construction of the W-G-MRIO model
The multi-regional input–output method (MRIO) is applied to systematically analyze the implied environmental impact in inter-regional trade flows of products or services and also analyze the embodied environmental impacts of trade relations at regional and industry scales. The MRIO method distinguishes between net producers and net consumers and is an important method in the fields of sustainable assessment and industrial ecology. This study adopts the Multi-regional Input–Output Table of 30 Sectors of 30 Provinces of China compiled by the Institute of Geographic Science and Natural Resources Research of the Chinese Academy of Sciences. There are two versions, for the years 2007 and 2010, which are the latest and most accurate Chinese MRIO tables available until this research. The international import and export portions of the table are given in one row and one column respectively, and an interface with the world MRIO table is reserved to facilitate linkage with the international MRIO table. The China MRIO table is linked to the World Input–Output Database (WIOD) compiled by the European Union. The flow from sector i of each region p in the Chinese province to sector j of region s in the world MRIO table, is decomposed from total exports in China’s MRIO table proportionally with China’s exports in the world MRIO table. The global multiregional input–output (G-MRIO) model was established by decomposing China into 30 provinces [9,10].

where is the outflow from sector i in region p (one province in China) to sector j in region s.
  refers to exports from the entirety of China to region s. The estimation is shown in the right side of the formula, by multiplying the proportion of China’s exports to region s out of total national exports by the total provincial exports.
This research constructed an environmental extended W-G-MRIO model with the nested G-MRIO table to analyze the water footprint (W ) of international trade. Assuming there are m regions in the world, the total output in each region will be

Compared with the balance formula of the single-regional input–output method, MRIO includes not only intraregional intermediate flow  and final demand
  but also inter-regional intermediate flow
  and final flow
  from region
  to other regions.
The MRIO model of m regions can be expressed in a matrix:

The submatrix denotes the sectoral trade relationship among the regions,  indicates the industrial input from region to region s , and indicates the final consumption flow. The computional formula for water footprints of the final consumption matrix is as follows:

Where  is the water consumption of per unit output in region .
Thus, the virtual water footprint in a region both from consumption-based and production-based perspectives can be accounted for with a given final consumption or final production vector:

where is the final consumption provided by local production in region , and  is final products imported from region s .
The virtual water footprint from the production-based perspective can be obtained from the final production vector in the MRIO model:

and the virtual water footprint of the consumption-based perspective is obtained from the final consumption vector:

where F is the virtual water intensity in each region, and A is the technology matrix.
The final consumption provided by local production ( ) can be calculated by excluding the inter-regional flow in  and
and  in the formulas above:

The associated virtual water can be quantified by Formula (7) or Formula (8). The subsequent virtual water quantity of imports and exports can be obtained with the following formulas:

where IM and EX denote the virtual water contained in imports and exports, respectively. The difference between virtual water imports and exports is the balance:

A region will be a net virtual water exporter (net producer) if BEET is positive; and it will be a net virtual water importer (net consumer) if BEET is negative; while it will be in virtual water balance when BEET is zero.
《3.2 Research areas》
3.2 Research areas
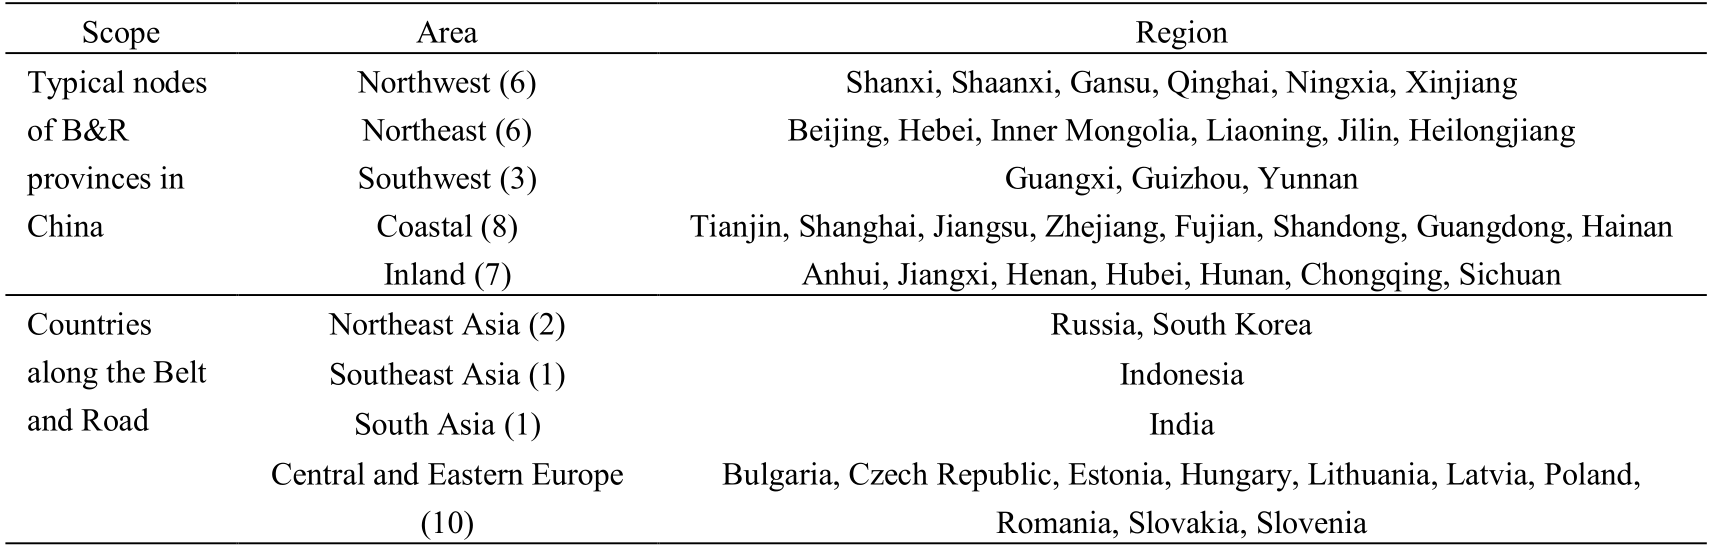
The BRI is a global regional cooperation initiative. Therefore, there are no specific space constraints that impinge on defining countries along the Belt and Road. In basis of WIOD environmental database, this study constructed the environmental database including 14 typical BRI countries and 30 sub-naitonal regions in China. According to the Economic Corridors and the “21st-Century Maritime Silk Road” Route proposed by Vision and Actions for Promoting the Joint Development of the Silk Road Economic Belt and the 21st Century Maritime Silk Road, 30 Chinese provinces and municipalities directly under the Central Government will be merged into 5 major regions. Our research scope and classifications are shown in Table 1.
《Table 1》
Table 1. Typical research areas along the Belt and Road.
《3.3 Data source》
3.3 Data source
In this study, the term of water consumption (i.e., green water and blue water, excluding gray water) is adopted which is estimated primarily from the five sectors of agriculture, industry, construction, services, and residents. The green and blue water used in agriculture is estimated according to the output of crops and livestock versus the water consumption coefficient. The output data for agricultural and livestock products are from the China Agricultural Yearbook of 2011 and the China Statistical Yearbook of 2011, respectively. The coeffiencts of the green water and blue water consumption of different crops and livestock in different regions in China can be referred to in relevant UNESCO reports [11,12].
The water consumption of each industrial sector is evaluated by subtracting wastewater from water withdrawal. The structure of water withdrawal is mainly drawn from the second national economic census, the China Economic Census Yearbook of 2008 (Energy Volume).
The data on waste water in all industrial sectors in China in 2010 is mainly from the China Environmental Statistics Yearbook of 2011. In addition, the water consumption data for the construction and service industries are mainly calculated according to the water withdrawal data from the China Water Resources Bulletin and the water consumption intensity reported by Zhao et al [13].
《4 Accounting and structural analysis of virtual water embodied in trade between China and typical countries along the Belt and Road》
4 Accounting and structural analysis of virtual water embodied in trade between China and typical countries along the Belt and Road
《4.1 Overall analysis》
4.1 Overall analysis
Based on the model and data above, we first accounted the virtual water embodied in China’s import and export trade with typical countries along the Belt and Road. In 2010, the virtual water produced by China and exported to typical countries along the Belt and Road reached 17879.18 Mt, accounting for 14% of China’s total exported virtual water (128620.72 Mt) (Table 2). Russia and South Korea are the main recipients of China’s virtual water exports. The virtual water produced by typical countries along the Belt and Road and imported by China reached 24210.33 Mt, accounting for 11% of China’s total imported virtual water (214841.30 Mt). India and Indonesia are the main sources of China’s virtual water imports.
《Table 2》
Table 2. China’s virtual water embodied in trade with typical countries along the Belt and Road (Unit: Mt).

In terms of virtual water balance, China is a net importer of virtual water on the whole, while also as the same role for the typical countries along the Belt and Road. This means that China is in the virtual water flow pattern of “domestic consumption in basis of international commitment”, namely the production-based water consumption is less than consumption-based water consumption in China accompanied by the international trades with those typical BRI countries. However, for South Korea, Central and Eastern European countries, China is a net exporter of virtual water relatively, namely dometic production-based water consumption is more than consumption-based water consumption for China when trading with South Korea, Central and Eastern European countries. Because of this, China is in the patteren of “domestic commitment for foregin consumption” for embodied virtual water flows with South Korea, Central and Eastern European countries.
《4.2 Regional structure》
4.2 Regional structure
The virtual water structure of the import and export trade between the five regions of the northwest, northeast, southwest, coastal, and inland areas within China and the typical countries along the Belt and Road is shown in Fig. 1. It can be seen from the figure that the virtual water embodied in the domestic and foreign export trade in the coastal, inland, northeast, northwest, and southwest regions has decreased successively. In which, the virtual water exported to the domestic regions within China accounts for 44%, 75%, 75%, 75%, and 79% of the total exported virtual water in the coastal, inland, northeast, northwest, and southwest regions relatively. While, the proportion of virtual water exported to the typical countries along the Belt and Road accounts for 8%, 3%, 4%, 4%, and 3% of the total domestic and international exported virtual water respectively for the coastal, inland, northeast, northwest, and southwest regions within China. The coastal region is the main recipient of exported virtual water from northwest, northeast, inland, and southwest regions. The northeast region is the main recipient of exported virtual water from coastal region. While Russia and South Korea are the main recipents of virtual water exports of domestic regions in China.
《Fig. 1》

Fig. 1. China’s virtual water regional structure in domestic and foreign trade (Unit: Mt).
From Fig.1,the imported virtual water in the coastal, inland, northeast, northwest, and southwest regions within China embodied in the domestic and foreign import trades has been reduced successively. And there is an imbalance for the virtual water flows between those domestic regions and foreign countries. In which, for coastal, inland, northeast, northwest, and southwest regions within China, the virtual water imported from domestic regions within China accoutns for 57%, 45%, 53%, 69%, and 60% of the total domestic and international imports of virtual water, respectively; the virtual water imported from typical countries along the Belt and Road accounts for 5%, 6%, 5%, 4%, and 4% of the total domestic and international imports of virtual water, respectively. Within China, the inland region is the main domestic virtual water source for the northwest, northeast, and southwest regions; the northeast region is the main domestic virtual water source for the coastal and inland regions. India is the main international virtual water source for each domestic region in China.
In terms of virtual water balance, the inland, northeast, and southwest regions are net virtual water exporters as a whole, indicating that domestic production-based water consumption in those regions is more than their consumption-based water consumption accompanied by the trade with domestic regions and foreign countries. And virtual water flows in the inland, northeast, and southwest regions behave the “local commitment for non-local consumption” pattern, and the coastal region is the main recipient for the net virtual water exports for those regions. The northwest and coastal regions are the net virtual water importers with a flow pattern of “local consumption in baisis of non-local commitment”. While the inland region is the largest net virtual water importer for the northwest region, and northeast region is the the largest net virtual water importer for the coastal region. Notably, those five regions within China are net virtual water importer relatively for the typical countries along the Belt and Road.
《4.3 Industrial structure analysis》
4.3 Industrial structure analysis
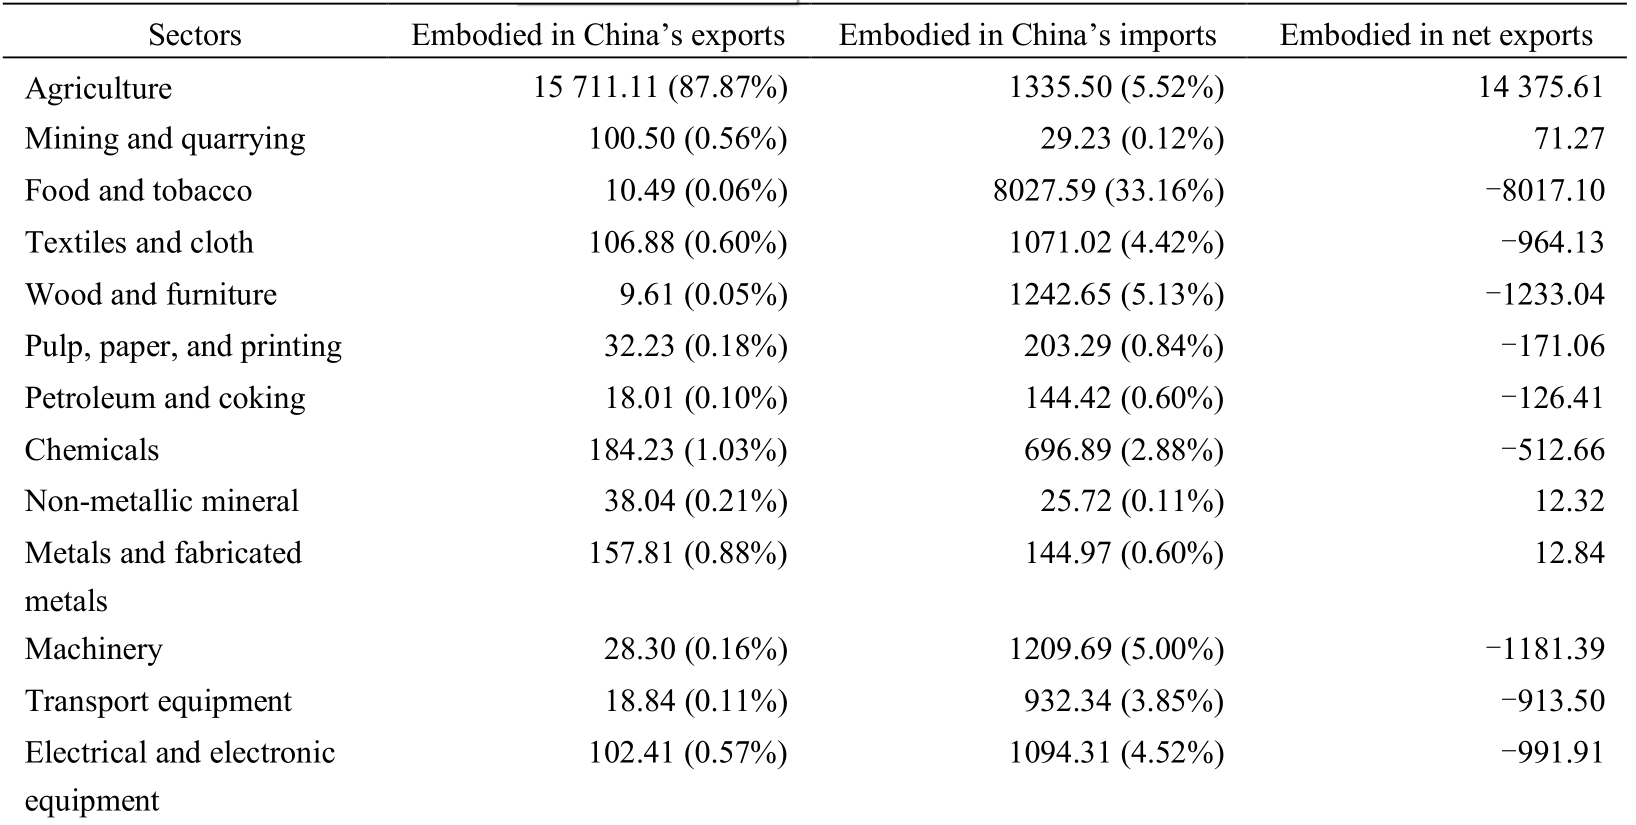
Table 3 shows the industry structure of virtual water embodied in trade between China with the typical countries along the Belt and Road. Agriculture sector is the largest net virtual water exporter, while Russia and South Korea are the main recipents of virtual water from this sector in China. The exported virtual water of agriculture sector accounts for 87.87% of the total exported virtual water in China, while its imported virtual water only accounts for 5.52%. Food and tobacco, construction, and other service sectors are the top three virtual water importers accounting for 33.16%, 12.87%, and 10.90% of total imported virtual water, while the corresponding exported virtual water ratio is less than 1%. India is a net virtual water importer in the food sector and other service sector, and Russia is a net virtual water importer in the construction sector (Fig. 2).
《Table 3》
Table 3. Industry structure of virtual water trade between China and countries along the Belt and Road (Unit: Mt).

《Fig. 2》
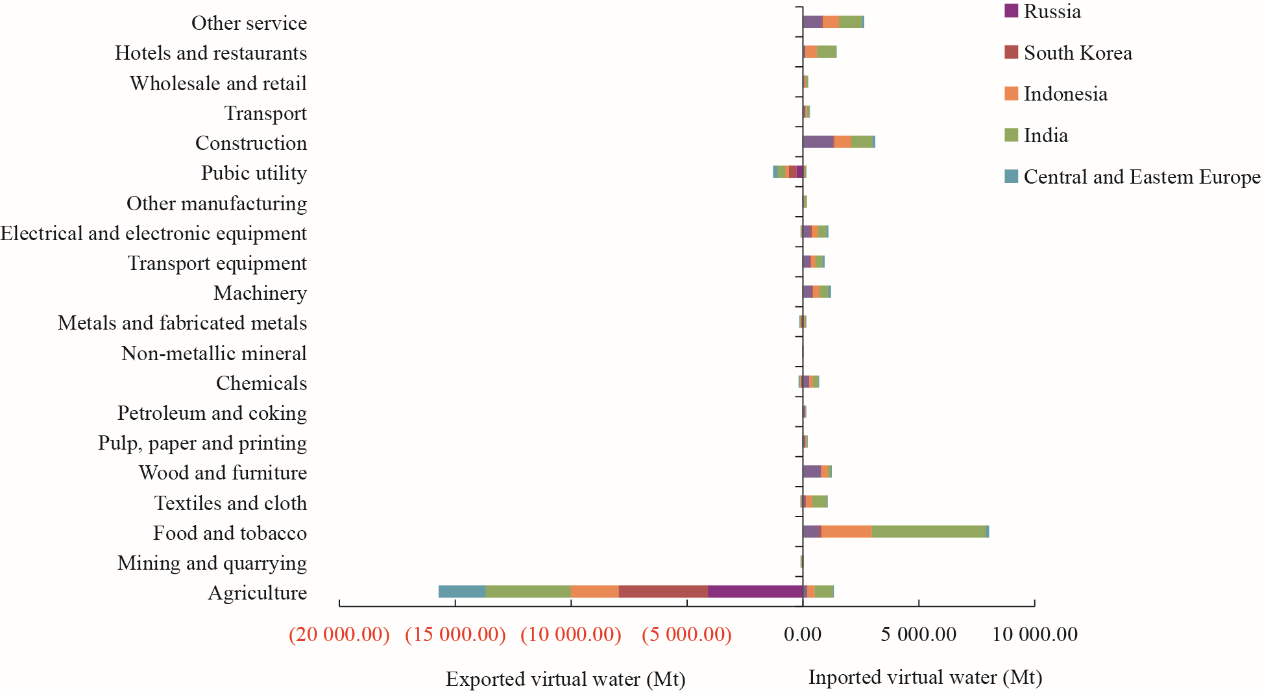
Fig. 2. Industry structure of virtual water trade between China and countries along the Belt and Road (Unit: Mt).
《5 Conclusions and policy implications》
5 Conclusions and policy implications
《5.1 Conclusions》
5.1 Conclusions
In conclusion, China is a net virtual water importer in the trade with the countries along the Belt and Road. China is in the virtual water flow pattern of “domestic consumption based on international commitment”, with the production-based water consumption less than consumption-based water consumption. The BRI has played a complementary role in China’s water resource security structure.
From the perspective of virtual water source and destination, Russia and South Korea are the main recipients of China’s exported virtual water, while India and Indonesia are the main sources of China’s imported virtual water. However, for South Korea, Central and Eastern European countries, China is a net virtual water exporter in the flow pattern of “domestic commitment for international consumption”. For the sub-national regions within China, in a whole they remain as the net virtual water importer in the trade with typical countries along the Belt and Road. However, except for the coastal region, the other four sub-national regions within China are net virtual water exporters to South Korea, Central and Eastern Europe. And the virtual water flow in those four regions are in the “local commitment for non-local consumption” pattern.
The virtual water embodied in the domestic and international export trades in China’s coastal, inland, northeast, northwest, and southwest regions has decreased successively, of which 44%–79% of exported virtual water mainly flows into domestic regions with coastal and northeast regions as the largest destintions, while 3%–8% of exported virtual water flows into the typical countries along the Belt and Road, with South Korea and Russia as the main recipients of exported virtual water. Meanwhile, 57%–69% of imported virtual water for those sub-national regions within China are from domestic provision, with inland and northeast regions are the main domestic virtual water sources and India is the main international virtual water source.
From the aspect of industry structure for virtual water, Agriculture is the largest net virtual water export sector with Russia and South Korea as its recepients of exported virtual water. Food and tobacco, construction, and other service are the top three virtual water import serctors. India is the main source of imported virtual water in the food sector and other service sector, and Russia is the main source of virtual water imports for the construction sector. Water resource management of the industries above should be further strengthened, and fluctuations should be monitored to guarantee the water resource security of China.
《5.2 Policy implications》
5.2 Policy implications
Zhang et al. [14] found that virtual water flows mainly from developing economies to developed economies. The current international division of trade and labor has led to the acquisition of water resources by developed industrialized countries from emerging economies, represented in this case by China, which will further aggravate the water shortages within emerging economies. When China is engaged in trade with typical countries along the Belt and Road, it is a net importer of virtual water as a whole. Therefore, deepening the BRI trade cooperation is crucial for China’s water resources security allocation. In the process of advancing the BRI, China should actively communicate with countries along the Belt and Road in order to strengthen cooperation in eco-environmental protection, eliminate misunderstandings, enhance mutual trust, and achieve the collaborative water conservation goal in the BRI.
China is a net exporter of virtual water to South Korea, Central and Eastern European countries. Agriculture is the largest virtual water export sector. While food and tobacco, construction, and other service are the top three virtual water import sectors. China could get virtual water benefits from trades in these three industries with typical countries along the Belt and Road. Therefore, strengthening cooperation in the virtual water net importing sectors, such as the food and tobacco, construction, and other service industries, is an efficient water management measure to promote the advancement of China’s industrial structure in the BRI production network.


 京公网安备 11010502051620号


