

《1 Introduction》
1 Introduction
Fusion energy is considered to be crucial for solving human energy problems. The International Thermonuclear Experimental Reactor (ITER) is expected to generate 500 MW of fusion power (Q > 10), which can be used to conduct relevant scientific and technological research and integrated operation demonstration of low-power density fusion reactors, test tritium proliferation. [1,2], and verify the feasibility of fusion energy applications. The experimental operation of the ITER is expected to start in 2025. However, many problems in fusion energy research, such as the testing of fusion reactor materials, need to be solved. In addition to causing more atomic displacement damage, fusion neutrons also undergo transmutation reactions with the structural elements of materials in the fusion reactor owing to the high energy of fusion neutrons, which severely affects the critical performance of the fusion reactor. In the future, the fusion neutron irradiation damage to the demonstration power station will reach 100 displacements per atom (dpa), higher than the irradiation level of the ITER. Therefore, in fusion reactor construction, an essential prerequisite is the design and construction of fusion neutron sources, which can precisely reflect the characteristics of fusion materials under fusion neutron irradiation.
Currently, the International Fusion Materials Irradiation Facility (IFMIF), which has been under construction by the European Union and Japan, adopts the accelerated deuteron-to-lithium target scheme with a large fraction of 14–40 MeV neutrons, which will affect the actual test performance of materials. Furthermore, IFMIF cannot simulate the actual gas environment exposed to fusion reaction, subject to specific questions regarding the accuracy of the irradiation test [3]. Russia proposed the use of a dynamic gas trap (GDT-NS) scheme [4,5], but the existence of the loss cone in the magnetic mirror configuration causes onset loss and affects the plasma parameters and neutron yield. Therefore, a deuterium–deuterium pulsed fusion neutron source scheme based on two-stage cascaded magnetic compression with a high compression ratio was proposed in this study. Moreover, related magnetic compression, instability, and other properties were analyzed to provide a reference for the design and construction of fusion neutron sources and the research and development of deuterium–deuterium fusion energy.
《2 Design of magnetically confined deuterium–deuterium pulse fusion neutron source》
2 Design of magnetically confined deuterium–deuterium pulse fusion neutron source
The magnetically confined deuterium–deuterium pulse fusion neutron source (referred to as “this neutron source”) generates fusion neutrons through fusion reactions. However, it has a research route different from those of existing fusion energy devices, such as tokamaks and stellarators. Existing energy devices plan to utilize deuterium–tritium reactions to obtain fusion energy, which requires the consumption of radioactive tritium. Scanty reserves of tritium are available in nature and must be prepared from lithium. However, with the emergence of new energy vehicles and other developments, lithium consumption has increased significantly worldwide, resulting in uncertainty in evaluating fusion energy reserves based on the deuterium–tritium reaction. Additionally, existing heating methods, such as neutral beams and ion cyclotrons, heat the plasma to 15 keV to achieve the deuterium–tritium reaction target. It is difficult for this heating method to achieve further breakthroughs in the plasma heating effect in the short term. In addition, it is challenging to apply it to research on deuterium−deuterium fusion energy (large-scale deuterium−deuterium fusion reaction requires a higher plasma temperature, and it is expected that 30 keV or higher is required).
The neutron source heats the plasma via magnetic compression. Magnetic compression mainly uses advanced techniques, such as pulse power and robust magnetic field technology, to simultaneously improve the plasma electrons, ion temperature, and plasma density. The simultaneous rise of the plasma electron and ion temperature helps to increase the reaction cross-section. The increase in plasma density is beneficial for improving the single-reaction fusion power density and neutron flux density and accumulating the total fusion neutron flux for multiple reactions. This provides the possibility of achieving a high-flux-density fusion neutron source. The increase in fusion power density also helps increase the total fusion power, generating conditions for deuterium−deuterium fusion energy development.
Compared with tokamaks, the field-reversed configuration (FRC) plasma has complete axisymmetry, a no-nest relationship with the magnetic field coils, and a relatively simple structure, which is beneficial to the overall design of the magnetic compression system. Its specific pressure (β ) is close to 1, valuable for using a lower confinement magnetic field to generate a higher-parameter plasma target. Currently, the C-2W device of TAE Technologies in the United States uses a magnetic field of approximately 0.2T to confine density n to 3 × 10¹⁹ m-3. The total temperature T=Te+Ti reaches 3 keV (Te and Ti are the electron and ion temperatures, respectively) and can maintain the plasma for 30 ms [6], laying the foundation for the further development of magnetic compression with high compression ratios. In studies on the FRC, the sum of the electron and ion temperatures (the total temperature) is typically used to conduct a correlation analysis such as β; hence, this approach was adopted in this study.
A schematic of the structure of the deuterium–deuterium pulse fusion neutron source is shown in Fig. 1(a). The structure mainly comprises a field-reverse plasma former, magnet and power supply system, vacuum chamber system, and neutral beam injection system. The field-reverse plasma generator generates high-quality field-reverse plasma, and the plasma is injected into the collision fusion zone at high speed. The neutral beam injection system is primarily used to generate directional current before compression to overcome plasma instability and can be turned off early during compression to reduce the average power requirement of the neutral beam. The structure of the above system is similar to that of the C-2 series device, ensuring a high-performance initial field-reverse plasma formation. In addition to generating the background magnetic field before compression, the magnet and power supply system generates a two-stage cascaded magnetic-compression magnetic field during the compression process. At the same time, the vacuum chamber system uses high-resistance materials to suppress induced eddy currents to ensure that the vacuum chamber rises rapidly in the magnetic field configuration. The specific power supply design adopts a power supply scheme to recycle the magnetic energy, as shown in Fig. 1(b). The converter enters the inverter mode after the compression process is completed, and the magnetic energy of the coil is recovered to improve the utilization efficiency of the magnetic compression energy and discharge repetition frequency.
《Fig. 1》
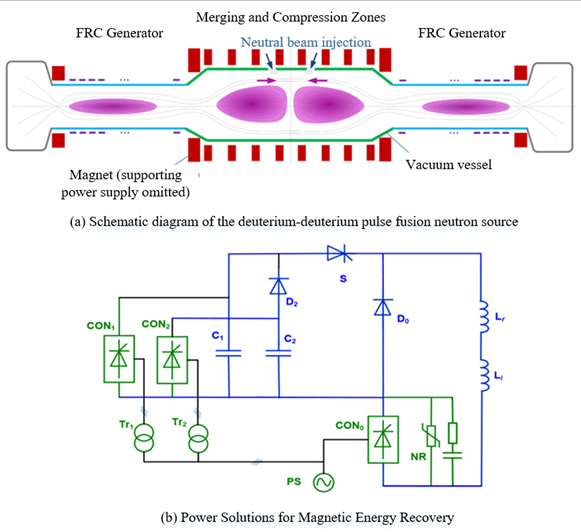
Fig. 1. Schematic of deuterium–deuterium pulse fusion neutron source and power supply scheme for magnetic energy recovery.
Note: C1 is the rapid compression capacitor; C2 is the slow compression capacitor; S is the main discharge switch; Lt and Lr are the compression coils in the left and right symmetrical positions, respectively; D0 is the freewheeling diode; D2 is the isolation diode; PS is the power grid; Tr1 and Tr2 represent the transformer; CON0 represents the inverter; CON1 and CON2 represent the rectifier; NR represents the nonlinear resistance-capacitance absorption branch.
Unlike typical magnetic compression, the deuterium–deuterium pulse fusion neutron source uses a two-stage magnetic compression mode. Fig. 2 shows a diagram of the two-stage magnetic compression timing for a high compression ratio. The first stage is the rapid or adiabatic compression stage (0–t1 ), which uses adiabatic magnetic compression to simultaneously increase the plasma temperature and density to significantly increase the fusion reaction rate, particularly the deuterium–deuterium fusion reaction rate. This results in a high flux density. The second stage is the slow compression stage (t1–t2 ), which maintains field inversion through slow compression, prevents magnetic diffusion of the plasma, increases the fusion reaction time, and increases the total yield of fusion neutrons.
《Fig. 2》
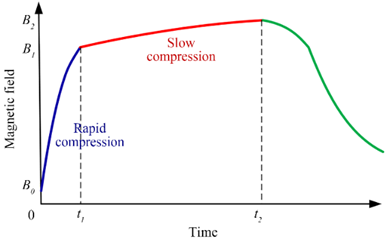
Fig. 2. Diagram of two-stage magnetic compression timing with high compression ratio.
《3 Magnetic compression analysis of magnetically confined pulsed deuterium–deuterium fusion neutron source》
3 Magnetic compression analysis of magnetically confined pulsed deuterium–deuterium fusion neutron source
As mentioned above, two-stage cascade magnetic compression with a high compression ratio is the core of the technical solution of pulsed deuterium–deuterium fusion neutron sources. Moreover, the analysis of relevant magnetic compression is crucial for determining the plasma characteristics and neutron yield of the neutron source. From the ideal adiabatic magnetic compression without energy loss, this paper presents the basic model of field-reversed plasma parameters, adopts the energy loss process to modify the model, and considers the magnetic flux loss of the field-reversed plasma to evaluate the maintenance effect of the second-stage compression on high-parameter plasma. The analysis process of the two-stage cascade magnetic compression is depicted in Fig. 3.
《Fig. 3》

Fig. 3. Flow chart of magnetic compression analysis of pulsed deuterium–deuterium fusion neutron source.
《3.1 Adiabatic magnetic compression analysis》
3.1 Adiabatic magnetic compression analysis
The pulsed deuterium–deuterium fusion neutron source adopts a two-stage cascade magnetic compression mode in which the first stage is adiabatic magnetic compression. The effectiveness of adiabatic magnetic compression as a plasma heating technique has been demonstrated in both tokamaks and simple FRCs. The adiabatic toroidal compressor (ATC) of Princeton University has developed tokamak plasma with a five-fold increase in plasma density and a three-fold increase in ion temperature by adiabatic magnetic compression. However, the FRX-C/LSM device of the Los Alamos National Laboratory in the United States used adiabatic magnetic compression to increase the temperature and density of the simple field-reversed plasma by 10 and 5 times, respectively [7,8], consistent with the corresponding theoretical models [7,9]. The evolution of the length, temperature, density, and boundary magnetic field of the field-reversed plasma during compression can be determined using a high-performance one-dimensional model of field-reversed adiabatic magnetic compression [8], as follows:
\(\begin{aligned} L & \propto \chi_{\mathrm{s}}^{\frac{(3-\epsilon)(4-4(\gamma-1))}{3}}\langle\beta\rangle^{\frac{-(1+\epsilon-\gamma \epsilon)}{\gamma}} \end{aligned}\) (1-1)
\(\begin{aligned} T_{\mathrm{m}} & \propto \chi_{\mathrm{s}}^{\frac{-(3-\epsilon) 4(\gamma-1)}{3}}\langle\beta\rangle^{\frac{(1+\epsilon)(\gamma-1)}{\gamma}} \end{aligned}\) (1-2)
\(\begin{aligned} n_{\mathrm{m}} & \propto \chi_{\mathrm{s}}^{\frac{-(3-\epsilon)(6-4(\gamma-1))}{3}}\langle\beta\rangle^{\frac{-(1+\epsilon)(\gamma-1)}{\gamma}} \end{aligned}\) (1-3)
\(\begin{aligned} B_{\mathrm{w}} & \propto \chi_{\mathrm{s}}^{-3+\epsilon} \end{aligned}\) (1-4)
where L is the axial length of the plasma, \(\begin{aligned} \chi_{\mathrm{s}} & =\frac{R_{\mathrm{s}}}{R_{\mathrm{w}}} \end{aligned}\) is the ratio of the radius of the plasma separatrix radius Rs to the radius of the vacuum chamber Rw , ϵ is the equilibrium section coefficient with a value of (-1–0) , γ is adiabatic coefficient, n is the density of plasma, and the subscript m represents the maximum value. Bw is the magnitude of the magnetic field at the wall of the vacuum chamber, \(\langle\beta\rangle\) is the average specific pressure, \(\langle\beta\rangle=\frac{1}{\pi \chi_{\mathrm{s}}^{2}} \int_{0}^{R_{\mathrm{S}}} \frac{P}{B_{0}^{2} /\left(2 \mu_{0}\right)} d A\) , P is the plasma pressure, B0 is the magnetic field in vacuum, A is the plasma cross-section, π is pi, and μ0 is the magnetic medium constant in a vacuum. By applying the axial equilibrium condition, \(\langle\beta\rangle=1-\frac{\chi_{\mathrm{s}}^{2}}{2}\) can be obtained.
The above model can be used to derive the relationship between the parameters before and after the compression of the field-reversed plasma. Taking the C-2W device as an example and considering the increase in the field-reversed plasma density resulting from the optimization of the former field-reversed plasma, the existing plasma-related parameters of the C-2W device plasma are expected to reach the following design values: n=5×10¹⁹ m-3; T=3 keV; B0=0.25 T . In this ideal adiabatic magnetic compression model, after the confinement magnetic field is compressed from 0.25 T to 12 T , the temperature and density of the field-reversed plasma reach 62.7 keV and 3.7×10²¹ m-3 , respectively. These values preliminarily verify the feasibility of magnetic compression to pulsed deuterium–deuterium fusion neutron sources.
《3.2 Magnetic compression analysis considering energy balance》
3.2 Magnetic compression analysis considering energy balance
In contrast to the ideal adiabatic model, the high-temperature plasma generates various energy loss channels owing to its high temperature and density gradients. The anomalous transport induced by turbulence causes the relevant energy balance analysis results to deviate significantly from the experimental results. The energy confinement time-scaling law has emerged as a valuable method in research on magnetic confinement fusion.
Compared with the tokamak configuration, the field-reversed plasma has been investigated less extensively, and its energy confinement time calibration still lacks significant practical tests. However, this does not prevent using new field-reversed plasma devices, such as the C-2 series, to obtain valuable results. The scaling law of the electron energy confinement time of the C-2 series devices is expressed as follows [10]:
\(\begin{array}{l} \tau_{\mathrm{E}, \mathrm{e}}=\tau_{\mathrm{E}, \mathrm{e} 0}\left(\frac{R_{\mathrm{S}}}{R_{\mathrm{S}0}}\right)\left(\frac{T_{\mathrm{e}}}{T_{\mathrm{e}0}}\right)^{1.8}\left(\frac{B_{\mathrm{W}}}{B_{\mathrm{W}0}}\right)^{-1.3} \end{array}\) (2)
where τE,e is the electron energy confinement time, Te is the electron temperature, and subscript 0 represents the initial value. Because the total energy loss comprises the electron and ion energy losses, the total energy constraint and the electron and ion energy constraints satisfy the following relationship:
\(\begin{array}{l} \frac{W_{\mathrm{tot}}}{\tau_{\mathrm{E}}} \geq \frac{W_{\mathrm{e}}}{\tau_{\mathrm{E}, \mathrm{e}}}+\frac{W_{\mathrm{i}}}{\tau_{\mathrm{E}, \mathrm{i}}} \end{array}\) (3)
where W represents the energy, and Wtot , We , and Wi are the total energy, electron energy, and ion energy, respectively, and τE , τE,e , and τE,i are the total energy confinement time, electron energy confinement time, and ion energy confinement time, respectively. The experimental results for the C-2 device demonstrate that the total energy confinement time is higher than the electron energy confinement time (their ratios are 3.4 [11], 4.64, and 5.22 [12]), indicating that the ion energy confinement time is longer than the electron energy confinement time. This result is consistent with the experimental finding that the ion temperature of the C-2 device is significantly higher than the electron temperature. In addition, the experimental results for the ATC device show that the ion energy confinement time is longer than the electron energy confinement time [8]. Although ions are the reactants of the fusion reaction, the temperature of the ions determines the cross-section of the relevant fusion reaction. For simplicity, it is conservatively assumed that the total energy confinement time is always 3.4 times longer than the electron energy confinement time. Consequently, when the initial radius Rs = 0.55 m , the total energy confinement time is scaled to 20.6 ms for the design parameters of the C-2W device.
Based on the above ion energy confinement time, the variations in the plasma temperature and density with the magnetic field corresponding to different magnetic compression characteristic times can be calculated. After reflecting the energy loss, the change in the internal plasma energy Wpnon is related to the compression time. The time evolution of the energy can be expressed as follows:
\(\begin{array}{l} \frac{\mathrm{d} W_{p}^{\text {non }}}{d t}=-\frac{W_{p}^{\text {non }}}{\tau_{\mathrm{E}}}+P_{\text {in }} \end{array}\) (4)
where τE is the energy loss rate, Pin is the power of the magnetic field to perform work on the plasma during magnetic compression and is the energy input. When the value of τE is low, that is, when the energy confinement time is longer than the magnetic compression characteristic time, Pin can be approximated as the power of the magnetic field to perform work during the adiabatic compression process. That is, the rate of increase in plasma internal energy during the adiabatic compression process is defined as follows:
\(\begin{array}{l} P_{\text {in }}=\frac{d W_{p}^{\text {adi }}}{d t} \end{array}\) (5)
where t is the time, and \(W_{p}^{\text {adi }}\) is the internal energy of plasma during adiabatic compression, expressed as follows.
\(\begin{array}{l} W_{p}^{\text {adi }}=\int \frac{P}{\gamma-1} d V=\frac{B_{0}^{2} /\left(2 \mu_{0}\right)}{\gamma-1} \int \frac{P}{B_{0}^{2} /\left(2 \mu_{0}\right)} d V\\ \end{array}\) (6)
In the one-dimensional compression model, the maximum pressure value \(P_{\mathrm{m}}=\frac{B_{0}^{2}}{2 \mu_{0}}\) can be obtained from the radial force balance and by considering the columnar structure.
\(\begin{array}{c} W_{p}^{\text {adi }} \approx \frac{\frac{B_{0}^{2}}{2 \mu_{0}}}{\gamma-1} L \int_{0}^{R_{\mathrm{s}}} \frac{P}{\frac{B_{0}^{2}}{2 \mu_{0}}} d A=\frac{P_{\mathrm{m}}}{\gamma-1} L \pi R_{s}^{2}\langle\beta\rangle=\frac{n_{\mathrm{m}} T_{\mathrm{m}}}{\gamma-1} L \pi R_{\mathrm{w}}^{2} \chi_{\mathrm{s}}^{2}\left(1-\frac{\chi_{\mathrm{s}}^{2}}{2}\right) \end{array} \) (7)
Its total differential is expressed as follows.
\(\begin{array}{c} \quad d W_{p}^{\text {adi }}=W_{p}^{\text {adi }}\left[\frac{d n_{\mathrm{m}}}{n_{\mathrm{m}}}+\frac{d T_{\mathrm{m}}}{T_{\mathrm{m}}}+\frac{1-\chi_{\mathrm{s}}^{2}}{1-\frac{\chi_{\mathrm{s}}^{2}}{2}} \frac{d \chi_{\mathrm{s}}}{\chi_{\mathrm{s}}}+\frac{d L}{L}\right] \end{array} \) (8)
The variation amplitude of the internal energy of the plasma during adiabatic compression can be calculated using the compression scaling law (Equation (1)).
When energy is lost, the decrease caused by energy loss must be considered in calculating the total plasma temperature, Tm . Here, the total energy \(W_{p}^{\text {non }}\) reflecting the energy loss is used for estimation.
\(\begin{array}{c} T_{\mathrm{m}}=\frac{W_{p}^{\text {non }}(\gamma-1)}{\pi n_{\mathrm{m}} R_{\mathrm{w}}{ }^{2} \chi_{\mathrm{s}}{ }^{2} L\left(1-\frac{\chi_{\mathrm{s}}{ }^{2}}{2}\right)} \end{array}\) (9)
Taking the design parameters of the C-2W device as the initial values (Tm0 = 3Te0 = 3 keV; nm0 = 5×10¹⁹ m-3; B0 = 0.25 T ), the compressive magnetic field waveform is assumed to be \(\begin{array}{c} B_{\mathrm{w}}=B_{\mathrm{m}} \sin \left(\frac{2 \pi t}{4 t_{\text {rise }}}\right) \end{array}\). The characteristic time of the rising edge of the magnetic field,trise , is assumed to be 1/4 of the sinusoidal period (5000 μs ), and Bm is the maximum value that the magnetic field can reach, which is 12 T (B1 in Fig. 2). Next, the evolution of the field-reversed plasma temperature and density with the compressive magnetic field is obtained (Fig. 4). During the early stages of compression, there is a minimal difference from the ideal adiabatic model. In the latter, because the energy confinement time in the scaling law decreases inversely proportional to the magnetic field, the ion temperature is lower than that of the adiabatic model but still exceeds 55.9 keV . This value is still acceptable for conducting large-scale deuterium–deuterium fusion reactions.
《Fig. 4》
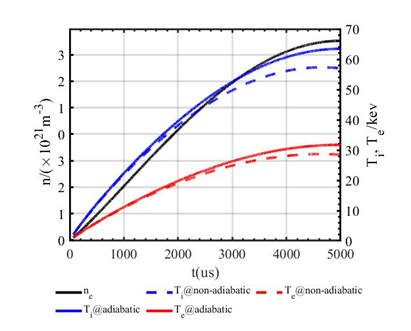
Fig. 4. Evolution of temperature and density of field-reversed plasma with compressive magnetic field.
《3.3 Second-stage magnetic compression analysis》
3.3 Second-stage magnetic compression analysis
For the pulsed deuterium–deuterium fusion neutron source, it is crucial to maintain a high-parameter plasma for a specific period to achieve the continuous generation of fusion neutrons. Compared with conventional magnetic compression, the device proposed in this study couples a second-stage compression process after the adiabatic compression stage to supplement the corresponding magnetic flux loss.
Confining the magnetic flux is the main approach to maintaining field-reversed plasma configuration, and current diffusion is an important reason for magnetic flux loss. Experiments on C-2 series devices show that the current transmitted by high-energy ions plays a significant role in stability; therefore, the Spitzer resistance of the ions can be used to estimate the corresponding current diffusion time [13].
\(\begin{array}{c} \tau_{\eta}=\mu_{0} \sigma_{\perp}\left(\frac{R_{\mathrm{s}}}{2}\right)^{2}=\frac{\mu_{0}\left(\frac{R_{\mathrm{s}}}{2}\right)^{2}}{\eta_{\perp}} \approx 1.26 \mathrm{~s} \end{array}\) (10)
In Equation (10), σ⊥ is the resistance of the plasma in the direction perpendicular to the magnetic field lines, η⊥ is the conductance of the plasma in the direction perpendicular to the magnetic field lines, and \(\frac{R_{\mathrm{s}}}{2}\) is the characteristic length. Given that the magnetic flux decays exponentially, the variation in the magnetic flux Ψ with time can be expressed as follows:
\(\begin{array}{c} \Psi=\Psi_{0} e^{-\frac{t}{\tau_{\eta}}} \end{array}\) (11)
where Ψ0 is the magnetic flux captured by the plasma on completion of the first-stage compression. After 60 ms , the flux inside the plasma is 95.35% of Ψ0 , indicating that the flux loss is expected to be lower than 5%. If the magnetic field rises slowly and proportionally within the corresponding time (assuming that the magnetic field increases by 15%, and B2 = 1.15×B1 = 13.8 T ), the induced current generated via slow magnetic compression can effectively compensate for the magnetic flux loss caused by current diffusion and stabilize the plasma magnetic flux.
Energy loss is another critical factor. Because the compression keeps the plasma away from the vacuum chamber, the increase in the vacuum gap decreases the energy transfer in the radial direction; hence, the bremsstrahlung of the plasma may be the main channel for energy loss. The bremsstrahlung loss can be expressed as follows [13]:
\(\begin{array}{c} P_{\text {brem }}=1.54 \times 10^{-38} n_{\mathrm{e}}^{2} \sqrt{k T_{\mathrm{e}}} Z_{\mathrm{eff}}^{2} \mathrm{~W} \cdot \mathrm{m}^{-3} \end{array}\) (12)
where ne is the electron density, k is the Boltzmann constant, and Zeff is the effective charge of the plasma.
Considering a postcompression plasma temperature of approximately 55 keV and the C-2W device Zeff = 1.2 [14], the estimated radiation power is approximately 16.4 MW . However, while bremsstrahlung continues to lose energy, the self-heating effect of the deuterium–deuterium fusion reaction gradually manifests, and only the primary reaction of the deuterium–deuterium fusion reaction generates a fusion power of 19.9 MW . Although the particles still need to be thermalized after the reaction, it is possible to compensate for the corresponding power loss and maintain a relatively stable plasma temperature. Another advantage of magnetic compression devices is that compression reduces wall reflux, which can further decrease the Zeff of the device and the corresponding radiation loss.
《4 Analysis of magnetohydrodynamic instability of pulsed deuterium–deuterium fusion neutron source》
4 Analysis of magnetohydrodynamic instability of pulsed deuterium–deuterium fusion neutron source
Magnetohydrodynamic (MHD) instability is a common problem of all magnetic confinement fusion devices; therefore, it is crucial to evaluate the probable effects of instability during magnetic compression. For FRC plasmas, the tilt and rotation modes are the main MHD instabilities. The linear calculation results obtained from the NIMROD code [15] based on a single-fluid MHD model show that for the above design parameters, such as the initial temperature, density, and magnetic field, the growth rates of the dominant MHD modes are in the characteristic Alfven time scale of approximately 0.3 μs . This time scale is significantly shorter than the achievable time scale of current ramping for magnetic compression and, thus, may severely hinder the progress of adiabatic compression.
However, a wide range of regions exists within weak and even null magnetic fields owing to the reversal of the magnetic field in the FRC plasma. The finite Larmor radius (FLR) effects of thermal and energetic ions and their related two-fluid kinetic effects cannot be ignored. Calculations based on the linear two-fluid MHD model in the NIMROD code show that as the FRC plasma temperature increases, stabilization owing to FLR effects becomes increasingly dominant. The growth rates of the main MHD modes, such as the tilt and rotation modes, can be substantially reduced, and the model structure is significantly different from that of the single-fluid model (Figs. 5 and 6). If the kinetic effects of thermal ions and externally injected fast particles are more fully reflected in the hybrid kinetic MHD model, the FLR effects of the thermal ions and energetic particles are expected to completely suppress the primary MHD instabilities in the FRC. C-2 series devices have exhibited suppressing instability using neutral beam injection, as confirmed in NIMROD simulations [16], indicating that MHD instability is not insurmountable for an FRC device. In the compression scheme proposed in this study, the fast particles are mainly formed by the neutral beam injection system before the two-stage magnetic compression. They are expected to be further accelerated by electromagnetic induction during magnetic compression. Thus, these fast particles can continuously suppress MHD instabilities during magnetic compression, and the power for neutral beam injection (NBI) is no longer required in the magnetic compression stage. Considering that the increased power requirement for the NBI system before compression is demanded by the increased plasma size and the shutdown of the NBI system after compression, the power required for an average system of neutral beam injection is expected to be lower than 10 MW.
《Fig. 5》
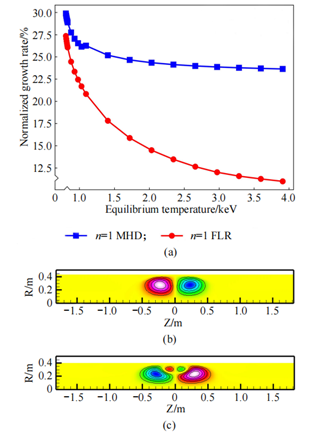
Fig. 5. Tilt mode: (a) FLR effects on growth rates at equilibrium, and distribution of pressure perturbation within R-Z cross-section from (b) single-fluid and (c) FLR two-fluid NHD models.
《Fig. 6》
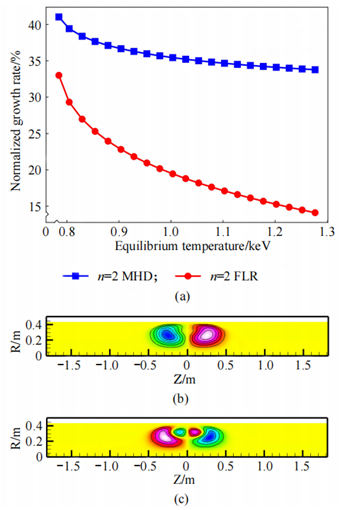
Fig. 6. Rotation mode: (a) FLR effects on growth rates at equilibrium, and distribution of pressure perturbation within R-Z cross-section from (b) single-fluid and (c) FLR two-fluid NHD models.
Based on previous experimental studies involving kinetic effect correction, the empirical criterion for the stability of the FRC operation is typically obtained as S/κ<3.5 , where κ is the ratio of the axial dimension to the radial dimension of the FRC separatrix surface, that is, the elongation of the separatrix surface, and S is the ratio of the major radius Rs of the separatrix surface to the ion skin depth, S=Rs/δi [17]. If the magnetic compression process is sufficiently slow, that is, the compression characteristic time is significantly longer than the equilibrium relaxation time of the FRC plasma, the compression process can be considered approximately quasistatic. Based on the quasistatic approximation using the one-dimensional adiabatic magnetic compression model and empirical criterion, the MHD parameter region of the FRC adiabatic magnetic compression process that satisfies the empirical stability condition can be expressed as follows:
\(\begin{aligned} \frac{S}{\kappa} & =\frac{2 \sigma^{2} R_{\mathrm{s}}^{2}}{c L_{\mathrm{i}} \sigma^{\frac{2(3-\epsilon-\gamma)}{\gamma}}\left(1-\frac{\sigma^{2}}{2}\right)^{-\frac{1+\epsilon-\gamma \epsilon}{\gamma}}} \times \\ & \sqrt{\frac{e^{2} n_{\mathrm{i}} \sigma^{-\frac{2(3-\epsilon)}{\gamma}\left(1-\frac{\sigma^{2}}{2}\right)^{-\frac{(1+\epsilon)(\gamma-1)}{\gamma}}}}{\epsilon_{0} m_{\mathrm{i}}}}<3.5 \end{aligned}\) (13)
where c is the speed of light, Li is the initial plasma length, e is the electron charge, mi is the electron rest mass, and ni is the initial plasma number density.
Consider the design FRC parameters for the neutron source before magnetic compression: Rs=0.55 m , ni=5.0×10¹⁹ m-3 , and Tm0=3 keV , in which these initial parameters are similar to the designed values for the C-2W device. The initial plasma length Li=23.3 m is increased compared to the C-2W parameter with an initial elongation of approximately 40. Although the elongation is slightly beyond the experimentally accessible region of early simple FRC plasma with a ratio range of κ=3–30 [18], it is still within reasonable experimental values considering the advancements in FRC plasma control technology. The calculation results show that the stabilization window during compression increases as the initial equilibrium plasma length Li increases, and S/κ gradually increases. At Li=23.3 m , when the radial compression ratio becomes lower than approximately 0.27, or the equivalent stable compression ratio of the magnetic field intensity increases above approximately 50, S/κ starts to exceed 3.5, FRC no longer satisfies the stability conditions, and the unstable MHD mode commences (Fig. 7). Based on the analysis above, the magnetic compression process of the FRC plasma has a wide range of stability parameters, assuming that the quasistatic approximation is satisfied. Table 1 lists the critical plasma parameters of the corresponding pulsed deuterium–deuterium fusion neutron sources before and after the magnetic compression.
《Fig. 7》
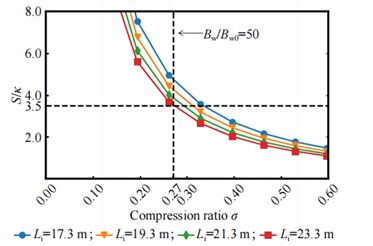
Fig. 7. FRC stability criterion parameter S/κ as functions of plasma radial compression ratio σ and magnetic field compression ratio Bw/Bw0 for different initial plasma lengths Li before compression during adiabatic compression stage.
Note: The black dashed line indicates the critical value of the stability condition, S/κ=3.5 ; the stable parameter regions are below the black dashed line.
《Table 1》
Table 1. Key plasma parameters of deuterated-deuterium pulse fusion neutron sources.
| Parameters | Before compression | After compression |
| Bw | 0.25 T | 12 T |
| n | 5.0×10¹⁹ m-3 | 3.7×10²¹ m-3 |
| Ti | 2.0 keV | 55.9 keV |
| Te | 1.0 keV | 27.9 keV |
| S/k | 0.376 | 3.5 |
| Rs | 0.55 m | 0.15 m |
| L | 23.3 m | 4.15 m |
| First stage compression period | 5 ms | |
| Second stage compression period | 60 ms | |
《5 Estimation of fusion products and neutron flux density》
5 Estimation of fusion products and neutron flux density
This study initially estimated the fusion products and neutron flux density of the pulsed deuterium–deuterium fusion neutron source. The deuterium–deuterium fusion reaction and its secondary reactions include the following.
\(\begin{array}{l} { }_{1}^{2} \mathrm{D}+{ }_{1}^{2} \mathrm{D} \rightarrow{ }_{1}^{3} \mathrm{~T}(1.01 \mathrm{MeV})+\mathrm{p}^{+}(3.02 \mathrm{MeV}) \end{array}\) (14-1)
\({ }_{1}^{2} \mathrm{D}+{ }_{1}^{2} \mathrm{D} \rightarrow{ }_{2}^{3} \mathrm{He}(0.82 \mathrm{MeV})+\mathrm{n}^{0}(2.45 \mathrm{MeV}) \) (14-2)
\({ }_{1}^{3} \mathrm{~T}+{ }_{1}^{2} \mathrm{D} \rightarrow{ }_{2}^{4} \mathrm{He}(3.5 \mathrm{MeV})+\mathrm{n}^{0}(14.1 \mathrm{MeV}) \) (14-3)
\({ }_{2}^{3} \mathrm{He}+{ }_{1}^{2} \mathrm{D} \rightarrow{ }_{2}^{4} \mathrm{He}(3.66 \mathrm{MeV})+\mathrm{p}^{+}(14.64 \mathrm{MeV})\) (14-4)
The primary reactions include two types: the deuterium–deuterium reaction generates tritium and protons, and the total fusion energy is 4.03 MeV; or produces helium-3 and neutrons, which have total fusion energy of 3.27 MeV. The probability of both is 50%. Accordingly, the fusion power corresponding to the primary reaction (excluding neutrons) is \(\begin{array}{c} P=\frac{1}{2} k_{\mathrm{DD}} n_{\mathrm{D}} n_{\mathrm{D}} V \frac{\left(E_{\mathrm{T}, \mathrm{p}}+E_{\mathrm{H}, \mathrm{n}}\right)}{2}=19.9 \mathrm{MW} \end{array}\) , and the power corresponding to 2.45 MeV neutrons is P2.45 = 9.9 MW . kDD is the reaction rate, which refers to the total cross-section of the two channels of the deuterium–deuterium reaction [19]. nD is the density of deuterium particles, and V is the plasma volume. \(E_{\mathrm{T}, \mathrm{p}}\) and \(E_{\mathrm{H}, \mathrm{n}}\) are the nuclear energies released by nuclear reaction equations (14-1) and (14-2), respectively. \(\frac{\left(E_{\mathrm{T}, \mathrm{p}}+E_{\mathrm{H}, \mathrm{n}}\right)}{2}\) is the average released nuclear energy, and the same particle reaction (deuterium–deuterium reaction) should be multiplied by a factor of 1/2.
The tritium and helium-3 generated during the primary reaction undergo a secondary reaction with deuterium. With the accumulation of the components, they play an increasingly significant role in the reactions. The instantaneous power and total fusion power of the deuterium–tritium neutron corresponding to the secondary reaction and the powers corresponding to different moments of the secondary compression are listed in Table 2. The total fusion power at each moment exceeds 30MW. The plasma size after compression is Rs = 0.15 m, L = 4.15 m , indicating an approximately cylindrical plasma (Table 1). The lateral area is primarily considered when calculating the average neutron flux density because there is a gap between the sample and the plasma (at 1.05×Rs ).
\(S_{\text {side }}=2 \pi \times 1.05 \times R_{\mathrm{s}} \times L=4.1 \mathrm{~m}^{2}\) (15)
By dividing the average fusion neutron power by the area Sside , the pulsed neutron flux density at 1.05× Rs after 60 ms compression is 3.68 MW/m2 . Under a 55% duty cycle, its average neutron flux density is approximately2.02 MW/m2 , thus satisfying the test requirements of the fusion demonstration reactor. After the secondary compression time reaches 60 ms , the instantaneous power of deuterium–tritium neutrons surpasses the instantaneous power of deuterium–deuterium neutrons (Table 2). This shows the potential advantages of the proposed design scheme in generating high-power density deuterium–tritium neutrons.
《Table 2》
Table 2. Corresponding power at different times of secondary compression.
| Power (MW) | Second stage compression period (ms) | ||||
| 20 | 40 | 60 | 80 | 100 | |
| Deuterium- deuterium neutron power | 9.9 | 9.9 | 9.8 | 9.8 | 9.7 |
| Deuterium-tritium neutron power | 3.6 | 7.1 | 10.1 | 12.9 | 15.5 |
| Average fusion power | 32.3 | 34.6 | 36.7 | 38.7 | 40.5 |
《6 Summary》
6 Summary
In this study, a new fusion neutron source scheme based on FRC for two-stage cascaded magnetic compression is proposed to take advantage of the high specific pressure of field-reversed plasma, achieve a high-parameter deuterium–deuterium fusion neutron source, reduce tritium consumption, and satisfy the requirements of fusion reactor material testing. Thus, the scheme provides strong support for constructing fusion demonstration power stations.
In addition, this scheme is expected to generate a fusion power exceeding 30 MW based on the deuterium–deuterium reaction. For example, using advanced technologies such as superconducting coils and their magnetic energy returning to the power grid through inverters can significantly minimize the energy loss during the cascaded magnetic compression process. The facility is expected to reach a high operating level of Q ≥ 1, reflecting the bright prospects of this design scheme in research on actual ultimate human energy and deuterium–deuterium fusion energy.
《Acknowledgements》
Acknowledgements
We thank Dr. Houyang Guo for his valuable contribution to this study.
《Compliance with ethics guidelines》
Compliance with ethics guidelines
The authors declare that they have no conflict of interest or financial conflicts to disclose.


 京公网安备 11010502051620号


