
《1 Introduction 》
1 Introduction
In 2020, China proposed that “we should strive to peak carbon dioxide emissions before 2030 and achieve carbon neutralization by 2060.” To achieve this goal, it is necessary to reduce the proportion of fossil fuel consumption, accelerate the adjustment of energy structures, promote the development of wind energy, solar energy, and biomass, and realize transformation of energy [1–5]. Assessment modeling for economic and social benefit evaluation of energy transition shows that the accelerated energy transition dominated by new energy is essential to achieve carbon neutrality before 2060 [6].
Solar energy is exceptionally clean form of energy, and it has one of the largest energy sources. Distributed photovoltaics are characterized by small investments and rapid construction. They can effectively use solar energy and convert it into electric energy, thereby solving power consumption problems, including energy shortages in rural and high energy demand in industrial areas. Recently, integrated photovoltaic building systems have proven to be a feasible renewable power generation technology. Spain, Australia, South Korea, the United States, and other countries have conducted technical research on the combination of distributed photovoltaics and buildings [7]. Additionally, studies have analyzed the suitability of building photovoltaic power stations in China using remote sensing data and meteorological and topographic factors [8,9]. According to the current area of distributed photovoltaic installed roofs in urban and rural buildings, the installed capacity is predicted to reach 100 GW by 2025 and 215 GW by 2030 [10].
As an important carrier of distributed photovoltaics, the areas of building roofs are directly related to their construction. Previous studies have established data model samples of building roofs in small areas [11,12]. The results of this method have uncertainties owing to difference in the building characteristics in different regions. Therefore, distributed photovoltaic potential calculations require in-depth knowledge of building areas nationwide. The traditional method cannot capture the large-scale building areas of the entire country. Satellite remote sensing data are rich sources of data due to its rapid development in recent years, and spatial resolution within meters has been achieved, which provides a significant data source for the estimation of building areas. In addition, artificial intelligence and deep learning technology have the potential for the intelligent recognition and extraction of buildings. Remote sensing data such as synthetic aperture radar, lidar, and multispectral data [13–16] are mainly used for building extraction [17–19]. A building dataset of typical cities was also formed using intelligent recognition technology with an extraction accuracy of approximately 80%–85% [20].
Previous studies primarily extracted building roofs from local areas and calculated the national distributed photovoltaic construction potential. However, there are many uncertainties in this estimation process, from the sample to the whole. In this study, we used deep learning technology to extract national building areas using 2020 national high-resolution satellite remote sensing images. Nationwide building roof data were calculated using the construction proportion coefficient of typical areas, including city classification, location partition, and national average methods. This work is important as it can obtain the spatial distribution of building areas nationwide in a relatively accurate manner and calculate the building areas suitable for the installation of distributed photovoltaics. Furthermore, the building locations can be helpful in facilitating the construction of dynamic monitoring mechanisms for building areas and distributed photovoltaic construction, to dynamically monitor the progress of distributed photovoltaic construction projects. In addition, the distributed photovoltaic and population data can be analyzed to provide decision support for distributed photovoltaic construction project planning.
《2 Method》
2 Method
《2.1 Satellite images and auxiliary data 》
2.1 Satellite images and auxiliary data
2.1.1 Base map data
National high-resolution satellite remote sensing images from 2020 were used to extract the building areas. The satellite data comprised the national true color orthophoto satellite image map with the highest resolution. It has the characteristics of an excellent real-time monitoring and good positioning accuracy and has been widely used in several fields.
2.1.2 Training sample data
Considering the different characteristics of buildings in various regions, training sample was collected from six regions, Northeast, Northwest, North, Central, South, and Southwest China. These samples were derived from the data of the geographical situation monitoring, 2017. In each region, buildings in two provincial capitals, five ordinary cities, and 10 counties were selected (Fig. 1). Building construction data from 29 typical cities were used as training samples for independent buildings (Fig. 2).
《Fig. 1》
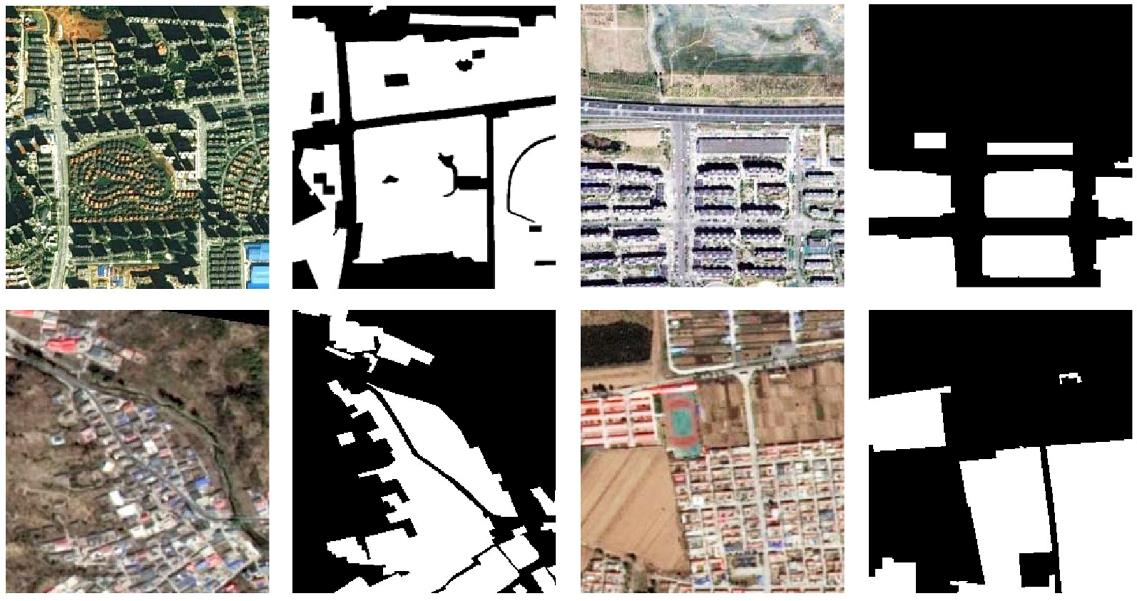
Fig. 1. Training samples of building areas.
《Fig. 2》

Fig. 2. Training samples of independent building.
2.1.3 other auxiliary data
The urban area vector, formed by manual editing of 2 m-resolution satellite remote sensing images, was used to validate the data. The construction proportion coefficient was calculated according to the independent building and building area vectors extracted from typical cities. Simultaneously, some Internet maps were also used as auxiliary references to optimize the method. In addition, the correlation between the roof area and population was analyzed using the total population data released by the National Bureau of Statistics at the end of 2020.
《2.2 Extraction of building area by convolution neural network technology》
2.2 Extraction of building area by convolution neural network technology
The convolution neural network designed in this study was divided into three parts: (1) feature extraction layer: ResNet50 depth residual network was used for feature extraction to obtain the Feature1 map; (2) pyramid pooling layer: pooling layers were set with different sizes, each Feature1 map was processed, and the features were input into a convolution network for extraction. Finally, up-scaling was performed to obtain Feature2 of the same size as Feature1; (3) feature fusion output layer: Feature1 and Feature2 were fused, and the results were output through the convolution layer.
Neural network training is based on a training platform developed by PyTorch. For both building area extraction and independent building extraction, a large number of graphics processing unit computing resources were used for training to obtain a model capable of in-depth learning and iterative update of subsequent algorithms. When selecting the network feature extraction layer and training hyperparameters, the sample area was integrated to improve the generalization ability of the final algorithm.
National building areas and typical urban independent buildings were automatically extracted according to the criteria mentioned above. This was the basis for the subsequent roof area calculation.
《2.3 Estimation of building areas》
2.3 Estimation of building areas
The extraction of independent buildings is difficult because it is affected by various factors including the resolution of satellite images, different spectra of the same object, and diversity of building forms. Owing to the limitation of the 2 m-resolution images, it is impossible to distinguish independent buildings in dense urban building areas. Therefore, this study estimated the roof area of urban buildings in China by extracting building areas and construction proportion coefficients.
Based on the extracted vectors of the building areas, the urban and rural areas were divided according to the urban area range into 29 typical cities. The corresponding construction proportion coefficients were then calculated. The construction proportion coefficient formula is as follows:

Areai and Areab represent the total area of independent buildings and the area of building areas, respectively. The relationship between building areas and independent building is shown in Fig. 3.
《Fig. 3》

Fig. 3. Sketch map of the relationship between building areas and independent buildings.
Considering the differences in building forms and spatial distribution across the country, this study designed three methods to calculate the building roof area.
(1) City classifications
Typical cities were divided into three levels: municipalities, provincial capital cities, and other cities, and the building proportion coefficients corresponding to the three types of cities were calculated. In addition, municipalities and provincial capital cities were divided into main urban areas and suburbs, and different CPC values were used to calculate the roof area.
(2) Location partitioning
Typical cities are divided into five regions: North China and Northeast China, Central China, East China, South China, and Southwest and Northwest according to the location of different cities. The CPC values of the five regions were calculated and used for the other cities in the same region.
(3) National averages
All CPC values of typical cities were averaged to obtain the national average CPC which was used to calculate the roof area of each region.
《2.4 Construction path analysis of distributed photovoltaics》
2.4 Construction path analysis of distributed photovoltaics
The correlation between the distributed photovoltaic construction potential and the population data was analyzed using the roof area data calculated by the above three methods and the population data from the 2020 statistical data. Furthermore, the target provinces with large potential and higher priority for the installation of distributed photovoltaic were determined.
《3 Results and analysis of distributed photovoltaic potential evaluation》
3 Results and analysis of distributed photovoltaic potential evaluation
《3.1 Evaluation of the estimation method for building roof area》
3.1 Evaluation of the estimation method for building roof area
According to the classification, division, and national average building ratio coefficient, the building roof area of the urban area of Tongzhou in Beijing and the urban area of Jinpu New District in Dalian were calculated. Based on the independent building and building area extraction algorithm, the independent building and building areas of these two urban areas were obtained, and the difference calculated using each method was compared with this as the true value. Compared with the true value extracted from the building area, the value calculated using the three methods, classification, division, and national average, had a lower accuracy rate in the urban area of Tongzhou, Beijing, and higher accuracy in the urban area of Jinpu New District, Dalian. The average correct rate was 81.63%, indicating that the method of dividing different regions according to the city level is more reliable in the calculation of the roof area.
《3.2 Results and analysis of national building area extraction 》
3.2 Results and analysis of national building area extraction
3.2.1 Building areas
The construction area of the country is approximately 1.18×10⁵ km2 , which is mainly distributed in Shandong, Henan, Hebei, and Jiangsu, accounting for approximately 40% of the total construction area of the country. The construction area of Ningxia, Qinghai, Tibet, and other provinces in the western region was relatively small, accounting for only 1.4% of the total construction area of the country (Fig. 4).
《Fig. 4》
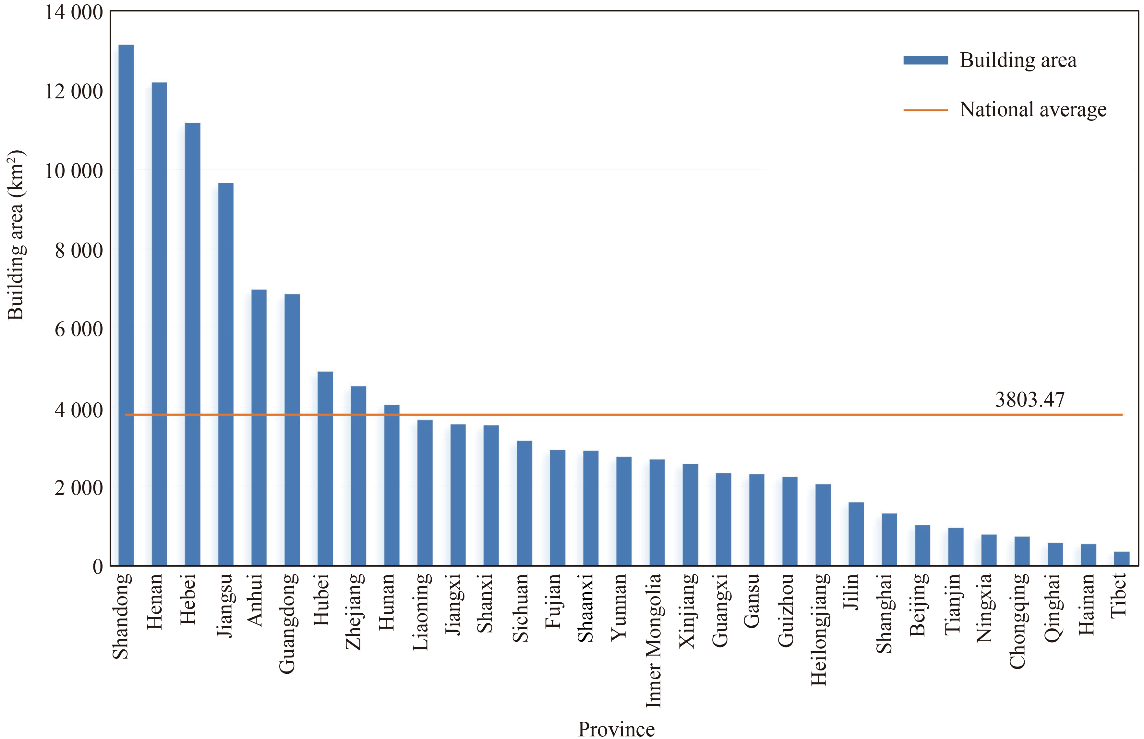
Fig. 4. Statistical map of building area of various provinces.
According to the size of the construction area, the first echelon was Shandong, Henan, Hebei, and Jiangsu, whose construction area was > 8000 km2 . The second echelon was Anhui and Guangdong, with statistical areas of 5000– 8000 km2 . The third echelon was Hubei, Zhejiang, Hunan, Liaoning, Jiangxi, and Shanxi, with a statistical area of 3500–5000 km2 . The fourth echelon included Sichuan, Fujian, Shaanxi, Yunnan, Inner Mongolia, Xinjiang, Guangxi, Gansu, Guizhou, Heilongjiang, and Jilin, with a statistical area of 1500–3500 km2 . The fifth echelon was Shanghai, Beijing, Tianjin, Ningxia, Chongqing, Qinghai, Hainan, and Tibet, with a statistical area < 1500 km2 .
3.2.2 Independent building areas in typical cities
In order to calculate the building proportion coefficient, Beijing, Tianjin, Shanghai, Chongqing, Shijiazhuang, Hohhot, Harbin, Nanjing, Hangzhou, Hefei, Fuzhou, Nanchang, Jinan, Zhengzhou, Wuhan, Guangzhou, Shenzhen, Guiyang, Kunming, Xi’an, Chengdu, Lhasa, Changsha, Lanzhou, Xining, Baoding, Changzhou, Suzhou, and Qingdao were selected. In these 29 cities, independent buildings were extracted for estimating the area statistics. The total area of independent buildings in the 29 typical cities was approximately 1900 km2 , of which Shanghai, Beijing, and Guangzhou were in the top three (> 150 km2 ), while Lhasa, Xining, and Hohhot were in the bottom three (< 15 km2 ).
3.2.3 CPC values and roof areas estimation
The average value of CPC in municipalities was 0.5539, whereas those of provincial capital cities and other cities were 0.4726 and 0.3769, respectively. The calculation method of the building roof area divided the municipality into the main urban area and the suburbs, and the main urban area was determined by a coefficient of 0.5539, while the suburban area was determined by a coefficient of 0.3769. The provincial capital was also divided into the main urban area and the suburbs. The main urban area was determined according to a coefficient of 0.4726, while the suburban area was determined according to a coefficient of 0.3769. The coefficients of other cities below the provincial capital were unified to 0.3769 to determine the building roof area. Therefore, the area of building roofs in all provinces across the country could be calculated.
The urban building roof area was calculated for each province in the country according to the calculated ratio of building proportions (Table 1). East China had the largest building roof area, which was much larger than that of other regions, followed by North China, South China, and Central China, while the Northwest, Southwest, and Northeast areas had smaller roof areas.
《Table 1》
Table 1. The average CPC based on location.
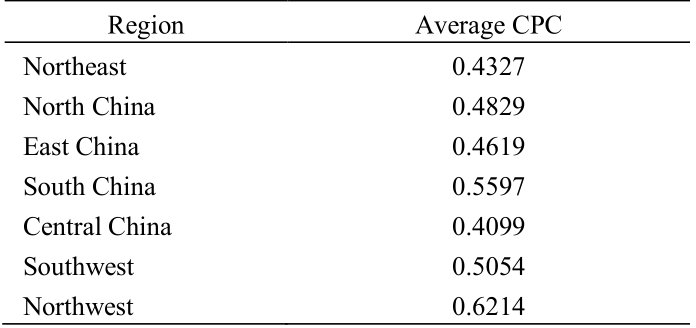
The coefficient for the national average was 0.4789. The area of urban building roofs in each province was then calculated. The results show that Jiangsu, Shandong, and Guangdong rank in the top three, while Tibet, Qinghai, and Hainan rank in the bottom three.
A statistical comparison was made of the urban building roof areas across the country obtained by the calculation methods: city classification, location division, and national average (Fig. 5). Except for a few areas, the roof area calculated using the city classification was the smallest, and the roof area calculated using the national average was the largest.
《Fig. 5》

Fig. 5. Statistics on the roof area of urban buildings of provinces.
《3.3 Correlation analysis of roof area and population》
3.3 Correlation analysis of roof area and population
Correlation analysis showed that the roof area calculated by the three methods was significantly positively correlated with the population statistics of each province in 2020, and all the correlation coefficients were above 0.84 (Fig. 6).
《Fig. 6》
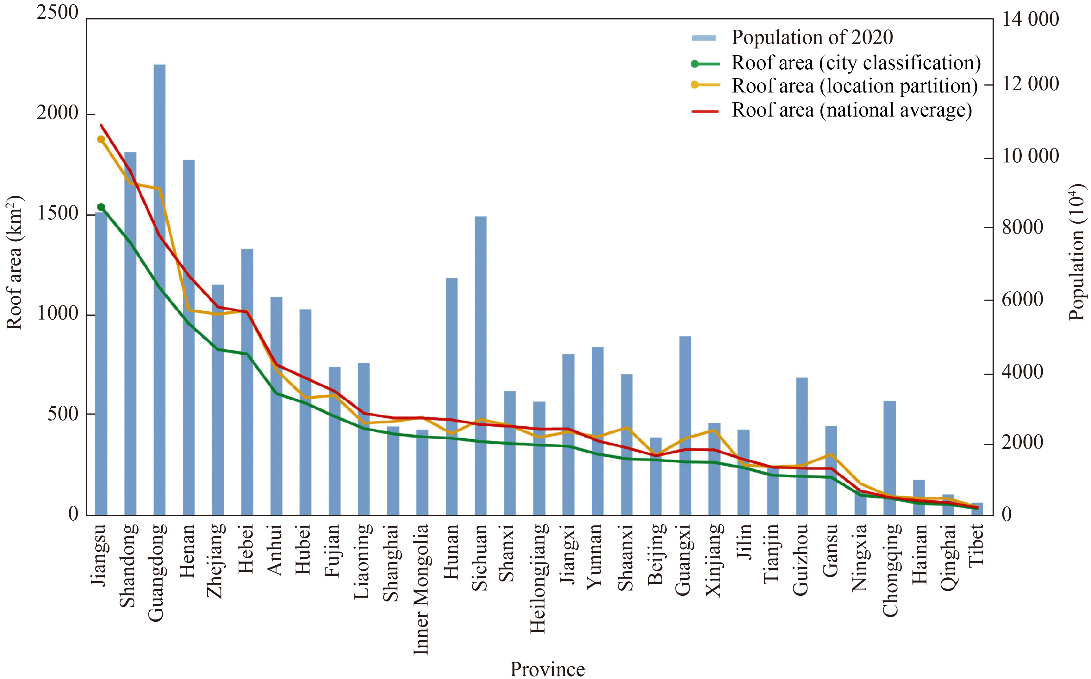
Fig. 6. Statistics of urban building roof area and population (2020).
Furthermore, we used the roof area calculated by the city classification algorithm with the highest average accuracy rate and the population data of each province at the end of 2020 to obtain a scatter diagram, in which each province was divided by roof area and population. There were four types of roof areas: large roof area–large population, small roof area–large population, small roof area–small population, large roof area–small population (Fig. 7). Eight provinces, Jiangsu, Shandong, Guangdong, Henan, Hebei, Zhejiang, Anhui, and Hubei, were in the first quadrant, with a large roof area, large distributed photovoltaic potential, and a large population. Yunnan, Guangxi, Hunan, and Sichuan are in the second quadrant, where the roof area was small but the population was relatively large. Eighteen provinces, including Tibet, Ningxia, Qinghai, Hainan, Tianjin, Beijing, Jilin, Gansu, Chongqing, Guizhou, Inner Mongolia, Heilongjiang, Shanghai, Xinjiang, Shanxi, Liaoning, Shaanxi, and Jiangxi, were located in the third quadrant, with a small roof area and a relatively small population. Only Fujian was located in the fourth quadrant, which had a large roof area and a small population.
《Fig. 7》
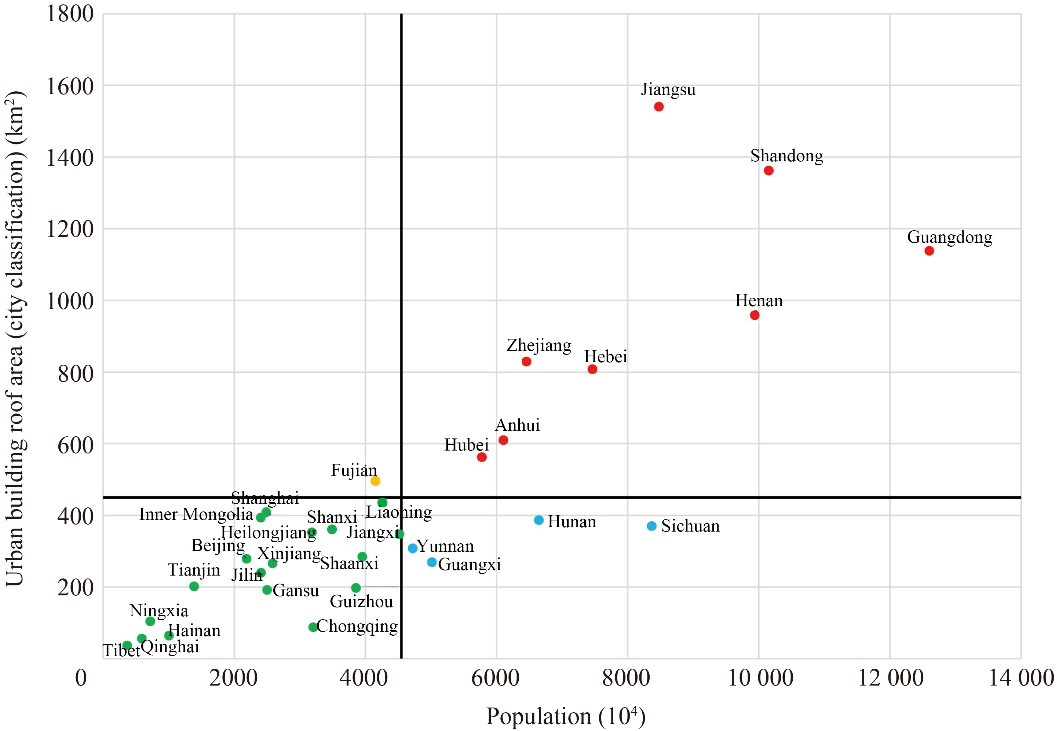
Fig. 7. Scatter diagram of the distribution of roof area by graded method and population (2020).
《4 Conclusion and Suggestion 》
4 Conclusion and Suggestion
《4.1 Conclusion 》
4.1 Conclusion
This study used high-resolution satellite remote sensing images from 2020 to obtain a nationwide building-roof dataset. By analyzing the spatial distribution of building roof areas in different regions, their potential for the construction of distributed photovoltaics was explored. Combined with the population data of the provinces, the promotion path of distributed photovoltaic construction was analyzed.
Satellite remote sensing has the characteristics of being macroscopic, precise, and objective. Therefore, it is an important and feasible method for the extraction of large-scale building roofs and monitoring of distributed photovoltaics. Deep learning technology was used to extract building roofs with an accuracy of 81.63%, which met the data requirements for subsequent analysis.
An analysis of the nationwide building roof areas showed that approximately 1.4×10⁴ km2 of roofs can be deployed with distributed photovoltaics. Roofs are mainly distributed in Jiangsu, Shandong, and Guangdong provinces, which together account for approximately 30% of the national distributed photovoltaic potential.
《4.2 Development proposal》
4.2 Development proposal
Faced with the goal of “striving to peak carbon dioxide emissions by 2030 and achieve carbon neutralization by 2060,” vigorously developing new energy sources such as solar and wind energy has become increasingly important. The recently issued Carbon Peaking Action Plan by 2030 has proposed to comprehensively promote large-scale exploitation and high-quality development of wind and solar power, adhering to both centralized and distributed photovoltaic power generation, and accelerate the construction of wind and photovoltaic power generation bases. Implementing innovative upgrades and special applications of the smart photovoltaic technology, as well as the ”photovoltaic+” model, would promote the establishment of a diversified layout of photovoltaic power generation. Based on the results of the monitoring, analysis, and evaluation of the national distributed photovoltaic construction potential, the following development suggestions were formulated.
The first is to promote the construction of distributed photovoltaics nationwide through hierarchical classification. In accordance with the principles of in-situ construction and use of distributed photovoltaics, construction should begin in densely populated eastern regions with a large potential for distributed photovoltaic construction. Eight provinces, including Jiangsu, Shandong, and Guangdong, should be the first echelons. The second echelon could be 18 provinces including Tibet, Ningxia, and Qinghai. Yunnan, Guangxi, Hunan, and Sichuan are recommended as the third echelons, where other distributed photovoltaics, besides those installed on roofs, could be considered. Fujian, is the fourth echelon, where distributed photovoltaics can be used to generate electricity for its own consumption and the surplus proportion can be used to obtain income.
The second is to set up a dynamic national monitoring mechanism for the distributed photovoltaic construction. Through the exploration and application of cutting-edge technology, the automatic extraction and monitoring capabilities of distributed photovoltaics and buildings can be realized. Based on the results of national building remote sensing monitoring data in 2020, a national distributed photovoltaic construction dynamic monitoring mechanism could be developed, which could use multi-period time-series satellite remote sensing images to dynamically and regularly track the progress of national distributed photovoltaic construction.
The third is to support carbon neutrality and carbon-peaking path planning decisions. According to the construction progress of distributed photovoltaics in different regions, an evaluation of the implementation effect against policy requirements and content could be performed. Furthermore, precise information on dynamic building changes in different regions could help improve the spatial pattern of the distributed photovoltaic construction potential and update the distributed photovoltaic construction plan path appropriately.


 京公网安备 11010502051620号


